3/4-Bar GRG / RGR Pattern (Conditional 4th Candle)This indicator can be used to identify the Green-Red-Green or Red-Green-Red pattern.
It is a price action indicator where a price action which identifies the defeat of buyers and sellers.
If the buyers comprehensively defeat the sellers then the price moves up and if the sellers defeat the buyers then the price moves down.
In my trading experience this is what defines the price movement.
It is a 3 or 4 candle pattern, beyond that i.e, 5 or more candles could mean a very sideways market and unnecessary signal generation.
How does it work?
Upside/Green signal
Say candle 1 is Green, which means buyers stepped in, then candle 2 is Red or a Doji, that means sellers brought the price down. Then if candle 3 is forming to be Green and breaks the closing of the 1st candle and opening of the 2nd candle, then a green arrow will appear and that is the place where you want to take your trade.
Here the buyers defeated the sellers.
Sometimes candle 3 falls short but candle 4 breaks candle 1's closing and candle 2's opening price. We can enter on candle 4.
Important - We need to enter the trade as soon as the price moves above the candle 1 and 2's body and should not wait for the 3rd or 4th candle to close. Ignore wicks.
I have restricted it to 4 candles and that is all that is needed. More than that is a longer sideways market.
I call it the +-+ or GRG pattern.
Stop loss can be candle 2's mid for safe traders (that includes me) or candle 2's body low for risky traders.
Back testing suggests that body low will be useless and result in more points in loss because for the bigger move this point will not be touched, so why not get out faster.
Downside/Red signal
Say candle 1 is Red, which means sellers stepped in, then candle 2 is Green or a Doji, that means buyers took the price up. Then if candle 3 is forming to be Red and breaks the closing of the 1st candle and opening of the 2nd candle then a Red arrow will appear and that is the place where you want to take your trade.
Sometimes candle 3 falls short but candle 4 breaks candle 1's closing and candle 2's opening price. We can enter on candle 4.
We need to enter the trade as soon as the price moves below the candle 1 and 2's body and should not wait for the 3rd or 4th candle to close.
I have restricted it to 4 candles and that is all that is needed. More than that is a longer sideways market.
I call it the -+- or RGR pattern.
Stop loss can be candle 2's mid for safe traders ( that includes me) or candle 2's body high for risky traders.
Back testing suggests that body high will be useless and result in more points in loss because for the bigger move this point will not be touched, so why not get out faster.
Important Settings
You can enable or disable the 4th candle signal to avoid the noise, but at times I have noticed that the 4th candle gives a very strong signal or I can say that the strong signal falls on the 4th candle. This is mostly a coincidence.
You can also configure how many previous bars should the signal be generated for. 10 to 30 is good enough. To backtest increase it to 2000 or 5000 for example.
Rest are self explanatory.
Pointers
If after taking the trade, the next candle moves in your direction and closes strong bullish or bearish, then move SL to break even and after that you can trail it.
If a upside trade hits SL and immediately a down side trade signal is generated on the next candle then take it. Vice versa is true.
Trades need to be taken on previous 2 candle's body high or low combined and not the wicks.
The most losses a trader takes is on a sideways day and because in our strategy the stop loss is so small that even on a sideways day we'll get out with a little profit or worst break even.
Hold targets for longer targets and don't panic.
If last 3-4 days have been sideways then there is a good probability that day will be trending so we can hold our trade for longer targets. Target to hold the trade for whole day and not exit till the day closes.
In general avoid trading in the middle of the day for index and stocks. Divide the day into 3 parts and avoid the middle.
Use Support/Resistance, 10, 20, 50, 200 EMA/SMA, Gaps, Whole/Round numbers(very imp) for identifying targets.
Trail your SL.
For indexes I would use 5 min and 15 min timeframe.
For commodities and crypto we can use higher timeframe as well. Look for signals during volatile time durations and avoid trading the whole day. Signal usually gives good targets on those times.
If a GRG or RGR pattern appears on a daily timeframe then this is our time to go big.
Minimum Risk to Reward should be 1:2 and for longer targets can be 1:4 to 1:10.
Trade with small lot size. Money management will happen automatically.
With small lot size and correct Risk-Re ward we can be very profitable. Don't trade with big lot size.
Stay in the market for longer and collect points not money.
Very imp - Watch market and learn to generate a market view.
Very imp - Only 4 candles are needed in trading - strong bullish, strong bearish, hammer, inverse hammer and doji.
Go big on bearish days for option traders. Puts are better bought and Calls are better sold.
Cluster of green signals can lead to bigger move on the upside and vice versa for red signals.
Most of this is what I learned from successful traders (from the top 2%) only the indicator is mine.
Range

EMA Dual with SL/TP ATR basedDouble EMA with cross and direction display.
Calculate stop loss / take profit based on ATR
If entering is not in the recognize direction also SL/TP is display (inversed values)
SL is 2xATR and TP is 4xAT by default - can be change
Also, SL/TP can be calculated at cross or at actual - see the table.

Sessions [Trade Tribe HQ]Color-coded session ranges with ADR% labels to help you trade smarter, not harder.
This tool marks New York, London, Tokyo, and Sydney sessions, showing their ranges, highs/lows, VWAPs, and ADR%.
🔹 Key Features
Colored session boxes (NY, London, Tokyo, Sydney)
Session highs & lows, VWAP, and trendlines
Dashboard showing active sessions, volume, and %ADR
ADR% labels at session close
🔹 How It Helps
Spot session traps, moves, and reversals faster
Manage expectations using ADR% (no chasing over-extended moves)
Identify overlap zones (London → NY) for volatility spikes
Simplify cycle tracking across global markets
Market Sessions Marker—making it easy to see where the energy has been spent and where opportunity is building next.
Created with ❤️ by TraderChick – part of the Trade Tribe HQ community.
If you found this tool useful, check out my profile for more strategies, classes, and resources.

Total Points Range by exp3rtsThis indicator measures and displays the true intraday movement of a market by approximating tick-level activity using 1-second data aggregation. Instead of only looking at net candle movement, it sums every price change during a session, giving traders a more accurate picture of market effort and volatility.
Total Points Moved (TPM) – Captures the full distance traveled by price, not just the net gain/loss.
Bullish vs. Bearish Movement – Separates upward and downward moves so you can see who dominated the session.
Custom Sessions – Define your own session start/end times and time zone for precise tracking.
End-of-Session Summary – Automatically plots a label at session completion with totals for TPM, bullish, and bearish movement.
Visual Session Highlighting – Background shading makes it easy to see when the chosen session is active.
This tool is useful for:
Understanding the true effort vs. result of price movement
Comparing volatility across sessions
Identifying whether bulls or bears contributed more to market swings
Supporting order flow and tick-based trading strategies

Trend Heat Meter by JaeheePurpose
A compact, overlay gauge that shows where the current close sits within the last 50 bars’ high-low range. It converts price position into a 0–100% “heat” scale and renders a vertical gradient from Frozen (low end) to Overheated (high end).
How it works
• Looks back 50 bars to get highest(high, 50) and lowest(low, 50).
• Normalizes the current close into a percentile: (close − low) / (high − low) * 100.
• Draws a vertical cold→hot bar at the right side of the chart, with a pointer and a fixed-width percentage readout (two decimals) to avoid jitter.
• Labels the extremes as Overheated (top) and Frozen (bottom).
• The script is an overlay and does not modify candles or generate orders.
What makes it different
• Pure position metric: No EMA smoothing or oscillation math. It’s a direct percentile of price inside a rolling range, so interpretation is immediate.
• Jitter-free readout: Fixed-width numeric formatting keeps the value visually stable as price ticks.
• High signal legibility: A single, color-coded “thermometer” avoids multi-plot clutter and works well on any chart style.
• Non-repainting logic: Uses only in-bar values and a rolling 50-bar window; no future bars are referenced.
Inputs
• Use Black Text (White→Black): Switches label/pointer text from white to black for dark or light chart themes.
(Length and visual rows are internally set to 50 and 21 for a consistent footprint.)
Practical use
Trend context
• >70% = price is trading near the upper segment of its recent range → bullish pressure / “hot.”
• <30% = price is trading near the lower segment of its recent range → bearish pressure / “cold.”
Confluence
• Combine with your entry method (structure breaks, OB/FVG, KZ sessions, etc.).
– Prefer long setups when the meter stays >50% and rising.
– Prefer short setups when the meter stays <50% and falling.
Risk management
• Treat extreme reads (>85% or <15%) as potential exhaustion zones inside ranges; wait for confirmation before fading.
Timeframes & markets
• Works on any timeframe and symbol. Large-cap, liquid instruments typically provide the cleanest read.
Notes and limitations
• The meter shows relative position, not momentum or volatility. Pair it with your preferred filters for full trade qualification.
• It does not produce buy/sell signals, alerts, or TP/SL levels.
• Visual table draws only on the last bar for efficiency.
Compatibility
• Pine Script® v6
• Overlay: true
Disclaimer
This script is for educational purposes only and is not financial advice. Trading involves risk. Test on a demo and use proper risk management.

Time Range by exp3rtsTime Window highlights a custom time range directly on your chart, helping you focus on specific market sessions or trading hours.
Key Features:
Highlights a custom time range with a shaded background
Fully adjustable start and end time (hour & minute)
Supports multiple time zones (e.g., GMT, UTC, Europe/Berlin)
Optional market color shading inside the window (bull/bear neutral tone)
Use Cases:
Mark London Open, New York Session, or any session overlap
Focus on high-probability trading hours
Visualize your backtesting timeframe or algo activity window
Track premarket or after-hours activity for futures or indices
Customization:
Set the beginning and end time in your local or exchange time zone
Choose your timezone string (e.g., "GMT", "Etc/UTC", "America/New_York")
Automatically colors candles in the time window for easy visibility
Atlantean Sideways / Range Regime DetectorPurpose
When using trend based indicators, you can skip the false signals when there is a sideways action, protecting you from the false signals.
Flags likely sideways/range phases using three checks:
Weak trend (ADX from DMI)
Price compression (Bollinger Band Width, normalized)
Low volatility (NATR = ATR/Price%)
Logic
isSideways = (ADX < adxThresh) AND (bbNorm < 0.25) AND (NATR < natrMax)
When true: bars + background turn teal and a provisional Range High/Low (rolling rangeWin) is drawn.
Key Inputs
DMI: diLen(22)
Optimized for 15 mins Bitcoin, could change it to 14 for more general approach
ADX: adxSmooth(14), adxThresh(18)
Volatility: lenATR(14), natrMax(1.8)
Visuals: rangeWin(20), bar/range toggles
Quick Tuning
More signals: raise adxThresh to 20–25, raise natrMax to 2.5–4.0, increase BB cutoff by editing bbNorm < 0.25 --> 0.35–0.50.
Smoother range lines: increase rangeWin to 30–40.
Use Cases
Mean reversion inside teal ranges.
Breakout prep when price closes outside the drawn range after teal ends. Could be used as a signal although not suggested.
Filter trend systems: skip trades when sidewaysCond is true. This is the main purpose, for it to be combined with trend based indicators, like Supertrend.
Alert
“Sideways Detected” triggers when isSideways is true.
Script could be expanded upon your requests.

Opening Candle Zone with ATR Bands by nkChartsThis indicator highlights the opening range of each trading session and projects dynamic ATR-based zones around it.
Key Features
Plots high and low levels of the opening candle for each new daily session.
Extends these levels across the session, providing clear intraday support and resistance zones.
Adds ATR-based offset bands above and below the opening range for volatility-adjusted levels.
Customizable colors, ATR length, and multiplier for flexible use across markets and timeframes.
Adjustable session history limit to control how many past levels remain on the chart.
How to Use:
The opening range high/low often acts as strong intraday support or resistance.
The ATR bands give an adaptive volatility buffer, useful for breakout or mean-reversion strategies.
Works on any market with clear session opens.
This tool is designed for traders who want to combine session-based price action with volatility insights, helping identify potential breakouts, reversals, or consolidation areas throughout the day.
⚠️ Disclaimer: This indicator is for educational purposes only. It does not provide financial advice or guarantee profits. Always perform your own analysis before making trading decisions.

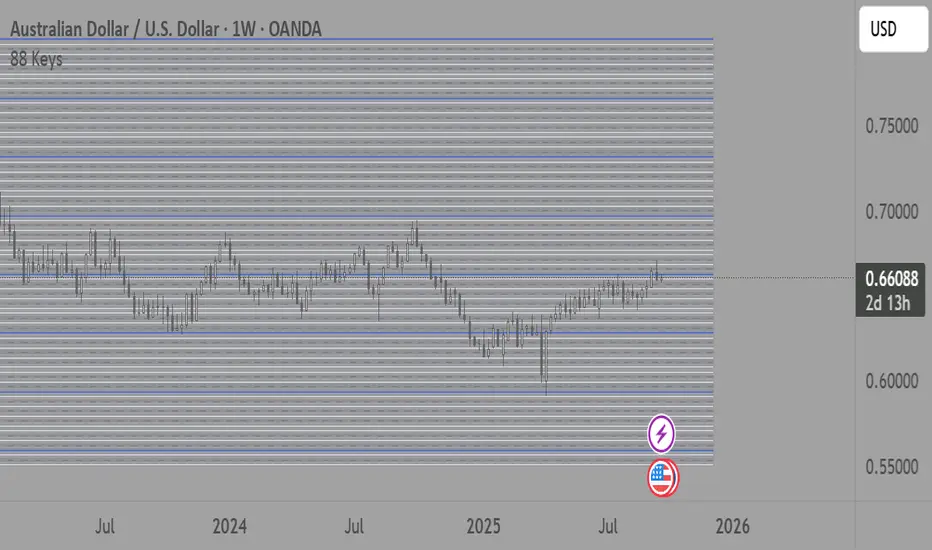
88-Key Piano Range - Musical Price Levels88-Key Piano Range - Musical Price Levels
Description:
Explore price analysis through musical harmony! This educational indicator maps price movements to the standard 88-key piano keyboard (A0 to C8), offering a creative way to visualize market ranges and explore harmonic price relationships with authentic keyboard-style background fills.
🎹 KEY FEATURES:
• Complete 88-Key Mapping - Full piano range from A0 to C8 mapped to your price range
• Piano-Style Visual Design - Clean background fills distinguishing white keys, black keys, and octaves
• Dual Anchor System - Set two time/price points to define your analytical range
• Flexible Display Options - Show all 88 keys, octaves only (C notes), or custom selections
• Harmonic Exploration - Explore consonant/dissonant key relationships based on music theory
• Real-time Price Note - See what musical note your current price represents
• Customizable Interface - Adjust colors, line widths, fills, and visual elements
🎵 EDUCATIONAL CONCEPTS:
• Octave Levels - C notes as harmonic reference points (similar to round numbers)
• Key Classifications - Natural notes (white keys) vs chromatic notes (black keys)
• Harmonic Intervals - Musical relationships applied to price analysis
• Creative Visualization - Alternative way to view price ranges and movements
⚙️ HOW TO USE:
1. Select Your Price Leg - Choose an upleg, downleg, or significant price movement to explore
2. Set Anchor A - Place at the start of your selected leg (swing low for upleg, swing high for downleg)
3. Set Anchor B - Place at the end of your selected leg (swing high for upleg, swing low for downleg)
4. Configure Display - Select all keys, octaves only, or enable background fills
5. Explore Harmonics - Enable harmony coloring to see musical relationships
6. Study Patterns - Observe how price movements align with musical intervals
🎼 CREATIVE APPLICATIONS:
• Experimental Analysis - Try a musical approach to leg analysis
• Educational Tool - Learn about mathematical relationships in both music and markets
• Alternative Perspective - View support/resistance through a musical lens
• Pattern Recognition - Explore if harmonic levels show interesting price behavior
• Fun Learning - Combine musical knowledge with trading concepts
📊 EXPERIMENTAL USE:
• Creative alternative to traditional Fibonacci levels
• Educational exploration of mathematical harmony in markets
• Interesting way to visualize price ranges and retracements
• Novel approach for musicians interested in trading concepts
Important Note: This is an educational and experimental tool that applies musical theory concepts to price analysis. It should be used for learning and exploration purposes alongside proven technical analysis methods. The musical relationships are mathematically based but not validated as reliable trading signals.
Interval Highlighter with High/Low AlertsInterval Highlighter with High/Low Alerts
Overview:
This Pine Script indicator enhances chart analysis by highlighting specific time intervals and marking the highest and lowest prices within those periods. It supports three customizable modes:
Date Range: Highlight a user-defined period with background shading and plot the highest and lowest prices.
Days of the Week: Highlight specific weekdays with background colors and plot the highest and lowest prices for each day.
Intraday Interval: Highlight a specific intraday time range (e.g., 12:30 PM to 4:30 PM) with background shading and plot the highest and lowest prices within that interval.
Alerts are triggered when the price touches any of the highlighted high or low levels, providing real-time notifications for potential trading opportunities.
High and low lines extend to the right and remain visible after the interval ends. This ensures they act as actionable reference points for alerts between intervals, allowing users to monitor critical levels until a new interval of the same category forms.
Features:
Customizable Time Intervals: Define specific date ranges, weekdays, or intraday intervals to highlight on the chart.
High/Low Tracking: Automatically plots the highest and lowest prices within the defined intervals.
Real-Time Alerts: Set up alerts to notify when the price touches any of the highlighted high or low levels.
Actionable Lines: High/low lines remain visible after interval completion to serve as reference points for alerts.
Visual Enhancements: Customize background colors and line styles for each interval type.
Usage:
Apply the indicator to your chart.
Configure the desired modes (Date Range, Days of the Week, Intraday Interval) in the settings.
Customize the appearance settings to match your preferences.
Set up alerts based on the highlighted high/low levels.
Disclaimer:
This indicator is designed to assist in identifying potential areas of interest based on historical high and low levels within specified intervals. It is not intended as a standalone trading signal. Users should employ additional technical analysis tools and conduct thorough research before making trading decisions.

Wyckoff Smart Money Pro [MTF]Wyckoff Smart Money Pro detects trading ranges, phases, and events from the Wyckoff method and confirms them with VSA (Volume Spread Analysis), divergence checks, and a composite “smart money” strength index. It generates optional buy/sell signals only when multiple conditions align (phase, VSA, CO strength, effort vs. result, time/volume filters). The dashboard, POC/Value Area, and MTF backdrop help you manage context and risk in real time.
What this indicator does
Wyckoff Smart Money Pro is a multi-timeframe Wyckoff tool that:
⦁ Finds accumulation/distribution ranges and tracks Phases A–E.
⦁ Labels Wyckoff events (PS, SC, AR, ST, Spring/Test, SOS, LPS, UTAD, SOW, LPSY, TS…) and VSA patterns (No Demand/Supply, Stopping Volume, Upthrust, etc.).
⦁ Computes a Composite Operator (CO) Strength score from price/volume behavior to approximate “smart money” bias.
⦁ Adds divergence, effort vs. result, and a volume profile (POC & 70% value area) inside the detected range.
⦁ Provides buy/sell signals only when a configurable confluence is present (events + VSA + CO + EVR + phase + filters).
⦁ Supports MTF context (with a safe HTF resolver and fallbacks) and an Info Dashboard to summarize the current state.
It is designed to make the Wyckoff workflow visual and rules-based without promising results or automating decisions.
How it works (methods & calculations)
1) Range & Phase model
⦁ A sliding lookback searches for a valid range (recent highest high/lowest low), requiring width within 2–10× ATR(14) and a minimum bar count inside the bounds.
⦁ Once a range is active, the script derives Creek/Ice/Mid/Quartiles and classifies bars into Wyckoff Phases A–E using event recency (barssince) and where price sits relative to the range.
⦁ The background color reflects the current Phase; optional MTF events (from the chosen HTF) tint the background lightly for higher-timeframe context.
2) Wyckoff & VSA event engine
⦁ Events include PS, SC, AR, ST, Spring, Test, SOS, LPS, PSY, BC, UTAD, SOW, LPSY, TS, plus minor/multiple variants and Creek/Ice jumps.
⦁ VSA patterns detect No Demand/No Supply, Stopping Volume, Buying/Selling Climax, Upthrust/Pseudo Upthrust, Bag Holding, Shake-Out, Volume Dry-Up, etc., from spread vs. average spread and volume vs. average volume with tunable thresholds.
3) Smart-money (CO) Strength
⦁ CO Strength (0–100) blends: relative volume on up/down bars, professional accumulation/distribution, no-supply/no-demand, stopping volume, Springs/UTADs and Tests, SOS/SOW, price’s position inside the range, and volume-delta vs. its MA.
⦁ Persistent accumCount / distCount counters smooth temporary noise.
4) Divergence & Effort-vs-Result
⦁ Price vs. cum volume-delta divergence highlights weakening pushes.
⦁ EVR flags “High effort / no result” and potential Bullish/Bearish reversals, or “Low effort / high result” moves that are often unsustainable.
5) Volume Profile (inside range)
⦁ A 50-bin profile accumulates volume across the detected range to derive POC, VAH/VAL (70% value area). Lines update as the active range evolves.
6) Multi-Timeframe (MTF) safety
⦁ getHTF() converts your multiplier to a valid Pine timeframe string (e.g., 60, 240, 2D, 1W), and the script falls back to current timeframe values if an HTF request returns na.
⦁ If you enter a Custom HTF, it must be strictly higher than the chart’s timeframe (validated at runtime).
7) Signals & risk model
⦁ Signals are not tied to any single pattern. A buy may require Spring/Test/Shake-out/Creek Jump or SOS plus confirmation (VSA, CO>60, Phase C/D, divergence/EVR context).
⦁ Sell is symmetrical (UTAD/Failed Spring/SOW/Ice Jump + VSA + CO<40 + Phase C/D).
⦁ Minimum confidence is configurable; SL/TP and R:R lines are drawn from range edges or recent bar extremes.
⦁ Filters: trading hours, weekend avoidance, and a minimum volume threshold (relative to average) are available to suppress low-quality contexts.
⦁ Alerts include all major events, divergences, structure/phase changes, and the gated Buy/Sell signals (with a cooldown to reduce alert spam).
Inputs (key ones you’ll actually use)
⦁ Display Settings: toggle ranges, phases, events, VSA, signals, dashboard.
⦁ MTF: Enable HTF, set Multiplier or a Custom HTF (must be higher than current).
⦁ Range Detection: period / min bars / pivot strength.
⦁ VSA: volume sensitivity & climax multiplier.
⦁ Signal Settings: minimum confidence, risk/reward labels.
⦁ Advanced Filters: trading hours, weekend avoidance, and Min Volume Filter (× avg).
⦁ Colors: phase backgrounds, structure colors, and line styling.
How to use (practical flow)
1. Choose a symbol & timeframe you normally analyze (e.g., 5–60m for entries, 4H/D for context).
2. If using MTF, pick a multiplier (e.g., 5×) or a Custom HTF (e.g., 240/4H).
3. Wait for a range to form; watch Phase and CO Strength on the Dashboard.
4. When events (e.g., Spring/Test in Phase C or UTAD in distribution) appear with favorable VSA, CO, EVR, and volume/time filters, consider the signal and review R:R lines.
5. Use POC/VA and Creek/Ice/Mid as structure references; manage risk around the range edge that generated the setup.
On-chart legend (what the letters mean)
Wyckoff events (labels)
⦁ PS Preliminary Support, SC Selling Climax, AR Automatic Rally, ST Secondary Test
⦁ Spring Spring; Test Test of Spring
⦁ SOS Sign of Strength; LPS Last Point of Support
⦁ PSY Preliminary Supply, BC Buying Climax
⦁ UTAD Upthrust After Distribution; SOW Sign of Weakness; LPSY Last Point of Supply
⦁ TS Terminal Shakeout; MS Multiple Spring
⦁ CJ Creek Jump; IJ Ice Jump
⦁ mSOS / mSOW Minor Sign of Strength/Weakness
VSA patterns (tiny labels)
⦁ ND No Demand, NS No Supply, SV Stopping Volume, BC/SC Buying/Selling Climax
⦁ PA/PD Professional Accumulation/Distribution, BH Bag Holding, DU Volume Dry-Up
⦁ SO Shake-Out, TS Test for Supply (VSA test), UT Upthrust, PUT Pseudo Upthrust
Other visuals
⦁ Range box with Creek (upper third), Ice (lower third), Mid, Quartiles
⦁ POC/VAH/VAL: yellow solid (POC), purple dotted (value area)
⦁ VWAP and Dynamic S/R (stepline)
⦁ Green/Red triangles: gated Buy/Sell signals (only if min confidence & filters are met)
⦁ Risk label near the triangle: confidence /10 and R:R
Alerts included
⦁ Core events (Spring/Test/UTAD/SOS/SOW/TS), secondary events (SC/AR/BC/LPS/LPSY), VSA patterns, EVR states, Hidden Accumulation/Distribution, HTF events, Divergences, Phase/Structure changes, and the constrained Buy/Sell signals with a cooldown.
Notes, limits & best practices
⦁ This is not a buy/sell system; it’s a context & confirmation tool. Combine with your plan, risk limits, and execution criteria.
⦁ Long, illiquid, or news-driven bars can distort volume/spread logic; filters help but cannot eliminate this.
⦁ For MTF, if an exchange doesn’t support a specific HTF, the script falls back safely to current TF values to avoid na-propagation.
⦁ Dashboard rows/size/position are user-configurable to keep charts uncluttered.
Changelog (what’s new in this version)
⦁ MTF safety & validation (Custom HTF must be above current; graceful fallbacks for request.security() na results).
⦁ Performance caching for close position & up/down bar flags; drawing cleanup to stay under label/line limits.
⦁ Volume Profile upgraded to 50 bins; VA algorithm adjusted accordingly.
⦁ Signal gating with time/day/volume filters and alert cooldown to reduce noise.
⦁ Bug guards for parameter conflicts (e.g., rangeMinBars cannot exceed rangePeriod).
Disclaimer
This script is for educational and research purposes only and does not constitute financial advice or a recommendation to buy or sell any asset. Market risk is real; always test on a demo and trade at your own discretion.

Ranges by TraderHaroThis indicator highlights a custom price range for a selected date/time period on your chart. It draws key levels (0.00, 0.25, 0.50, 0.75, 1.00) within the range, visually marking the Premium Zone (upper range) and Discount Zone (lower range).
Features:
- Define a specific date/time range for the analysis.
- Optional fill between top and bottom levels with customizable color and transparency.
- Shows mid-levels (0.25, 0.50, 0.75) for additional guidance.
- Lines and fill can be extended to the right side of the chart.
- Labels for levels can be displayed or hidden.
Use Case:
Quickly identify where price is trading relative to a defined range, visualize potential zones of premium (resistance) and discount (support), and make better-informed trading decisions.

Advanced Range Analyzer ProAdvanced Range Analyzer Pro – Adaptive Range Detection & Breakout Forecasting
Overview
Advanced Range Analyzer Pro is a comprehensive trading tool designed to help traders identify consolidations, evaluate their strength, and forecast potential breakout direction. By combining volatility-adjusted thresholds, volume distribution analysis, and historical breakout behavior, the indicator builds an adaptive framework for navigating sideways price action. Instead of treating ranges as noise, this system transforms them into opportunities for mean reversion or breakout trading.
How It Works
The indicator continuously scans price action to identify active range environments. Ranges are defined by volatility compression, repeated boundary interactions, and clustering of volume near equilibrium. Once detected, the indicator assigns a strength score (0–100), which quantifies how well-defined and compressed the consolidation is.
Breakout probabilities are then calculated by factoring in:
Relative time spent near the upper vs. lower range boundaries
Historical breakout tendencies for similar structures
Volume distribution inside the range
Momentum alignment using auxiliary filters (RSI/MACD)
This creates a live probability forecast that updates as price evolves. The tool also supports range memory, allowing traders to analyze the last completed range after a breakout has occurred. A dynamic strength meter is displayed directly above each consolidation range, providing real-time insight into range compression and breakout potential.
Signals and Breakouts
Advanced Range Analyzer Pro includes a structured set of visual tools to highlight actionable conditions:
Range Zones – Gradient-filled boxes highlight active consolidations.
Strength Meter – A live score displayed in the dashboard quantifies compression.
Breakout Labels – Probability percentages show bias toward bullish or bearish continuation.
Breakout Highlights – When a breakout occurs, the range is marked with directional confirmation.
Dashboard Table – Displays current status, strength, live/last range mode, and probabilities.
These elements update in real time, ensuring that traders always see the current state of consolidation and breakout risk.
Interpretation
Range Strength : High scores (70–100) indicate strong consolidations likely to resolve explosively, while low scores suggest weak or choppy ranges prone to false signals.
Breakout Probability : Directional bias greater than 60% suggests meaningful breakout pressure. Equal probabilities indicate balanced compression, favoring mean-reversion strategies.
Market Context : Ranges aligned with higher timeframe trends often resolve in the dominant direction, while counter-trend ranges may lead to reversals or liquidity sweeps.
Volatility Insight : Tight ranges with low ATR imply imminent expansion; wide ranges signal extended consolidation or distribution phases.
Strategy Integration
Advanced Range Analyzer Pro can be applied across multiple trading styles:
Breakout Trading : Enter on probability shifts above 60% with confirmation of volume or momentum.
Mean Reversion : Trade inside ranges with high strength scores by fading boundaries and targeting equilibrium.
Trend Continuation : Focus on ranges that form mid-trend, anticipating continuation after consolidation.
Liquidity Sweeps : Use failed breakouts at boundaries to capture reversals.
Multi-Timeframe : Apply on higher timeframes to frame market context, then execute on lower timeframes.
Advanced Techniques
Combine with volume profiles to identify areas of institutional positioning within ranges.
Track sequences of strong consolidations for trend development or exhaustion signals.
Use breakout probability shifts in conjunction with order flow or momentum indicators to refine entries.
Monitor expanding/contracting range widths to anticipate volatility cycles.
Custom parameters allow fine-tuning sensitivity for different assets (crypto, forex, equities) and trading styles (scalping, intraday, swing).
Inputs and Customization
Range Detection Sensitivity : Controls how strictly ranges are defined.
Strength Score Settings : Adjust weighting of compression, volume, and breakout memory.
Probability Forecasting : Enable/disable directional bias and thresholds.
Gradient & Fill Options : Customize range visualization colors and opacity.
Dashboard Display : Toggle live vs last range, info table size, and position.
Breakout Highlighting : Choose border/zone emphasis on breakout events.
Why Use Advanced Range Analyzer Pro
This indicator provides a data-driven approach to trading consolidation phases, one of the most common yet underutilized market states. By quantifying range strength, mapping probability forecasts, and visually presenting risk zones, it transforms uncertainty into clarity.
Whether you’re trading breakouts, fading ranges, or mapping higher timeframe context, Advanced Range Analyzer Pro delivers a structured, adaptive framework that integrates seamlessly into multiple strategies.

ORB FVG Strategy with telegram V6.1Summary
Intraday NY-session strategy with Opening-Range bias (09:30–10:00 NY), FVG entries (incl. optional HTF FVGs), momentum filters (LinReg slope & Williams %R), limit entries inside the zone, SL from FVG anchors, and TP via risk-reward. Includes session/trade caps, pending-order handling, auto-cancel at NY time, and optional Telegram webhook alerts.
Feature Overview
Opening Range & Bias: OR high/low built until 10:00 NY, then frozen. Bias from confirmed 5-minute candles (modes: Body Close, Complete Candle, Wick Only).
FVG Scanner: Bull/bear FVGs (choose wick or body gaps), min size, auto-extend, mitigation cleanup (touch or 50%).
HTF FVG (10 min): Optional – displayed after ≥ 2 consecutive FVGs; cleans up on touch/50%.
Entry/SL/TP: Entry at X% fill (+extra %) within the FVG; SL from FVG candle / FVG-1 / FVG-2 (smart) + buffer; TP via risk-reward.
Momentum Filters: LinReg slope (MLL) + Williams %R with threshold/slope filters (individually switchable).
Intrabar Mode (optional): Immediate Open/intrabar entry on touch (calc_on_every_tick=true) or classic bar-close confirmation (toggle).
Trade Management: Max trades/day, pending cap, auto-cancel at defined NY time, pause after first winner (optional).
Telegram: Programmatic alerts via alert() with Telegram-ready JSON payload.
Parameters (compact)
Group Parameter Purpose
Sessions Trading session, Opening range Trading/OR window (internal NY TZ)
Bias Body Close / Complete Candle / Wick Only Bias confirmation relative to OR
Liquidity LQ session, lookback days, cleanup points, show lines Intraday liquidity marks & cleanup
FVG Min size, wick/body, colors, extend, cleanup Detection/visualization & validity
HTF FVG (10 m) Toggle/Display/Colors Conservative HTF filter/POI
Entry Fill %, extra %, max pending, validity (bars), cancel time, intrabar switch Execution timing, order caps, auto-cancel
Stop Loss Source: Candle / -1 / -2 (smart), buffer (points) SL anchor from FVG history + safety offset
Take Profit Risk-Reward (R:R) Target calculation
Momentum LinReg length/min slope, W%R length/min slope, HUD Trend/momentum filters
Trade Mgmt Max trades/day, pause after win Daily cap / risk cooldown
Telegram Enabled, tester, interval, channel id Webhook output & test signals
Debug & Info Debug panel, rejection reasons On-chart status/diagnostics
Alerts / Telegram Webhook (Quick Setup)
Create an alert with Condition: “Any alert() function call”.
Webhook URL: api.telegram.org
Message: leave empty (the strategy provides JSON via alert() – includes chat_id, parse_mode, text).
Ensure your bot can post to the channel and the chat_id is valid.
Repainting & Backtesting
HTF series via lookahead_off on closed higher-TF candles; FVG detection on confirmed bars (barstate.isconfirmed).
Intrabar/Open entries allow earlier fills but typically cause differences between backtest and live (tick granularity/slippage, limit touch on bar OHLC).
For reproducibility, trade without intrabar (bar-close only).
Limitations
No full tick simulation; limit fills rely on bar OHLC.
Liquidity “cleanup” is rule-based (not an orderbook).
Telegram depends on correct webhook configuration.
Tips
Timeframes: M5 (intrabar)
Start with modest R:R (e.g., 1.5–2.0) and tune filters carefully.
Disclaimer
No financial advice. Past results do not guarantee future performance. Use responsibly and follow Public Library rules.
License / Credits
© 2025 Lean Trading (Lennart Pomreinke). License: MPL-2.0.
Changelog
V06.1: Intrabar switch (Open/intrabar vs bar-close), Telegram sanitizer & tester, HTF-FVG cleanup, refined pending/cancel logic, debug panel (status & rejections).

Script_Algo - ORB Strategy with Filters🔍 Core Concept: This strategy combines three powerful technical analysis tools: Range Breakout, the SuperTrend indicator, and a volume filter. Additionally, it features precise customization of the number of candles used to construct the breakout range, enabling optimized performance for specific assets.
🎯 How It Works:
The strategy defines a trading range at the beginning of the trading session based on a selected number of candles.
It waits for a breakout above the upper or below the lower boundary of this range, requiring a candle close.
It filters signals using the SuperTrend indicator for trend confirmation.
It utilizes trading volume to filter out false breakouts.
⚡ Strategy Features
📈 Entry Points:
Long: Candle close above the upper range boundary + SuperTrend confirmation
Short: Candle close below the lower range boundary + SuperTrend confirmation
🛡️ Risk Management:
Stop-Loss: Set at the opposite range boundary.
Take-Profit: Calculated based on a risk/reward ratio (3:1 by default).
Position Size: 10 contracts (configurable).
⚠️ IMPORTANT SETTINGS
🕐 Time Parameters:
Set the correct time and time zone!
❕ATTENTION: The strategy works ONLY with correct time settings! Set the time corresponding to your location and trading session.
📊 This strategy is optimized for trading TESLA stock!
Parameters are tailored to TESLA's volatility, and trading volumes are adequate for signal filtering. Trading time corresponds to the American session.
📈 If you look at the backtesting results, you can see that the strategy could potentially have generated about 70 percent profit on Tesla stock over six months on 5m timeframe. However, this does not guarantee that results will be repeated in the future; remain vigilant.
⚠️ For other assets, the following is required:
Testing and parameter optimization
Adjustment of time intervals and the number of candles forming the range
Calibration of stop-loss and take-profit levels
⚠️ Limitations and Drawbacks
🔗 Automation Constraints:
❌ Cannot be directly connected via Webhook to CFD brokers!
Additional IT solutions are required for automation, thus only manual trading based on signals is possible.
📉 Risk Management:
Do not risk more than 2-3% of your account per trade.
Test on historical data before live use.
Start with a demo account.
💪 Strategy Advantages
✅ Combined approach – multiple signal filters
✅ Clear entry and exit rules
✅ Visual signals on the chart
✅ Volume-based false breakout filtering
✅ Automatic position management
🎯 Usage Recommendations
Always test the strategy on historical data.
Start with small trading volumes.
Ensure time settings are correct.
Adapt parameters to current market volatility.
Use only for stocks – futures and Forex require adaptation.
📚 Suitable Timeframes - M1-M15
Only highly liquid stocks
🍀 I wish all subscribers good luck in trading and steady profits!
📈 May your charts move in the right direction!
⚠️ Remember: Trading involves risk. Do not invest money you cannot afford to lose!

Multi-Session Opening RangesThe Multi-Session Opening Ranges indicator plots the Opening Range (OR) levels for three major trading sessions: Asia, London, and New York. It displays the high (ORH), low (ORL), and midline of each session's opening range, helping traders identify key price levels for potential breakouts, reversals, or support/resistance zones.
This indicator is highly customizable, allowing users to tailor the appearance and behavior of each session independently.
Features
Multi-Session Support: Visualizes Opening Ranges for Asia, London, and New York sessions, with customizable session times and timezones.
Customizable Lines: Adjust the color, style (solid, dashed, dotted), and width of ORH, ORL, and midline for each session.
Offset Control: Set a custom offset (in bars) for lines and labels to position them away from price action for better visibility.
Fill Customization: Choose the fill color for the area between ORH and ORL for each session.
Historical Data Option: Toggle the display of historical OR levels to focus on current session data or analyze past ranges.
Timezone Flexibility: Select from a wide range of timezones to align session times with your trading needs.
Label Customization: Adjust the size of labels (tiny, small, normal, large, huge) for clarity on any chart.
How It Works
The indicator identifies the high and low prices during the user-defined opening range period for each session (default: 5 minutes). It then draws:
ORH (Opening Range High): The highest price during the session's opening range.
ORL (Opening Range Low): The lowest price during the session's opening range.
Midline: The average of ORH and ORL, plotted as a dashed line by default.
Filled Area: A semi-transparent fill between ORH and ORL to highlight the range.
Lines and labels extend until the start of the next session or can be offset by a user-specified number of bars for better chart readability. The indicator supports historical data display for analyzing past session ranges.
Inputs
Display:
Show Historical Data: Enable/disable historical OR levels.
Timezone: Select the timezone for session calculations (e.g., UTC-4, UTC+1, etc.).
Asia/London/New York Sessions:
Show Session: Enable/disable the session.
Session Time: Define the start and end time for the opening range (e.g., "0930-0935:1234567" for 9:30–9:35 AM, all days).
Asia/London/New York Style:
ORH/ORL/Midline Color: Set the color for each line.
ORH/ORL/Midline Style: Choose solid, dashed, or dotted styles.
ORH/ORL/Midline Width: Adjust line thickness (1–5).
OR Fill Color: Customize the fill color for the OR area.
Lines/Labels Offset: Set the offset (in bars, -50 to 50) to shift lines and labels relative to price action.
General Style:
Label Size: Set the size of ORH and ORL labels (tiny, small, normal, large, huge).
Usage
Add the indicator to your chart.
Configure session times to match your trading instrument and timezone.
Customize colors, line styles, widths, and offsets for each session to suit your chart preferences.
Use the ORH, ORL, and midline levels to identify key price zones for trading strategies, such as breakouts or reversals.
Notes
Ensure session times do not overlap to avoid conflicts in visualization.
Large offsets may place lines/labels outside the visible chart area; adjust as needed.
The indicator is optimized for intraday timeframes but works on any timeframe.

Session Volatility MonitorOverview
Session Volatility Monitor is a versatile volatility indicator tailored for intraday and session-based trading. It computes the average maximum price deviation (either up or down) from the session's opening price over a user-specified number of prior days, providing insights into expected "room to move" in the current session. This helps traders gauge potential exhaustion points, set realistic targets or stops, and identify when a directional move has reached historical norms (flagged as "REACHED" with the exact price level).
Displayed via a customisable table and optional horizontal target lines, it's ideal for markets like forex, crypto, futures, or stocks where session volatility matters. The indicator supports custom sessions with timezone adjustments, making it adaptable to global trading hours (e.g., London, NY, or Asia kill zones). For assets with small tick sizes (e.g., forex pairs at 0.0001), a multiplier scales values for readability (e.g., showing pips as 67.0 instead of 0.00670).
Key Features
Session-Based Calculations:
Defines sessions via presets (e.g., "NY Kill Zone: 07:00-10:00") or custom HHMM-HHMM inputs. (please note that preset sessions are mainly for futures e.g. "Full Day18:01-17:00", but also can be useful for forex and crypto)
Adjustable UTC offset (e.g., -5 for ET) to align with your asset's timezone—ensures accurate detection regardless of TradingView's UTC internal clock.
Tracks the max one-sided move (high - open or open - low) per session, averaging over 1–N previous days (default: 14).
Table Display:
Avg Max Move: Historical average deviation, labeled with days averaged and session time.
Current Move: Real-time displacement from session open (positive for up, negative for down).
Room to Go Up/Down: Remaining distance to reach the average, updating live; appends "REACHED (price)" if hit during the session.
Customisable: Text color, font size (tiny to huge), position (e.g., bottom_left), and value scaling via multiplier/decimal places.
Target Lines:
Optional horizontal lines at "Up Target" (open + avg move) and "Down Target" (open - avg move).
Lines start at the session open bar and extend only through the session duration (e.g., stops at 12:00 for a 07:00-12:00 session)—no further projection post-session.
Fully customisable: Toggle on/off, color, style (solid/dotted/dashed), width, label text/background.
Display Adjustments for Forex/Crypto:
Multiplier: Scales raw values (e.g., set to 10000 for EURUSD to show pips like 45.0 instead of 0.0045).
Decimals: Controls precision (0–5 places) for table values.
How to Use
Add to Chart: Search for "Session Volatility Monitor" in TradingView's indicators and apply to your symbol (e.g., EURUSD for forex, NQ1! for futures, BTCUSD for crypto).
Configure Settings:
Select a session preset or custom range; adjust UTC offset if needed (e.g., +0 for UTC symbols like crypto).
Set "Number of Previous Days to Average" (e.g., 14 for a two-week look back).
For small-tick assets, set Multiplier (e.g., 100 for crypto points, 10000 for forex pips) and Decimals (e.g., 0 for whole numbers).
Customise table position/size/color and target lines for visibility.
Interpret Outputs:
Monitor the table for "room to go"—if Room Up is low/negative, upside might be limited; "REACHED" signals a potential reversal or exhaustion.
Use target lines as visual S/R levels; they auto-start at session open and halt at close.
Combine with price action, volume, or other indicators for entries (e.g., buy near down target if bullish bias).
Example Scenario:
Forex (GBPUSD, 1-min): Set session to "London Kill Zone: 02:00-05:00" (UTC+0), multiplier=10000. Table shows pips; lines mark expected highs/lows.
Limitations and Tips
Historical Data Limits: Averages are capped by TradingView's bar history (e.g., ~14 days on 1-min for free plans). Upgrade for deeper look backs or use higher timeframes.
Session Accuracy: Ensure UTC offset matches your chart—test with the "In Session" plot (enable in Style tab, zoom y-axis if columns are tiny).
No Alerts/Signals: Purely informational; add custom alerts via TradingView for "REACHED" conditions.
Performance: On very low timeframes with long sessions, lines might consume line limits (max ~50)—toggle off if needed.
Tips: For crypto/forex, experiment with multiplier to match your preferred units (e.g., points vs. decimals). Hide debug plot in Style tab for clean charts. If "REACHED" doesn't trigger, verify on historical data where moves exceed averages.
This tool draws from concepts like Average Daily Range but focuses on directional, session-specific volatility for precise intraday decision-making. Feedback welcome!
Disclaimer
This indicator is for educational purposes only and does not constitute financial advice. Always consult a professional before trading.

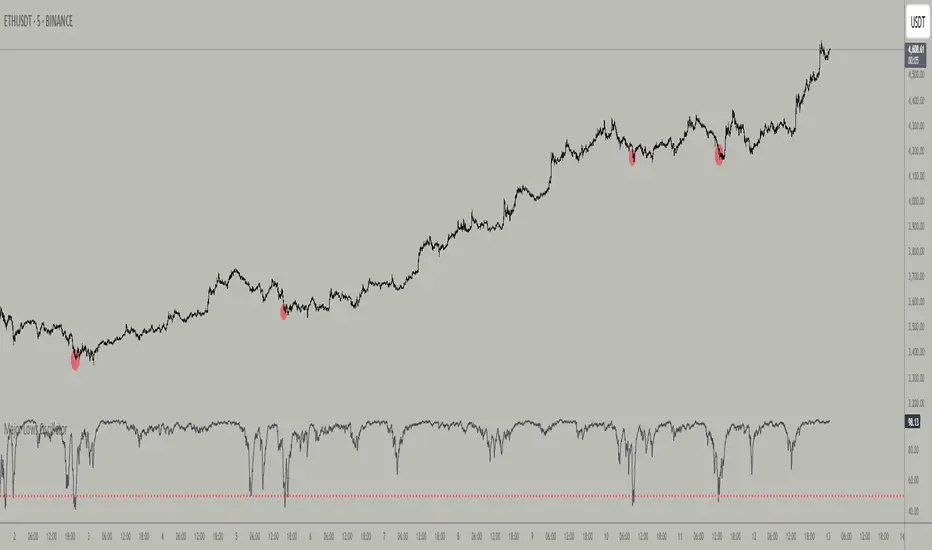
Major Lows OscillatorDescription
The Major Lows Oscillator is a custom technical indicator designed to identify significant low-price areas by normalizing the current closing price relative to recent lowest lows and highest highs. The oscillator calculates a normalized price percentage over a configurable lookback period, applies exponential moving averages for smoothing, and inverts the result to highlight potential market bottoms.
Calculation Details
Lowest Low Lookback : Finds the lowest low over a user-defined period (default 100 bars).
Highest High Lookback : Calculates the highest high over a short period (default 1 bar), providing a dynamic normalization range.
Normalization : Normalizes the current close within the range defined by the lowest low and highest high, scaled to 0-100.
Smoothing : Applies a 10-period EMA, inversion, and weighted smoothing combining the last valid value and current oscillator reading.
Final Output : Applies a final EMA (period 1) and inverts the oscillator (100 - value) to emphasize major lows.
Features
Customizable midline level for signal alerts (default 50).
Visual midline reference line.
Alerts trigger on oscillator crossing below midline for automated monitoring.
Usage
Useful for complementing existing setups or integration in algorithmic trading strategies.
Changing the input parameters opens new ways to leverage the asymmetric range concept, allowing adaptation to different market regimes and enhancing the oscillator’s sensitivity and utility.
Examples of input combinations and their potential purposes include:
Extremely Asymmetric Setting: Lowest Low Lookback = 200, Highest High Lookback = 1
Focuses on deep long-term lows contrasted with immediate highs, ideal for spotting strong oversold levels within an otherwise bullish short-term momentum.
Symmetric Lookbacks: Lowest Low Lookback = Highest High Lookback = 50
Balances the range equally, creating a normalized oscillator that treats recent lows and highs with the same weight — useful for markets with balanced volatility.
Short but Equal Lookbacks: Lowest Low Lookback = Highest High Lookback = 10
Highly sensitive to recent price swings, this setting can detect rapid shifts and is suited for intraday or very short-term trading.
Inverted Extreme: Lowest Low Lookback = 1, Highest High Lookback = 100
Highlights very recent lows against a long-term high range, possibly signaling quick dips in a generally overextended market.
Inputs
Midline Level : Threshold for alerts (default 50).
Lowest Low Lookback Period : Bars evaluated for lowest low (default 100).
Highest High Lookback Period : Bars evaluated for highest high (default 1).
Alerts
Configured to trigger once per bar close when the oscillator crosses below the midline level.
---
Disclaimer
This indicator is for educational and analytical use only.
Recent Range DetectorOverview
The Recent Range Detector is a specialized indicator designed to identify when an asset is currently range-bound, providing traders with clear support and resistance levels for range trading strategies. Unlike traditional indicators that focus on trend detection, this tool specifically answers the question: "Is the price range-bound right now, and what are the exact trading levels?"
Key Features
✅ Smart Range Detection - Uses a multi-factor scoring system to identify legitimate ranges
✅ Dynamic Support/Resistance Levels - Automatically calculates and displays key trading levels
✅ Range Quality Scoring - Provides confidence levels (Strong/Moderate/Weak Range)
✅ Touch Validation - Counts actual price touches to confirm range reliability
✅ Breakout Detection - Alerts when price exits the established range
✅ Visual Clarity - Clean boxes, lines, and labels for easy interpretation
How It Works
The indicator analyses recent price action using three core metrics:
Touch Quality (40%) - How many times price has respected support/resistance levels
Containment Quality (40%) - What percentage of recent bars stayed within the range
Recent Respect (20%) - Whether the latest price action confirms the range
These combine into a Range Score (0-1) that determines range strength and reliability.
Settings & Parameters
Range Lookback Period (Default: 15)
Number of bars to analyse for range detection
Shorter periods = more responsive to recent ranges
Longer periods = more stable, fewer false signals
Range Tolerance (Default: 2.0%)
Tolerance for price touches around exact highs/lows
Lower values = stricter range requirements
Higher values = more flexible range detection
Minimum Touches (Default: 3)
Required number of support/resistance touches for valid range
Higher values = more confirmed ranges, fewer signals
Lower values = more sensitive, earlier detection
Visual Options
Show Range Box: Displays the range boundaries
Show Support/Resistance Lines: Extends levels into the future
Understanding the Output
Range Score (0.000 - 1.000)
0.7+ = Strong Range (Green) - High confidence range trading setup
0.5-0.7 = Moderate Range (Yellow) - Decent range with some caution
0.3-0.5 = Weak Range (Orange) - Low confidence, be careful
<0.3 = Not Ranging - Avoid range trading strategies
Range Status Classifications
Strong Range - Perfect for range trading strategies
Moderate Range - Good range with normal risk
Weak Range - Marginal range, use smaller positions
Not Ranging - Price is trending or too choppy for range trading
Key Metrics in Info Table
Range Size (%) - Size of the range relative to price level
5-15% = Ideal range size for most strategies
<5% = Tight range, lower profit potential
>15% = Wide range, higher profit potential but more risk
Support/Resistance Levels - Exact price levels for entries/exits
Use these as your key trading levels
Support = potential buy zone
Resistance = potential sell zone
Total Touches - Number of times price respected the levels
3-5 touches = Newly formed range
6-10 touches = Well-established range
10+ touches = Very strong, reliable range
Price Position (%) - Current location within the range
0-20% = Near support (potential long opportunity)
80-100% = Near resistance (potential short opportunity)
40-60% = Middle of range (wait for better entry)
Visual Elements
Range Box
Green Box = Strong Range (Score ≥ 0.7)
Yellow Box = Moderate Range (Score 0.5-0.7)
Orange Box = Weak Range (Score 0.3-0.5)
Support/Resistance Lines
- Horizontal lines showing exact trading levels
- Extend into the future for forward guidance
- Colour matches the range strength
Background Colouring
- Subtle background tint during range periods
- Helps quickly identify ranging vs trending markets
Breakout Signals
- 📈 RANGE BREAK UP - Price breaks above resistance
- 📉 RANGE BREAK DOWN - Price breaks below support
- Only appears for confirmed ranges (Score ≥ 0.5)
Trading Applications
Range Trading Strategy
1. Look for Range Score ≥ 0.5
2. Buy near support (Price Position 0-20%)
3. Sell near resistance (Price Position 80-100%)
4. Set stops just outside the range
5. Exit on breakout signals
Breakout Strategy
1. Identify strong ranges (Score ≥ 0.7)
2. Wait for volume-confirmed breakout
3. Enter in breakout direction
4. Use previous resistance as support (or vice versa)
Market Context
- Strong ranges often occur after trending moves
- Use higher timeframes to confirm overall market structure
- Combine with volume analysis for better entries/exits
Best Practices
What to Look For
✅ Range Score ≥ 0.5 for trading consideration
✅ Multiple touches (5+) for confirmation
✅ Clear price rejection at levels
✅ Reasonable range size (5-15% for most assets)
✅ Recent price respect of boundaries
What to Avoid
❌ Trading ranges with Score < 0.3
❌ Very tight ranges (<3% size) - low profit potential
❌ Ranges with only 1-2 touches - not confirmed
❌ Ignoring breakout signals
❌ Trading against the higher timeframe trend
Alerts Available
- Range Detected - New range formation
- Range Break Up - Upward breakout
- Range Break Down - Downward breakout
- Range Ended - Range condition ended
Timeframe Recommendations
- Daily Charts - Best for swing trading ranges
- 4H Charts - Good for intermediate-term ranges
- 1H Charts - Suitable for day trading ranges
- Lower Timeframes - May produce more noise
Conclusion
The Recent Range Detector eliminates guesswork in range identification by providing objective, quantified range analysis. It's particularly valuable for traders who prefer range-bound strategies or need to identify when trending strategies should be avoided.
Remember: No indicator is perfect. Always combine with proper risk management, volume analysis, and broader market context for best results.
Disclaimer
This indicator is for educational purposes only and should not be considered as financial advice. Trading involves risk, and past performance does not guarantee future results. Always conduct your own research and consider your risk tolerance before making any trading decisions.

CP Strat ORBnew york opening range breakout and retest allows you to enter a trade with a better clarity if the price comes back and retest the range

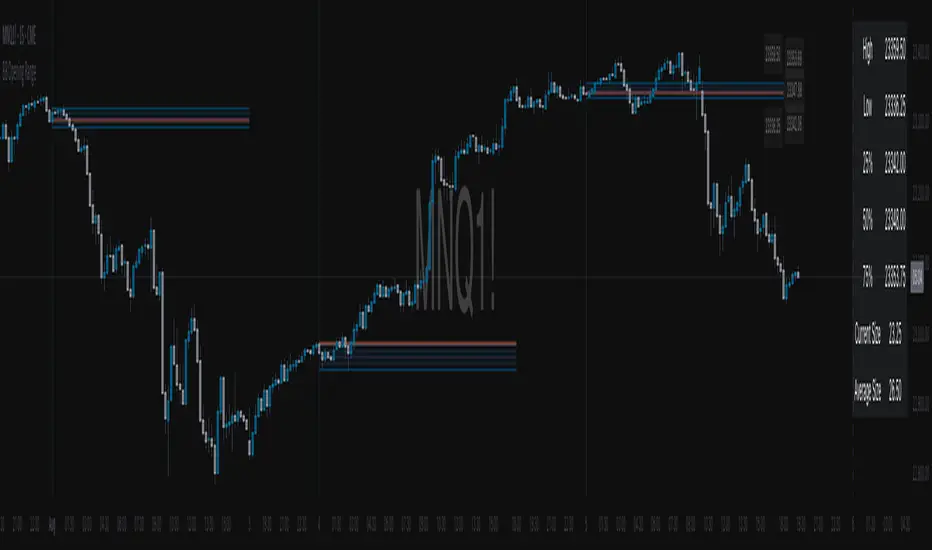
BB Opening Range
Master session-based trading with precision range analysis and dynamic extensions
📊 Overview
The BB Opening Range Indicator is a comprehensive session analysis tool that captures, visualizes, and extends price ranges for any defined trading session. Whether you're tracking overnight ranges, opening ranges, or custom session periods, this indicator provides institutional-grade visualization with intelligent range extensions and detailed quadrant analysis.
🎯 Key Features
Dynamic Session Tracking
Define custom session times (default: Midnight 00:00-00:30)
Automatic timezone adjustment for precise session detection
Handles sessions that cross midnight seamlessly
Visual session start/end markers with customizable lines
Intelligent Range Extension
Futures Close (17:00) - Extends ranges until 5:00 PM ET
End of Week - Maintains ranges through Friday close
Always - Continuous extension for persistent levels
Session End Only - Basic range without extension
Advanced Quadrant Analysis
Automatically divides ranges into four equal zones (0-25%, 25-50%, 50-75%, 75-100%)
Color-coded quadrants for instant visual reference
Optional quadrant border lines at 25%, 50%, and 75% levels
Customizable colors and opacity for each quadrant
Historical Range Analytics
Tracks multiple historical ranges (configurable 1-50)
Calculates average range size over customizable lookback period (up to 200 days)
Compares current range to historical average
Maintains clean chart with automatic old range cleanup
Professional Visualization
Clean, institutional-style range boxes with customizable borders
Opening price line overlay
Optional info table showing key levels and statistics
Smart label positioning that follows price action
Predictive next session indicator
📈 Use Cases
Opening Range Breakout Trading
Track the first 30-60 minutes of regular trading hours to identify key support/resistance levels for the day.
Overnight Range Analysis
Monitor overnight/globex sessions to gauge pre-market sentiment and identify potential gaps.
Custom Session Ranges
Define any time period relevant to your strategy - London open, New York open, Asian session, or custom intervals.
Multi-Timeframe Analysis
View how price respects historical session ranges across different timeframes for confluence.
⚙️ Settings Guide
Session Settings
Session Name: Label your session for easy identification
Session Time: Define start and end times (24-hour format)
Extend Until: Choose how long ranges remain visible
Lookback Days: Period for calculating average range size
Max Ranges: Number of historical ranges to display
Display Options
Show Quadrants: Toggle quadrant visualization
Show Info Table: Display statistics table
Table Position: Choose table location on chart
Session Lines: Show/hide session start and next session markers
Open Price Line: Display opening price within range
Label Settings
High/Low Labels: Show range extremes
Quadrant Labels: Display 25%, 50%, 75% levels
Open Price Label: Mark session opening price
Current Range Only: Limit labels to most recent range
Visual Styling
Border Settings: Customize box and quadrant borders
Line Widths: Adjust border and quadrant line thickness
Color Scheme: Full control over all visual elements
Combined Predictive Indicator### Combined Predictive Zones & Levels
This indicator is a powerful hybrid tool designed to provide a comprehensive map of potential future price action. It merges two distinct predictive models into a single, cohesive view, helping traders identify key levels of support, resistance, and areas of high confluence.
#### How It Works: Two Models in One
This script is built on two core components that you can use together or analyze separately:
**Part 1: Classic Range & Fibonacci Prediction**
This model uses classic technical analysis principles to project a potential range for the upcoming price action.
* **Highest High / Lowest Low:** It identifies the significant trading range over a user-defined lookback period.
* **Fibonacci Levels:** It automatically plots key Fibonacci retracement levels (e.g., 38.2% and 61.8%) within this range, which often act as critical support or resistance.
* **ATR & Average Range:** It calculates a "predicted" upper and lower boundary based on the average historical range and current volatility (ATR).
**Part 2: Advanced Predictive Ranges (Self-Adjusting Channels)**
This is a dynamic model that creates adaptive support and resistance zones based on a smoothed average price and volatility.
* **Dynamic Average:** It uses a unique moving average that only adjusts when the price moves significantly, creating a stable baseline.
* **ATR-Based Zones:** It projects multiple levels of support (S1, S2) and resistance (R1, R2) around this average, which widen and narrow based on market volatility. These zones often signal areas where price might stall or reverse.
#### Key Features:
* **Hybrid Model for Confluence:** The true power of this indicator lies in finding where the levels from both models overlap. A Fibonacci level aligning with a Predictive Range support zone is a much stronger signal.
* **Comprehensive Data Table:** A clean, on-chart table displays the precise values of all key predictive levels, allowing for quick reference and precise trade planning.
* **Multi-Timeframe (MTF) Capability:** The Advanced Predictive Ranges can be calculated on a higher timeframe, giving you a broader market context.
* **Fully Customizable:** All lengths, multipliers, and levels for both models are fully adjustable in the settings to fit any asset or trading style.
* **Clear Visuals:** All zones and levels are color-coded for intuitive and easy-to-read analysis.
#### How to Use:
1. Look for areas of **confluence** where multiple levels from both models cluster together. These are high-probability zones for price reactions.
2. Use the Predictive Range zones (S1/S2 and R1/R2) as potential targets for trades or as areas to watch for entries and exits.
3. Pay attention to the on-chart table for exact price levels to set limit orders or stop-losses.
**Disclaimer:** This script is an analytical tool for educational purposes and should not be considered financial advice. All trading involves risk. Past performance is not indicative of future results. Always use this indicator as part of a comprehensive trading strategy with proper risk management.
Feedback is welcome! If you find this tool useful, please leave a like.

Multi Ranges Volume Distribution [LuxAlgo]The Multi Ranges Volume Distribution tool allows traders to see the volume distribution by price for three different timeframes simultaneously. Each distribution can report the total amount of accumulated volume or the accumulated buy/sell volume separately.
Levels are displayed at the top and bottom of each timeframe's range, as well as the POC or level with the most volume.
🔶 USAGE
By default, the tool displays daily, weekly, and monthly volume distributions, highlighting the accumulated volume within each row.
Each distribution shows the volume at each price, as well as three lines: the top and bottom prices, and the price at which the most volume was traded.
The reported accumulated volume can be useful for highlighting which price areas are of the most interest to traders, with the specific timeframe specifying whether this interest is long-term or short-term.
🔹 Timeframes & Rows
Traders can adjust the timeframe and the number of rows for each volume distribution.
This is useful for multi-timeframe analysis of volume at the same price levels, or for obtaining detailed data within the same timeframe.
The chart above shows three volume distributions with the same monthly timeframe but a different number of rows; each is more detailed than the previous one.
🔹 Total vs Buy & Sell Volume
Traders can choose to display either the total volume or the buy and sell volumes.
As we can see on the above chart, the background of each row uses a gradient that is a function of the delta between the buy and sell volumes.
This is useful to determine which areas attract buyers and sellers.
🔶 SETTINGS
Volume Display: Select between total volume and buy and sell volume.
Distance between each box: Adjust the spacing of the volume distributions.
Period A: Select a timeframe and the number of rows.
Period B: Select a timeframe and the number of rows.
Period C: Select a timeframe and the number of rows.
