RegimeWorks USDJPY 4H Trend Regime Session Aware FREERegimeWorks — USDJPY 4H Trend Regime (Session-Aware)
This indicator identifies when USDJPY is in a valid 4H trend-continuation regime, and whether current trading sessions support participation.
What this indicator does:
Defines higher-timeframe regime validity
Applies session awareness (Tokyo, London, New York)
Shows directional bias only when continuation conditions are present
What this indicator does NOT do:
No buy/sell signals
No automation
No performance claims
Extended NO-TRADE periods are intentional.
Designed for disciplined traders who value patience over frequency.
Regime

Trade Decision MatrixTrade Decision Matrix (TDM)
Trade Decision Matrix (TDM) is a professional-grade, multi-phase market intelligence indicator designed to assist traders in understanding market structure, regime behavior, capital confidence, and execution readiness using a systematic, probabilistic framework.
This indicator does not generate trade signals. Instead, it provides a structured decision matrix similar to institutional trading desks, combining regime analytics, entropy confidence, Bayesian reliability, capital allocation logic, and scenario interpretation.
🔹 Core Architecture
TDM is built using a nine-phase institutional decision pipeline:
Phase 1 — Market Context
Spot–future basis, volatility normalization, and structural slope detection.
Phase 2 — Regime Engine
Probabilistic classification of Trend, Breakout, Range, or Mean Reversion environments.
Phase 3 — Orthogonal Model Cores
Independent statistical, trend, breakout, and mean-reversion cores.
Phase 4 — Bayesian Reliability Engine
Adaptive reliability scoring for each core using Bayesian reinforcement.
Phase 5 — Capital Engine
Capital confidence and capital mode based on opportunity quality, regime clarity, entropy confidence, and risk filters.
Phase 6 — Decision Matrix
Bias, participation level, and trade quality grading.
Phase 7 — Scenario Engine
Contextual scenario interpretation such as Trend Expansion, Breakout Failure, Range Compression, etc.
Phase 8 — Execution Gate
Execution readiness filter based on capital and model alignment.
Phase 9 — Reversal Engine
Probabilistic reversal risk estimation using multi-factor logic.
🔹 Regime Entropy Confidence
TDM uses Shannon entropy to measure regime uncertainty and converts it into a confidence score.
Lower entropy = higher regime confidence.
Higher entropy = unstable or transitional market state.
This prevents over-confidence in noisy conditions.
🔹 Institutional Commentary Engine
A professional commentary layer interprets all internal engines and outputs institutional-style guidance such as:
• Institutional Alignment
• Capital Protection Mode
• Regime Uncertainty
• Momentum Continuation
• Structural Breakout
• Volatility Coiling
• Reversal Risk Elevated
This commentary is designed for situational awareness, not signal generation.
🔹 Dashboard
The dark-theme dashboard provides a compact institutional decision panel:
• Regime
• Entropy Confidence
• Scenario
• Bias
• Strength
• Capital Confidence
• Capital Mode
• Trade Quality
• Execution State
• Commentary
• Reversal Risk
All values are color-coded with heat shading for instant visual interpretation.
🔹 How To Use
TDM is best used as a decision support layer alongside your own trading strategy.
Typical workflow:
Identify regime and entropy confidence.
Observe capital confidence and capital mode.
Check scenario and bias alignment.
Confirm execution readiness.
Monitor reversal risk before entering or holding positions.
This tool is ideal for:
• Intraday traders
• Swing traders
• Options traders
• Index traders
• Systematic discretionary traders
🔹 Important Notes
• This indicator does NOT produce buy/sell signals.
• It is a decision intelligence framework.
• It should not be used as a standalone trading system.
• Always apply personal risk management.
🔹 Disclaimer
This indicator is provided for educational and informational purposes only.It does not constitute financial advice or investment recommendations.Trading involves risk. Users are responsible for their own trading decisions.

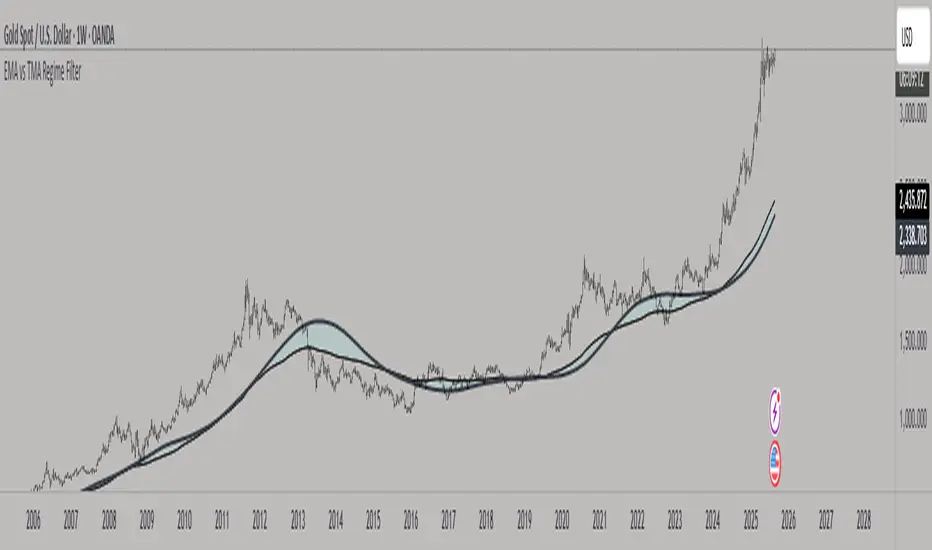
W.E.A.L.T.H. Stochastic Ichimoku (v6.1)Overview
The W.E.A.L.T.H. Stochastic Ichimoku (v6.1) is a sophisticated signal-processing indicator that integrates Ichimoku Equilibrium Logic with Stochastic RSI Volatility to isolate high-probability momentum regimes.
By applying Donchian-based midpoint calculations to a smoothed Stochastic %K curve, the indicator filters out the oscillating "noise" typically found in standard momentum tools, providing a clearer view of trend velocity and exhaustion levels.
Core Technical Components
The system is built upon three primary data streams, each serving a distinct role in regime identification:
Velocity Conversion Line (VCL | Blue | 3px): Calculated as the midpoint of the Stochastic %K over a 9-period lookback. This line tracks the immediate rate of change in momentum, functioning as a high-sensitivity trigger for short-term trend shifts.
Equilibrium Base Line (EBL | Red | 3px): Calculated as the midpoint of the Stochastic %K over a 26-period lookback. This serves as the "Balance Point" or mean-reversion target for the momentum curve, identifying the structural stability of the current trend.
Temporal Momentum Audit (TMA | Yellow | 3px): The current momentum value displaced 26 periods into the past. This component allows for a Temporal Conflict Check, comparing current momentum against historical volatility to identify structural resistance within the oscillator range.
Signal Interpretation & Methodology
Momentum Regime Filter: The background utilizes a dynamic regime-shading logic with 20% opacity. A green background signifies a Bullish Expansion Regime ( NSE:VCL > EBL$), while a red background signifies a Bearish Contraction Regime ( NSE:VCL < EBL$).
Neutral Zone: The region between the 20 and 80 levels represents the Momentum Equilibrium Zone. Readings outside this range indicate potential Kinetic Exhaustion (above 80) or Potential Energy Accumulation (below 20).
The TK Momentum Twist: Crossovers between the VCL and EBL are plotted with directional triangles. These "Twists" represent a shift in the internal force of the asset before the price action often completes its structural move.
Operational Constraints & Best Practices
Structural Confirmation: A bullish momentum signal is considered valid only when the TMA (Yellow) is in Open Space (unobstructed by past VCL/EBL values). Interaction with past data indicates Historical Friction, increasing the probability of a false breakout.
Fuel Depletion Logic: Readings pinned above 80 signify Momentum Saturation. Entering new long positions in this zone carries a high risk of mean-reversion toward the Equilibrium Base Line (Red).
Settings Optimization:
* Stochastic Settings: 14 (K-Length), 3 (Smoothing).
Ichimoku Settings: 9 (Fast Midpoint), 26 (Standard Midpoint). Displacement: 26 periods (Lagging Span).
Disclaimer: This indicator is a mathematical model for momentum regime filtering. It does not constitute financial advice. Success depends on the integration of this tool within a broader risk-management framework and the alignment with price-action structure.
Release Notes: W.E.A.L.T.H. Stochastic Ichimoku v6.1
Release Date: January 9, 2026
Build Version: 6.1.0 (Sovereign Patch)
Compatibility: Pine Script v6 (TradingView)
Summary of Updates
This version focuses on Visual Signal Clarity and Visual Hierarchy Enhancement. We have standardized line weightings to prioritize high-velocity data and recalibrated background transparency to reduce visual noise during high-volatility events.
UI & Visual Infrastructure
Standardized Line Thickness (#3):
VCL (Velocity Conversion Line): Increased to 3px to emphasize short-term momentum triggers.
EBL (Equilibrium Base Line): Increased to 3px to define a clearer "Balance Point" for mean-reversion analysis.
TMA (Temporal Momentum Audit): Increased to 3px to facilitate immediate identification of historical momentum collisions.
Momentum Regime Recalibration:
Background opacity has been fixed at 20% (Transparency 80). This allows for clear "Momentum Atmosphere" identification without obstructing the primary candle data or secondary oscillators.
Color Palette Optimization:
Bullish Regime: Recalibrated to Hex #2e7d32 (Emerald Green).
Bearish Regime: Recalibrated to Hex #c62828 (Crimson Red).
Operational Logic
Temporal Displacement Logic: Standardized the displacement to exactly 26 periods to align with the EBL equilibrium midpoint, ensuring the Temporal Momentum Audit (TMA) reflects precise historical volatility benchmarks.
TK Twist Signal Sensitivity: Triangle plotshapes have been recalibrated for "size.tiny" to prevent signal overlapping during tightly consolidated momentum ranges.
Technical Refinements
Fixed a bug in version 6.0 where the TMA (Chikou) would occasionally flicker at the hard-right edge of the chart due to inconsistent series length processing.
Corrected the bgcolor logic to ensure absolute color switching exactly at the crossover point of the 9 and 26 midpoints.
Implementation Guide
Script Refresh: If you are currently using v6.0, please overwrite your Pine Editor with the new v6.1 code provided.
Layout Scaling: Because line thicknesses have been increased to 3px, we recommend adjusting your indicator pane height to at least 25% of the total screen space for optimal data visualization.
Signal Confirmation: Utilize the Yellow TMA to confirm "Open Space" before executing on any TK Twist (Triangle) signal.

Rachev Regime AnalyzerRachev Regime Analyzer ~ GForge
What It Does
Measures the ratio of extreme gains to extreme losses to identify whether markets favor bulls or bears. When your best moves are bigger than your worst moves, conditions are bullish. When the opposite is true, conditions are bearish.
Simple Interpretation:
Ratio > 1.2 → Bullish regime (tail gains exceed tail losses)
Ratio < 0.8 → Bearish regime (tail losses exceed tail gains)
Between → Neutral/transitional
Key Features
Two Modes:
Single Asset: Analyze current chart
Multi-Asset: Aggregate regime across 5 assets with custom weights (great for gauging overall crypto/market conditions)
Customizable:
Lookback period (20-200 bars)
Tail percentile (what counts as "extreme")
Bullish/bearish thresholds
6 color schemes
Optional MA smoothing
Visual Signals:
Buy/sell markers at threshold crosses
Background regime coloring
Info table with current values and confidence score
Configurable alerts
How to Use
Choose lookback period based on your timeframe (40-60 bars is a good start)
Watch for threshold crosses - these mark regime changes
Check confidence score - higher = more reliable
Use multi-asset mode to see if entire market is shifting (not just one coin)
Best combined with: Trend indicators, support/resistance, volume analysis
Parameters
Lookback: More bars = smoother, less responsive
Alpha (0.10): Defines extreme events - lower = more extreme
Thresholds: Adjust based on asset volatility
Return Type: Log returns recommended for most assets
What Makes It Useful
Unlike simple volatility measures, this shows asymmetry - whether extreme moves favor upside or downside. A ratio of 1.5 means your extreme gains are 50% larger than extreme losses - that's actionable information about risk-reward dynamics.
Multi-asset aggregation is particularly powerful for crypto traders wanting to gauge if BTC, ETH, SOL, etc. are all showing similar regime characteristics.
Disclaimer
Educational tool only. Not financial advice. Use proper risk management. No indicator works in isolation - always consider broader market context.
Developed by GForge
Comments and feedback welcome! 👍

Flux Momentum Oscillator[BullByte]Flux Momentum Oscillator is a professional-grade momentum analysis system built on an original methodology called Momentum Flux Bars (MFB). Unlike conventional oscillators that measure momentum over fixed time periods, this indicator constructs synthetic momentum bars based on actual price movement, creating a pure representation of directional pressure independent of time-based noise.
This is NOT a mashup or combination of existing indicators. The entire system is built from the ground up around a single cohesive concept: measuring momentum through price-triggered synthetic bars rather than time-triggered calculations.
CORE INNOVATION: MOMENTUM FLUX BARS (MFB)
Traditional momentum indicators calculate values at fixed time intervals, which means a slow, grinding move receives the same measurement weight as a fast, explosive move occurring over the same number of bars. This creates distortion in momentum readings.
Momentum Flux Bars solve this problem by forming only when price travels a volatility-adjusted distance. Each MFB represents genuine directional commitment from market participants.
Key Properties of Momentum Flux Bars:
- Form based on price movement, not time passage
- Automatically adjust their formation threshold based on current volatility
- Capture the velocity of price movement (how quickly each bar forms)
- Record volume participation during formation
- Create a noise-filtered view of true market momentum
The oscillator then analyzes the pattern, velocity, and characteristics of recent MFB formations to produce its readings.
WHY THIS APPROACH MATTERS FOR TRADERS
Time-Based Problem: A 14-period RSI on a choppy day produces the same calculation structure as on a trending day, even though market behavior differs completely. The indicator cannot distinguish between meaningful moves and noise.
Flux-Based Solution: When price chops sideways, fewer MFBs form because price fails to travel the required distance. When price trends strongly, MFBs form rapidly in sequence. The oscillator inherently adapts to actual market behavior.
Practical Benefits:
- Cleaner signals during trending conditions
- Automatic noise reduction during consolidation
- Earlier detection of momentum shifts through velocity analysis
- Reduced false signals in choppy markets
- No manual adjustment needed across different market conditions
COMPLETE FEATURE BREAKDOWN
FEATURE 1: AUTO-OPTIMIZATION ENGINE
The indicator includes an optional auto-optimization system that continuously evaluates different sensitivity parameters and selects the configuration producing the cleanest momentum measurement for current conditions.
How It Works:
- Tests multiple ATR multiplier values against recent price history
- Scores each configuration based on trend capture efficiency
- Automatically applies the optimal setting
- Re-evaluates periodically to adapt to changing conditions
Trader Benefit: Eliminates the guesswork of parameter tuning. The indicator finds its own optimal settings.
FEATURE 2: MARKET REGIME CLASSIFICATION
The system classifies current market conditions into four distinct regimes based on MFB formation patterns:
EXPLOSIVE: Rapid MFB formation with strong directional bias and high volume participation. Indicates powerful trending conditions with high momentum.
STEADY: Consistent MFB formation in a primary direction with normal velocity. Represents healthy, sustainable trends suitable for trend-following approaches.
CONSOLIDATING: Mixed direction MFB formation with decreasing velocity. Suggests range-bound conditions where breakout strategies may be appropriate.
DEAD: Minimal MFB formation activity. Indicates extremely low volatility or market indecision. Often precedes significant moves.
Trader Benefit: Instantly understand current market character and adjust strategy accordingly.
FEATURE 3: VELOCITY DIVERGENCE DETECTION
This advanced feature monitors the formation speed of Momentum Flux Bars and compares it against price direction.
Velocity Divergence Bearish: Price making higher highs but MFBs forming progressively slower. Suggests buying pressure is weakening despite higher prices.
Velocity Divergence Bullish: Price making lower lows but MFBs forming progressively slower. Suggests selling pressure is weakening despite lower prices.
Trader Benefit: Early warning system for potential reversals before they appear on price charts.
FEATURE 4: MOMENTUM EXHAUSTION DETECTION
The system identifies when a trending move may be running out of energy by analyzing the duration pattern of consecutive same-direction MFBs.
Exhaustion Pattern: When each successive MFB in a trend takes progressively longer to form, it indicates diminishing momentum even though direction remains unchanged.
States Displayed:
- BUILDING: Momentum is increasing or stable
- PEAK: Maximum momentum velocity reached
- EXHAUSTING: Progressive slowdown detected
Trader Benefit: Know when a trend is losing steam before price reverses.
FEATURE 5: HIGHER TIMEFRAME ALIGNMENT
The indicator checks whether higher timeframe MFB direction supports or conflicts with current timeframe momentum.
ALIGNED BULL: Both timeframes showing bullish MFB direction
ALIGNED BEAR: Both timeframes showing bearish MFB direction
DIVERGENT: Timeframes showing opposing directions
NEUTRAL: Higher timeframe direction unclear
Trader Benefit: Trade with higher timeframe support for higher probability setups.
FEATURE 6: CHOPPY MARKET DETECTION
A dedicated algorithm analyzes recent MFB patterns to determine if the market is in a choppy, directionless state.
Detection Factors:
- Frequency of direction changes in recent MFBs
- Lack of consecutive same-direction formations
- Weak directional bias in the MFB sequence
Trader Benefit: Avoid trend-following strategies when market conditions do not support them.
FEATURE 7: TREND STRENGTH MEASUREMENT
A percentage-based strength reading derived from MFB pattern analysis.
Flux Momentum Oscillator Chart Example
Chart Overview: Bitcoin 15-Minute Chart (Dec 21, 2025)
BTCUSD Market Snapshot
Price: $88,854.53 | Oscillator: 77.38 | Direction: BULLISH | Regime: EXPLOSIVE
1. EXPLOSIVE REGIME DETECTION (Current State - Right Side)
2. MOMENTUM EXHAUSTION ZONE (Mid-Chart)
3. CHOP/CONSOLIDATION PERIOD (Before Breakout)
4. VELOCITY DIVERGENCE (Around 21:00 the previous day)
5. BULLISH MOMENTUM SHIFT (Around 09:00)
6. FORMATION PROGRESS BAR (Bottom of Oscillator)
7. TREND STRENGTH INDICATOR (Bottom Bar)
8. EXTREME ZONES (Top and Bottom Boundaries)
Reading Interpretation:
- Above 70%: Strong trending conditions
- 40% to 70%: Moderate trend or developing move
- Below 40%: Weak trend or choppy conditions
Visual representation provided via the strength bar at the bottom of the indicator panel.
HOW TO READ THE OSCILLATOR PLOT
OSCILLATOR LINE (Main Line):
- Ranges from -100 to +100
- Above zero indicates bullish momentum
- Below zero indicates bearish momentum
- Color intensity reflects momentum direction and strength
- Glow effect (optional) enhances visibility of the main reading
SIGNAL LINE (Secondary Line):
- Smoothed version of the oscillator
- Crossovers indicate momentum shifts
- Purple/accent colored for visual distinction
HISTOGRAM BARS:
- Represent the difference between oscillator and signal line
- Increasing histogram in direction of oscillator confirms momentum
- Decreasing histogram warns of potential momentum shift
- Bright colors indicate increasing momentum
- Faded colors indicate decreasing momentum
ZONE INTERPRETATION:
+75 to +100 (Extreme Bullish Zone):
Very strong bullish momentum. Price has moved significantly and rapidly. Watch for exhaustion patterns. Not ideal for new long entries. Consider profit-taking on existing longs.
+50 to +75 (Strong Bullish Zone):
Healthy bullish momentum. Good conditions for trend-following long strategies. Pullbacks to signal line often provide continuation opportunities.
0 to +50 (Mild Bullish Zone):
Positive but moderate momentum. Trend may be developing or maturing. Watch for strength building or fading.
0 to -50 (Mild Bearish Zone):
Negative but moderate momentum. Downtrend may be developing or maturing. Watch for weakness building or recovering.
-50 to -75 (Strong Bearish Zone):
Healthy bearish momentum. Good conditions for trend-following short strategies. Rallies to signal line often provide continuation opportunities.
-75 to -100 (Extreme Bearish Zone):
Very strong bearish momentum. Price has moved significantly and rapidly to downside. Watch for exhaustion patterns. Not ideal for new short entries. Consider profit-taking on existing shorts.
HOW TO READ THE DASHBOARD
The dashboard provides comprehensive market analysis at a glance. Each row displays specific information:
OSCILLATOR ROW:
Shows current oscillator value with directional icon.
indicates reading above +50 (High)
indicates reading below -50 (Low)
DIRECTION ROW:
Current MFB direction.
BULLISH: Recent MFB formed upward
BEARISH: Recent MFB formed downward
NEUTRAL: No recent MFB or unclear
REGIME ROW:
Current market regime classification.
EXPLOSIVE / STEADY / CONSOLIDATING / DEAD
Color coded for quick recognition.
MARKET ROW:
Trend state assessment.
TRENDING UP: Confirmed uptrend in progress
TRENDING DN: Confirmed downtrend in progress
CHOPPY: No clear trend, high direction changes
MIXED: Partial trend characteristics
STRENGTH ROW:
Visual bar showing trend strength percentage.
More filled bars indicate stronger trend.
Color shifts from red (weak) to yellow (moderate) to green (strong).
VELOCITY ROW:
MFB formation speed status.
ACCELERATING: MFBs forming faster over time
STEADY: Consistent formation speed
DECELERATING: MFBs forming slower over time
MOMENTUM ROW:
Momentum development status.
BUILDING: Momentum increasing
PEAK: Maximum momentum reached
EXHAUSTING: Momentum declining despite same direction
HTF ALIGN ROW:
Higher timeframe alignment status.
BULL: HTF supports bullish bias
BEAR: HTF supports bearish bias
DIVERGENT: HTF opposes current direction
NEUTRAL: HTF unclear
FORMING ROW:
Progress toward next MFB formation.
Visual bar fills as price approaches formation threshold.
Helps anticipate when next MFB will complete.
Additional rows (when not in Compact Mode):
- Flux Size: Current MFB formation threshold value
- ATR Mult: Current optimized ATR multiplier (when auto-optimization enabled)
- Regime %: Numerical regime score
FORMATION PROGRESS INDICATOR
The horizontal line near the bottom of the indicator panel shows progress toward the next MFB formation.
Reading the Progress Line:
- Starts at baseline after each MFB completion
- Rises as price moves toward formation threshold
- Higher position indicates imminent MFB formation
- Color changes from neutral to accent to warning as formation approaches
Practical Use:
- Anticipate when new momentum data will become available
- Gauge intra-bar momentum development
- Understand why signals occur when they do
TREND STRENGTH BAR
The horizontal bar at the very bottom of the indicator displays trend strength visually.
Components:
- Gray background bar represents full scale (0-100%)
- Colored fill represents current strength reading
- Label displays exact percentage value
Color Interpretation:
- Green fill: Strong trend (above 70%)
- Yellow fill: Moderate trend (40-70%)
- Red fill: Weak trend (below 40%)
RECOMMENDED USAGE GUIDELINES
TIMEFRAME RECOMMENDATIONS:
Scalping (1m to 5m):
- Use lower Flux Period (8-10) for faster response
- Focus on oscillator crossovers and histogram momentum
- Regime should be STEADY or EXPLOSIVE for best results
Day Trading (5m to 30m):
- Default settings work well
- Use HTF alignment with 1H or 4H for confirmation
- Avoid trading when regime shows DEAD
Swing Trading (1H to 4H):
- Consider higher Flux Period (18-21) for smoother signals
- Regime classification becomes very valuable
- Velocity divergence provides excellent early warnings
Position Trading (Daily and above):
- Higher Flux Period (21-30) recommended
- Focus on regime changes and exhaustion patterns
- HTF alignment less relevant, oscillator zones more important
ASSET CLASS NOTES:
Forex: Works well on major pairs. Consider slightly higher sensitivity on less volatile pairs.
Crypto: Higher volatility may require lower sensitivity multiplier. Regime detection particularly useful.
Stocks: Excellent for liquid stocks. Less effective on illiquid names due to gappy price action.
Indices: Very effective. Clean price action produces clean MFB patterns.
Commodities: Works well, especially on gold and oil. Adjust sensitivity for different volatility profiles.
SETTINGS OVERVIEW
MODE AND THEME:
- Trading Mode: Simple (clean), Pro (full data), Hybrid (balanced)
- Visual Theme: Dark, Light, Neon, Stealth
- Compact Dashboard: Reduces dashboard rows
FLUX ENGINE:
- Flux Calculation Method: Choose optimization approach
- Enable Auto-Optimization: Let indicator find optimal parameters
- Flux Period: Base volatility calculation period
- Sensitivity Multiplier: Adjust MFB formation threshold
- Optimization Lookback: Bars analyzed for optimization
- Optimization Frequency: How often to re-optimize
OSCILLATOR:
- Oscillator Smoothing: Main line smoothness
- Signal Line Length: Signal line responsiveness
- Momentum Depth: MFBs analyzed for oscillator
- Histogram Scale: Visual scaling of histogram
MARKET STATE:
- Chop Detection Window: MFBs analyzed for chop detection
- Chop Threshold: Sensitivity of chop classification
- Min Trend Confirmation: Consecutive bars for trend confirmation
ADVANCED ANALYSIS:
- Enable Regime Classification: Market regime detection
- Enable Velocity Divergence: Formation speed analysis
- Enable Exhaustion Detection: Trend exhaustion warnings
- Enable HTF Alignment: Higher timeframe checking
- Higher Timeframe: Which timeframe to check
VISUALS:
- Glow Effect: Visual enhancement on oscillator
- Show Zone Fills: Background zone coloring
- Show Formation Progress: Progress indicator display
- Show Trend Strength Bar: Bottom strength bar
- Show Dashboard: Information panel display
- Dashboard Position: Corner placement
SIGNAL INTERPRETATION GUIDELINES
BULLISH MOMENTUM SHIFT:
Oscillator crosses above signal line while not in extreme bearish territory.
Suggests emerging bullish momentum.
Stronger when occurring near zero line or in mild bearish zone.
BEARISH MOMENTUM SHIFT:
Oscillator crosses below signal line while not in extreme bullish territory.
Suggests emerging bearish momentum.
Stronger when occurring near zero line or in mild bullish zone.
STRONG TREND CONDITIONS:
Oscillator beyond +/-55, in direction of signal line, trend strength above 55%, not choppy.
Indicates conditions favorable for trend-following approaches.
EXTREME ZONES:
Oscillator beyond +/-75.
Diamond markers appear.
Exercise caution with new positions in trend direction.
Watch for exhaustion and divergence signals.
ALERT SYSTEM
The indicator includes comprehensive alerts for automated monitoring:
Momentum Alerts:
- Bullish Momentum Shift
- Bearish Momentum Shift
- Strong Uptrend Initiated
- Strong Downtrend Initiated
Zone Alerts:
- Extreme Bullish Zone Reached
- Extreme Bearish Zone Reached
Market State Alerts:
- Choppy Conditions Detected
- Choppy Conditions Cleared
- Explosive Regime Entered
- Dead Regime Entered
Advanced Alerts:
- Velocity Divergence Detected
- Exhaustion Warning Triggered
- HTF Aligned Bullish
- HTF Aligned Bearish
- HTF Divergence Detected
MFB Alerts:
- Bullish MFB Formed
- Bearish MFB Formed
WHAT THIS INDICATOR IS NOT
This indicator is NOT:
- A buy/sell signal generator (it provides momentum context, not trade signals)
- A standalone trading system (combine with price action and other analysis)
- A guarantee of profitability (no indicator can guarantee results)
- A replacement for risk management (always use proper position sizing and stops)
- A mashup of existing indicators (this is original methodology)
ORIGINALITY STATEMENT
The Momentum Flux Bars concept was designed specifically to address limitations of time-based momentum calculations.
Every component of this system serves the central MFB methodology:
- The oscillator measures MFB directional weight
- The regime classifier interprets MFB patterns
- The velocity analysis tracks MFB formation speed
- The exhaustion detector monitors MFB duration progression
- The HTF alignment checks MFB direction across timeframes
This is a unified analytical framework, not a collection of separate indicators.
TECHNICAL NOTES
Non-Repainting Confirmation:
All signal generation uses confirmed bar data only. MFB formations occur on bar close. Historical signals will not change after they appear.
Performance Considerations:
Auto-optimization runs periodically, not every bar, to maintain performance.
MFB history is trimmed to prevent memory issues on extended sessions.
Reduce Max MFB History if experiencing performance issues.
Symbol and Timeframe Handling:
The indicator resets its MFB history when symbol or timeframe changes.
This ensures clean analysis without carryover from previous contexts.
DISCLAIMER
This indicator is provided for educational and informational purposes only. It is not financial advice and should not be considered as such.
Trading involves substantial risk of loss. Past performance of any trading methodology or indicator does not guarantee future results. The author makes no representations regarding the profitability or suitability of this indicator for any particular purpose.
Users are solely responsible for their own trading decisions. Always use proper risk management, including appropriate position sizing and stop-loss orders. Never risk more than you can afford to lose.
Before using this or any indicator in live trading, thoroughly test it on historical data and in a demo environment. Understand its behavior across different market conditions.
The author is not liable for any losses incurred through the use of this indicator.
Developed by BullByte
Version 1.0.0

MarketMind LITEM🜁rketMind LITE ────────────────────
Essential Market Awareness, Reduced to Its Core
M🜁rketMind LITE is a lightweight market awareness tool designed to display essential situational context .
It provides basic orientation and movement awareness without interpretation, risk framing, diagnostics, or decision guidance.
This script is designed as a standalone awareness layer. It does not evaluate trade quality, issue signals, or influence decision-making.
WHAT IT DOES ────────────────────
M🜁rketMind LITE presents a minimal, static view of current market conditions focused entirely on awareness rather than analysis.
The system displays only essential context, allowing traders to stay oriented without introducing judgment, noise, or implied direction.
The script provides visibility into:
Time-of-day session context
Basic market regime classification (trending, range-bound, mixed)
Short-term momentum direction only (up, down, neutral)
A clean, static HUD display
M🜁rketMind LITE also includes a minimal visual state indicator that reflects recent price responsiveness, intended to be observed over time alongside the trader’s own experience.
The goal is to support awareness without influence .
HOW TO USE IT ────────────────────
M🜁rketMind LITE is not a signal generator.
It is designed to remain visible in the background of any chart, offering quiet orientation while traders rely entirely on their own process for analysis and execution.
Common use cases include:
Maintaining session awareness
Preserving context during focused trading periods
Reducing cognitive load while monitoring markets
M🜁rketMind LITE does not evaluate risk, alignment, or opportunity.
It simply shows what is happening.
DESIGN PHILOSOPHY ────────────────────
M🜁rketMind LITE is intentionally minimal.
It includes only essential awareness elements and excludes all interpretive or evaluative logic:
Situational context only
Directional momentum (up / down / neutral)
No diagnostics, confidence, or conviction framing
No process, risk, or quality assessment
Presentation controls only (HUD on/off, size, position)
Nothing is inferred.
Nothing is suggested.
This script shows market state without interpretation.
WHO IT IS FOR ────────────────────
M🜁rketMind LITE is suited for traders who:
Want passive situational awareness
Prefer minimal on-chart information
Already operate with a defined decision process
It is not designed for:
Analytical or diagnostic use
Risk evaluation or context synthesis
Traders seeking guidance or confirmation
IMPORTANT NOTES ────────────────────
M🜁rketMind LITE does not provide financial advice
No system can predict future price behavior
This tool is designed for awareness only
Used appropriately, M🜁rketMind LITE helps traders stay oriented without interference.

MarketMind PRO+M🜁rketMind PRO+ ────────────────────
Advanced Market Interpretation & Conviction Context
M🜁rketMind PRO+ is an advanced market interpretation system designed for traders who require structured insight into alignment, stability, and contextual agreement — without alerts, signals, or hindsight-based indicators.
Rather than issuing instructions or trade direction, M🜁rketMind PRO+ focuses on interpreting how market conditions relate to one another , whether internal agreement is present, and whether the environment supports conviction or restraint.
This script is designed as a standalone interpretive analysis tool. It does not provide execution guidance or predictive guarantees.
WHAT IT DOES ────────────────────
M🜁rketMind PRO+ evaluates current market conditions across multiple analytical dimensions — including macro environment, sector behavior, momentum, structure, liquidity, stability, and session dynamics — and synthesizes them into a structured, human-readable HUD.
In addition to describing what is happening, the system interprets internal agreement and contextual coherence , helping traders understand whether conditions appear supportive, fragile, or transitional.
The script provides insight into:
Market bias and directional alignment
Regime and phase behavior across sessions
Momentum quality, degradation, and stall dynamics
Internal agreement and alignment consistency
Structural stability and transition risk
Contextual factors that may support or undermine conviction
The goal is to clarify how well conditions agree internally , not to tell traders what action to take.
HOW TO USE IT ────────────────────
M🜁rketMind PRO+ is not a signal generator.
It is designed to complement discretionary price action, rule-based systems, or systematic strategies by helping traders evaluate higher-order context, such as:
How aligned are current conditions, and how broad is that agreement?
Is momentum supported, fragile, or deteriorating?
Does the environment appear stable, transitional, or deceptive?
Does this context justify conviction, or suggest restraint?
M🜁rketMind PRO+ emphasizes synthesis over reaction, preserving chart clarity while providing interpretive depth.
DESIGN PHILOSOPHY ────────────────────
M🜁rketMind PRO+ is intentionally interpretive.
It focuses on contextual agreement and stability , rather than isolated signals or prescriptive outputs:
Multi-dimensional context and alignment interpretation
Internal agreement and coherence awareness
Stability and transition sensitivity
Session-aware interpretive framing
No alerts, entries, or execution logic
No forward performance claims or guarantees
Nothing is instructed.
Nothing is promised.
This script explains how conditions relate , not what to trade.
WHO IT IS FOR ────────────────────
M🜁rketMind PRO+ is suited for traders who:
Require interpretive context beyond surface-level awareness
Manage exposure across changing regimes
Value understanding alignment, stability, and agreement
Prefer synthesis over single-indicator workflows
It is not designed for:
Buy or sell alerts
Automated execution systems
Traders seeking prescriptive instructions
IMPORTANT NOTES ────────────────────
M🜁rketMind PRO+ does not provide financial advice
No system can predict future price behavior with certainty
This tool is designed to support judgment, not replace it
Used appropriately, M🜁rketMind PRO+ helps traders operate with greater selectivity, contextual clarity, and risk awareness

Market Pressure Regime [Interakktive]The Market Pressure Regime (MPR) is a 4-state market classifier that models how structural forces create "pressure zones" — regions where price movement is either supported (Release) or suppressed (Pinned) by market microstructure.
It combines compression analysis, follow-through efficiency, and stress detection into a composite pressure score, classifying markets into Release, Suppressed, Transition, or Trap states — helping traders understand WHY price is moving (or not moving) in the current environment.
█ USAGE
MPR addresses a core question traders face: Is the market in a regime where directional moves are likely to follow through, or is it structurally pinned?
For swing traders, MPR identifies Release phases where momentum strategies work best, and Suppressed phases where mean reversion dominates.
For day traders, it highlights Trap conditions — high effort with no follow-through — where reversals are probable and trend entries fail.
🔹 The 4-State Model
The indicator classifies markets into four distinct regimes:
• Release (Teal): Pressure score ≥ +5. Directional flow dominates. Price moves efficiently with follow-through. Favor trend continuation.
• Suppressed (Grey): Pressure score ≤ -5. Compression dominates. Price is range-bound or pinned. Fade extremes, expect reversion.
• Transition (Amber): Score between thresholds OR instability detected. Regime is uncertain — wait for confirmation before committing.
• Trap (Magenta): High stress + low follow-through. Effort without result. Expect reversals.
🔹 Reading the Pressure Histogram
The histogram displays the composite Pressure Score (range approximately -100 to +100):
• Positive values: Follow-through exceeds compression. Market is "releasing" — directional moves are supported.
• Negative values: Compression exceeds follow-through. Market is "suppressed" — price movement is constrained.
• Color reflects confirmed state: The histogram uses persistence filtering — a state must hold for N bars before the color changes, preventing false signals from noise.
🔹 The 5-Stage Calculation
MPR synthesizes five analytical stages into the final state:
1. Compression Score: Measures how tight the current range is relative to ATR. High compression suggests structural forces are pinning price.
2. Follow-Through Score: Measures price path efficiency (MER-style). Efficient moves indicate genuine directional flow, not chop.
3. Stress Score: Detects effort-without-result (ERD-style). High volume or range with no price progress = absorption.
4. Composite Pressure: Combines follow-through and compression into a single directional score.
5. Persistence Filter: Requires states to hold for configurable bars before confirming, eliminating flickering.
█ SETTINGS
Core Settings
• ATR Length: Period for volatility normalization. Default 14.
• Baseline Lookback: Period for compression and efficiency baselines. Default 20.
• Volume Average Length: Period for stress calculation baseline. Default 20.
State Classification
• Release Threshold: Pressure score above this = Release. Default +5.
• Suppressed Threshold: Pressure score below this = Suppressed. Default -5.
• Trap Threshold: Stress score above this (with low follow-through) = Trap. Default 30.
• Persistence Bars: Bars required to confirm state change. Default 3.
• Stability Lookback: Period for stability calculation. Default 20.
• Stability Threshold: Below this = forced Transition state. Default 0.5.
Visual Settings
• Show Pressure Histogram: Display the main pressure score histogram.
• Show Zero Line: Display the zero reference line.
• Show Background Tint: Subtle background color by state (default OFF).
Data Window
• Show Data Window Values: Export all calculated scores for analysis.
█ INTERPRETATION GUIDE
When to Use Trend Strategies (Release):
• Histogram tall and positive
• Teal coloring confirmed
• Price making efficient higher highs or lower lows
When to Use Mean Reversion (Suppressed):
• Histogram flat or negative
• Grey coloring confirmed
• Price oscillating without follow-through
When to Wait (Transition):
• Amber coloring
• Mixed signals — don't force trades
• Wait for state to resolve
When to Expect Reversals (Trap):
• Magenta coloring
• High volume moves that don't stick
• Often occurs at structural inflection points
█ COMPLEMENTARY TOOLS
MPR pairs well with:
• Volatility State Index (VSI) — Confirms whether volatility is expanding into the pressure regime
• Effort-Result Divergence (ERD) — Provides bar-by-bar absorption/vacuum detection
• Market Efficiency Ratio (MER) — Validates follow-through quality
█ SUITABLE MARKETS
Works across all liquid markets:
• Equities: SPY, QQQ, liquid single stocks
• Futures: ES, NQ, CL, GC
• Crypto: BTC, ETH
• Forex: Major pairs
Works on any timeframe, but 1H–Daily provides cleanest regime classification. Intraday (5m–15m) useful for session-level tactical decisions.
█ OPEN SOURCE
This indicator is open-source for educational purposes. Review the code to understand the full calculation methodology.
█ DISCLAIMER
This indicator is for educational and informational purposes only. It does not constitute financial advice. Past performance does not guarantee future results. Always conduct your own analysis and use proper risk management.

Volatility State Index [Interakktive]The Volatility State Index (VSI) classifies market volatility into three behavioral states: Expansion, Decay, and Transition. It answers one question visually: Is volatility supporting price movement, withdrawing, or unstable?
Unlike traditional volatility indicators that show levels or bands, VSI diagnoses the current volatility regime so traders can adapt their approach accordingly.
█ WHAT IT DOES
• Classifies volatility into three states: Expansion (teal), Decay (grey), Transition (amber)
• Measures volatility momentum as a percentage rate-of-change
• Applies stability filtering to detect unstable/choppy conditions
• Uses persistence logic to prevent state flickering
• Exports state data for use in alerts and strategies
█ WHAT IT DOES NOT DO
• NO buy/sell signals
• NO entry/exit recommendations
• NO alerts (v1 is diagnostic only)
• NO performance claims
This is a volatility diagnostic tool, not a trading system.
█ HOW IT WORKS
The VSI processes volatility through a five-stage pipeline:
STAGE 1 — Base Volatility
Calculates ATR as the foundation for volatility measurement.
STAGE 2 — Smoothing
Applies EMA smoothing to reduce noise in the volatility series.
STAGE 3 — Volatility Momentum
Computes the percentage rate-of-change of smoothed volatility:
Volatility Momentum (%) = ((Current ATR - Previous ATR) / Previous ATR) × 100
Positive values indicate expanding volatility; negative values indicate contracting volatility.
STAGE 4 — Stability Filter
Tracks how frequently volatility momentum changes direction. Frequent sign changes indicate unstable, choppy conditions.
Stability Score = 1 - (Average Flip Rate)
Low stability forces the Transition state regardless of momentum level.
STAGE 5 — State Classification
Combines momentum thresholds and stability to determine the final state:
• Expansion: Momentum ≥ +5% (default threshold)
• Decay: Momentum ≤ -5% (default threshold)
• Transition: Between thresholds OR low stability
A persistence filter requires states to hold for multiple bars before confirming, preventing visual noise.
█ INTERPRETATION
EXPANSION (Teal)
Volatility is increasing in a sustained way. Price moves are becoming larger.
What it suggests:
• Breakouts are more likely to follow through
• Stops may need wider placement
• Trend-following approaches tend to work better
• Mean-reversion weakens
DECAY (Grey)
Volatility is decreasing. Price is compressing into tighter ranges.
What it suggests:
• Breakouts are more likely to fail
• Ranges tend to hold
• Trend-following underperforms
• Mean-reversion strengthens
TRANSITION (Amber)
Volatility behavior is unclear or unstable. This is NOT neutral — it is uncertainty.
What it suggests:
• Mixed signals — one bar huge, next bar dead
• Higher whipsaw risk
• Reduced conviction in either direction
• Consider waiting for clarity
The key insight: Amber is a warning, not a middle ground. It appears when volatility cannot decide what it wants to do.
█ VISUAL DESIGN
The indicator uses a state-first histogram design:
• Histogram height shows volatility momentum percentage
• Histogram color shows the classified state
• Zero line provides visual anchor
• Optional momentum line for confirmation
• Optional background tint (default OFF for clean charts)
The visual hierarchy prioritizes instant state recognition. A trader should understand the volatility environment in under one second without reading numbers.
█ INPUTS
Core Settings
• ATR Length: Base volatility measurement period (default: 14)
• Smoothing Length: EMA smoothing applied to ATR (default: 10)
• Momentum Length: Rate-of-change lookback (default: 10)
State Classification
• Expansion Threshold (%): Momentum above this = Expansion (default: 5.0)
• Decay Threshold (%): Momentum below this = Decay (default: -5.0)
• Persistence Bars: Bars required to confirm state change (default: 3)
• Stability Lookback: Window for stability calculation (default: 20)
• Stability Threshold: Below this = forced Transition (default: 0.5)
Visual Settings
• Show State Histogram: Toggle main display (default: ON)
• Show Momentum Line: Thin confirmation line (default: OFF)
• Show Zero Line: Baseline reference (default: ON)
• Show Background Tint: Subtle state coloring (default: OFF)
█ DATA WINDOW EXPORTS
When enabled, the following values are exported:
• ATR (Raw)
• ATR (Smoothed)
• Volatility Momentum (%)
• Stability Score (0-1)
• State (-1/0/1): Decay = -1, Transition = 0, Expansion = 1
• Is Expansion (0/1)
• Is Decay (0/1)
• Is Transition (0/1)
These exports allow VSI to be used as a filter in Pine Script strategies or alert conditions.
█ ORIGINALITY
While ATR and volatility indicators are common, VSI is original because it:
1. Classifies volatility into behavioral states rather than showing raw levels
2. Applies momentum analysis to volatility itself (rate-of-change of ATR)
3. Uses stability filtering to detect genuinely unstable conditions
4. Implements persistence logic to prevent state flickering
5. Provides a state-first visual design optimized for instant recognition
VSI is state-first: it classifies volatility regimes (Expansion/Decay/Transition) rather than plotting volatility level alone, using momentum and stability to reduce false regime reads.
This is not a modified ATR or Bollinger Band — it is a volatility regime classifier.
█ SUITABLE MARKETS
Works on: Stocks, Futures, Forex, Crypto
Timeframes: All timeframes — state classification adapts accordingly
Best on: Instruments with consistent volatility patterns
█ RELATED
• Market Efficiency Ratio — measures price path efficiency
• Effort-Result Divergence — compares volume effort to price result
█ DISCLAIMER
This indicator is for educational purposes only. It does not constitute financial advice. Past performance does not guarantee future results. Always conduct your own analysis before making trading decisions.

MarketMind PROM🜁rketMind PRO ────────────────────
Descriptive Market Context & Risk Awareness
M🜁rketMind PRO is a professional-grade market context system designed to help traders maintain situational clarity and explicit risk awareness — without signals, confidence scoring, or forward-looking interpretation.
Rather than telling traders what to trade or how confident to be, M🜁rketMind PRO focuses on describing what is happening in the market and where caution may be warranted.
This script is designed as a standalone descriptive tool. It does not provide execution guidance, trade signals, or predictive insight.
WHAT IT DOES ────────────────────
M🜁rketMind PRO evaluates current market conditions across multiple dimensions — including session context, regime state, momentum direction, volatility, liquidity, and structural behavior — and presents them in a clean, human-readable HUD.
The system emphasizes description over interpretation.
It highlights conditions that may elevate or reduce risk without assessing alignment strength, assigning confidence, or projecting outcomes.
The script provides visibility into:
Market context and session awareness
Basic regime states and transitions
Momentum direction (up, down, neutral)
Volatility, liquidity, and structural caution conditions
Environmental factors that may influence risk
The goal is to make risk visible — without telling traders what to do with it.
HOW TO USE IT ────────────────────
M🜁rketMind PRO is not a signal generator.
It is designed to be used alongside discretionary price action, rule-based entries, or systematic strategies, helping traders stay aware of context and potential risk while executing their own process.
Common questions it can help inform include:
What type of market environment is currently present?
Is momentum developing, stalling, or absent?
Are volatility or liquidity conditions elevated?
Does the environment appear clean or structurally fragile?
M🜁rketMind PRO describes conditions as they are.
Interpretation and decision-making remain entirely with the trader.
DESIGN PHILOSOPHY ────────────────────
M🜁rketMind PRO is intentionally descriptive.
It includes context and caution layers without interpretive or evaluative frameworks:
Market context, momentum, and risk visibility
Volatility, liquidity, and structural awareness
Session awareness without gating or execution logic
A single, consistent HUD perspective
No confidence scoring or conviction grading
No predictive or forward-looking language
Nothing is implied.
Nothing is projected.
This script shows what is happening and where risk may exist — nothing more.
WHO IT IS FOR ────────────────────
M🜁rketMind PRO is suited for traders who:
Prefer structured context over signals
Manage their own execution and risk decisions
Value awareness of environmental and structural conditions
Want clarity without interpretive bias
It is not designed for:
Buy or sell alerts
Execution guidance
Predictive or outcome-based analysis
IMPORTANT NOTES ────────────────────
M🜁rketMind PRO does not provide financial advice
No system can predict future price behavior
This tool is designed to inform awareness, not decisions
Used appropriately, M🜁rketMind PRO supports disciplined, context-aware trading

Volatility Targeting: Single Asset [BackQuant]Volatility Targeting: Single Asset
An educational example that demonstrates how volatility targeting can scale exposure up or down on one symbol, then applies a simple EMA cross for long or short direction and a higher timeframe style regime filter to gate risk. It builds a synthetic equity curve and compares it to buy and hold and a benchmark.
Important disclaimer
This script is a concept and education example only . It is not a complete trading system and it is not meant for live execution. It does not model many real world constraints, and its equity curve is only a simplified simulation. If you want to trade any idea like this, you need a proper strategy() implementation, realistic execution assumptions, and robust backtesting with out of sample validation.
Single asset vs the full portfolio concept
This indicator is the single asset, long short version of the broader volatility targeted momentum portfolio concept. The original multi asset concept and full portfolio implementation is here:
That portfolio script is about allocating across multiple assets with a portfolio view. This script is intentionally simpler and focuses on one symbol so you can clearly see how volatility targeting behaves, how the scaling interacts with trend direction, and what an equity curve comparison looks like.
What this indicator is trying to demonstrate
Volatility targeting is a risk scaling framework. The core idea is simple:
If realized volatility is low relative to a target, you can scale position size up so the strategy behaves like it has a stable risk budget.
If realized volatility is high relative to a target, you scale down to avoid getting blown around by the market.
Instead of always being 1x long or 1x short, exposure becomes dynamic. This is often used in risk parity style systems, trend following overlays, and volatility controlled products.
This script combines that risk scaling with a simple trend direction model:
Fast and slow EMA cross determines whether the strategy is long or short.
A second, longer EMA cross acts as a regime filter that decides whether the system is ACTIVE or effectively in CASH.
An equity curve is built from the scaled returns so you can visualize how the framework behaves across regimes.
How the logic works step by step
1) Returns and simple momentum
The script uses log returns for the base return stream:
ret = log(price / price )
It also computes a simple momentum value:
mom = price / price - 1
In this version, momentum is mainly informational since the directional signal is the EMA cross. The lookback input is shared with volatility estimation to keep the concept compact.
2) Realized volatility estimation
Realized volatility is estimated as the standard deviation of returns over the lookback window, then annualized:
vol = stdev(ret, lookback) * sqrt(tradingdays)
The Trading Days/Year input controls annualization:
252 is typical for traditional markets.
365 is typical for crypto since it trades daily.
3) Volatility targeting multiplier
Once realized vol is estimated, the script computes a scaling factor that tries to push realized volatility toward the target:
volMult = targetVol / vol
This is then clamped into a reasonable range:
Minimum 0.1 so exposure never goes to zero just because vol spikes.
Maximum 5.0 so exposure is not allowed to lever infinitely during ultra low volatility periods.
This clamp is one of the most important “sanity rails” in any volatility targeted system. Without it, very low volatility regimes can create unrealistic leverage.
4) Scaled return stream
The per bar return used for the equity curve is the raw return multiplied by the volatility multiplier:
sr = ret * volMult
Think of this as the return you would have earned if you scaled exposure to match the volatility budget.
5) Long short direction via EMA cross
Direction is determined by a fast and slow EMA cross on price:
If fast EMA is above slow EMA, direction is long.
If fast EMA is below slow EMA, direction is short.
This produces dir as either +1 or -1. The scaled return stream is then signed by direction:
avgRet = dir * sr
So the strategy return is volatility targeted and directionally flipped depending on trend.
6) Regime filter: ACTIVE vs CASH
A second EMA pair acts as a top level regime filter:
If fast regime EMA is above slow regime EMA, the system is ACTIVE.
If fast regime EMA is below slow regime EMA, the system is considered CASH, meaning it does not compound equity.
This is designed to reduce participation in long bear phases or low quality environments, depending on how you set the regime lengths. By default it is a classic 50 and 200 EMA cross structure.
Important detail, the script applies regime_filter when compounding equity, meaning it uses the prior bar regime state to avoid ambiguous same bar updates.
7) Equity curve construction
The script builds a synthetic equity curve starting from Initial Capital after Start Date . Each bar:
If regime was ACTIVE on the previous bar, equity compounds by (1 + netRet).
If regime was CASH, equity stays flat.
Fees are modeled very simply as a per bar penalty on returns:
netRet = avgRet - (fee_rate * avgRet)
This is not realistic execution modeling, it is just a simple turnover penalty knob to show how friction can reduce compounded performance. Real backtesting should model trade based costs, spreads, funding, and slippage.
Benchmark and buy and hold comparison
The script pulls a benchmark symbol via request.security and builds a buy and hold equity curve starting from the same date and initial capital. The buy and hold curve is based on benchmark price appreciation, not the strategy’s asset price, so you can compare:
Strategy equity on the chart symbol.
Buy and hold equity for the selected benchmark instrument.
By default the benchmark is TVC:SPX, but you can set it to anything, for crypto you might set it to BTC, or a sector index, or a dominance proxy depending on your study.
What it plots
If enabled, the indicator plots:
Strategy Equity as a line, colored by recent direction of equity change, using Positive Equity Color and Negative Equity Color .
Buy and Hold Equity for the chosen benchmark as a line.
Optional labels that tag each curve on the right side of the chart.
This makes it easy to visually see when volatility targeting and regime gating change the shape of the equity curve relative to a simple passive hold.
Metrics table explained
If Show Metrics Table is enabled, a table is built and populated with common performance statistics based on the simulated daily returns of the strategy equity curve after the start date. These include:
Net Profit (%) total return relative to initial capital.
Max DD (%) maximum drawdown computed from equity peaks, stored over time.
Win Rate percent of positive return bars.
Annual Mean Returns (% p/y) mean daily return annualized.
Annual Stdev Returns (% p/y) volatility of daily returns annualized.
Variance of annualized returns.
Sortino Ratio annualized return divided by downside deviation, using negative return stdev.
Sharpe Ratio risk adjusted return using the risk free rate input.
Omega Ratio positive return sum divided by negative return sum.
Gain to Pain total return sum divided by absolute loss sum.
CAGR (% p/y) compounded annual growth rate based on time since start date.
Portfolio Alpha (% p/y) alpha versus benchmark using beta and the benchmark mean.
Portfolio Beta covariance of strategy returns with benchmark returns divided by benchmark variance.
Skewness of Returns actually the script computes a conditional value based on the lower 5 percent tail of returns, so it behaves more like a simple CVaR style tail loss estimate than classic skewness.
Important note, these are calculated from the synthetic equity stream in an indicator context. They are useful for concept exploration, but they are not a substitute for professional backtesting where trade timing, fills, funding, and leverage constraints are accurately represented.
How to interpret the system conceptually
Vol targeting effect
When volatility rises, volMult falls, so the strategy de risks and the equity curve typically becomes smoother. When volatility compresses, volMult rises, so the system takes more exposure and tries to maintain a stable risk budget.
This is why volatility targeting is often used as a “risk equalizer”, it can reduce the “biggest drawdowns happen only because vol expanded” problem, at the cost of potentially under participating in explosive upside if volatility rises during a trend.
Long short directional effect
Because direction is an EMA cross:
In strong trends, the direction stays stable and the scaled return stream compounds in that trend direction.
In choppy ranges, the EMA cross can flip and create whipsaws, which is where fees and regime filtering matter most.
Regime filter effect
The 50 and 200 style filter tries to:
Keep the system active in sustained up regimes.
Reduce exposure during long down regimes or extended weakness.
It will always be late at turning points, by design. It is a slow filter meant to reduce deep participation, not to catch bottoms.
Common applications
This script is mainly for understanding and research, but conceptually, volatility targeting overlays are used for:
Risk budgeting normalize risk so your exposure is not accidentally huge in high vol regimes.
System comparison see how a simple trend model behaves with and without vol scaling.
Parameter exploration test how target volatility, lookback length, and regime lengths change the shape of equity and drawdowns.
Framework building as a reference blueprint before implementing a proper strategy() version with trade based execution logic.
Tuning guidance
Lookback lower values react faster to vol shifts but can create unstable scaling, higher values smooth scaling but react slower to regime changes.
Target volatility higher targets increase exposure and drawdown potential, lower targets reduce exposure and usually lower drawdowns, but can under perform in strong trends.
Signal EMAs tighter EMAs increase trade frequency, wider EMAs reduce churn but react slower.
Regime EMAs slower regime filters reduce false toggles but will miss early trend transitions.
Fees if you crank this up you will see how sensitive higher turnover parameter sets are to friction.
Final note
This is a compact educational demonstration of a volatility targeted, long short single asset framework with a regime gate and a synthetic equity curve. If you want a production ready implementation, the correct next step is to convert this concept into a strategy() script, add realistic execution and cost modeling, test across multiple timeframes and market regimes, and validate out of sample before making any decision based on the results.

ZynIQ Market Regime Master Pro v2 - (Pro Plus Pack)Overview
ZynIQ Market Regime Master Pro v2 identifies shifts in market conditions by analysing volatility, directional flow and structural behaviour. It highlights when the market transitions between trending, ranging, expansion and contraction phases, giving traders clearer context for decision making.
Key Features
• Multi-factor regime detection (trend, range, expansion, contraction)
• Adaptive volatility and momentum analysis
• Direction-aware colour transitions
• Optional HTF regime overlay
• Configurable sensitivity to match different markets
• Clean visuals suitable for intraday or swing trading
• Complements trend, breakout, liquidity and volume tools
Use Cases
• Determining whether the market is trending or ranging
• Identifying expansion phases vs contraction phases
• Filtering signals during unfavourable regimes
• Combining regime context with structure or breakout tools
Notes
This tool provides regime classification and contextual analysis. It is not a trading system by itself. Use with your own confirmation and risk management.

Regime [CHE] Regime — Minimal HTF MACD histogram regime marker with a simple rising versus falling state.
Summary
Regime is a lightweight overlay that turns a higher-timeframe-style MACD histogram condition into a simple regime marker on your chart. It queries an imported core module to determine whether the histogram is rising and then paints a consistent marker color based on that boolean state. The output is intentionally minimal: no lines, no panels, no extra smoothing visuals, just a repeated marker that reflects the current regime. This makes it useful as a quick context filter for other signals rather than a standalone system.
Motivation: Why this design?
A common problem in discretionary and systematic workflows is clutter and over-interpretation. Many regime tools draw multiple plots, which can distract from price structure. This script reduces the regime idea to one stable question: is the MACD histogram rising under a given preset and smoothing length. The core logic is delegated to a shared module to keep the indicator thin and consistent across scripts that rely on the same definition.
What’s different vs. standard approaches?
Reference baseline: A standard MACD histogram plotted in a separate pane with manual interpretation.
Architecture differences:
Uses a shared library call for the regime decision, rather than re-implementing MACD logic locally.
Uses a single boolean output to drive marker color, rather than plotting histogram bars.
Uses fixed marker placement at the bottom of the chart for consistent visibility.
Practical effect:
You get a persistent “context layer” on price without dedicating a separate pane or reading histogram amplitude. The chart shows state, not magnitude.
How it works (technical)
1. The script imports `chervolino/CoreMACDHTF/2` and calls `core.is_hist_rising()` on each bar.
2. Inputs provide the source series, a preset string for MACD-style parameters, and a smoothing length used by the library function.
3. The library returns a boolean `rising` that represents whether the histogram is rising according to the library’s internal definition.
4. The script maps that boolean to a color: yellow when rising, blue otherwise.
5. A circle marker is plotted on every bar at the bottom of the chart, colored by the current regime state. Only the most recent five hundred bars are displayed to limit visual load.
Notes:
The exact internal calculation details of `core.is_hist_rising()` are not shown in this code. Any higher timeframe mechanics, security usage, or confirmation behavior are determined by the imported library. (Unknown)
Parameter Guide
Source — Selects the price series used by the library call — Default: close — Tips: Use close for consistency; alternate sources may shift regime changes.
Preset — Chooses parameter preset for the library’s MACD-style configuration — Default: 3,10,16 — Trade-offs: Faster presets tend to flip more often; slower presets tend to react later.
Smoothing Length — Controls smoothing used inside the library regime decision — Default: 21 — Bounds: minimum one — Trade-offs: Higher values typically reduce noise but can delay transitions. (Library behavior: Unknown)
Reading & Interpretation
Yellow markers indicate the library considers the histogram to be rising at that bar.
Blue markers indicate the library considers it not rising, which may include falling or flat conditions depending on the library definition. (Unknown)
Because markers repeat on every bar, focus on transitions from one color to the other as regime changes.
This tool is best read as context: it does not express strength, only direction of change as defined by the library.
Practical Workflows & Combinations
Trend following:
Use yellow as a condition to allow long-side entries and blue as a condition to allow short-side entries, then trigger entries with your primary setup such as structure breaks or pullback patterns. (Optional)
Exits and stops:
Consider tightening management after a color transition against your position direction, but do not treat a single flip as an exit signal without price-based confirmation. (Optional)
Multi-asset and multi-timeframe:
Keep `Source` consistent across assets.
Use the slower preset when instruments are noisy, and the faster preset when you need earlier context shifts. The best transferability depends on the imported library’s behavior. (Unknown)
Behavior, Constraints & Performance
Repaint and confirmation:
This script itself uses no forward-looking indexing and no explicit closed-bar gating. It evaluates on every bar update.
Any repaint or confirmation behavior may come from the imported library. If the library uses higher timeframe data, intrabar updates can change the state until the higher timeframe bar closes. (Unknown)
security and HTF:
Not visible here. The library name suggests HTF behavior, but the implementation is not shown. Treat this as potentially higher-timeframe-driven unless you confirm the library source. (Unknown)
Resources:
No loops, no arrays, no heavy objects. The plotting is one marker series with a five hundred bar display window.
Known limits:
This indicator does not convey histogram magnitude, divergence, or volatility context.
A binary regime can flip in choppy phases depending on preset and smoothing.
Sensible Defaults & Quick Tuning
Starting point:
Source: close
Preset: 3,10,16
Smoothing Length: 21
Tuning recipes:
Too many flips: choose the slower preset and increase smoothing length.
Too sluggish: choose the faster preset and reduce smoothing length.
Regime changes feel misaligned with your entries: keep the preset, switch the source back to close, and tune smoothing length in small steps.
What this indicator is—and isn’t
This is a minimal regime visualization and a context filter. It is not a complete trading system, not a risk model, and not a prediction engine. Use it together with price structure, execution rules, and position management. The regime definition depends on the imported library, so validate it against your market and timeframe before relying on it.
Disclaimer
The content provided, including all code and materials, is strictly for educational and informational purposes only. It is not intended as, and should not be interpreted as, financial advice, a recommendation to buy or sell any financial instrument, or an offer of any financial product or service. All strategies, tools, and examples discussed are provided for illustrative purposes to demonstrate coding techniques and the functionality of Pine Script within a trading context.
Any results from strategies or tools provided are hypothetical, and past performance is not indicative of future results. Trading and investing involve high risk, including the potential loss of principal, and may not be suitable for all individuals. Before making any trading decisions, please consult with a qualified financial professional to understand the risks involved.
By using this script, you acknowledge and agree that any trading decisions are made solely at your discretion and risk.
Do not use this indicator on Heikin-Ashi, Renko, Kagi, Point-and-Figure, or Range charts, as these chart types can produce unrealistic results for signal markers and alerts.
Best regards and happy trading
Chervolino
MACD HTF Hardcoded

Macro Return ForecastWhen the macro environment was similar, what annualized return did the market usually deliver next?
Before using the indicator, make sure your chart is set to any US-market symbol (SPX, QQQ, DIA, etc.).
This requirement is simple: the indicator pulls macro series from US data (yields, TIPS, credit spreads, breadth of US indices).
Because these series are independent from the chart’s price series, the chart symbol itself does not affect the internal calculations.
Any US symbol works, and the output of the model will be identical as long as you are on a US asset with daily, weekly or monthly timeframe.
The plotted price does not matter: the macro engine is fully exogenous to the chart symbol.
1. What the indicator does relative to selected assets
In the settings you choose which market you want to analyze:
- S&P500
- Nasdaq or NQ100
- Dow Jones
- Russell 2000
- US-wide (VTI)
- S&P500 sectors (XLF, XLY, XLP, etc.)
For each one, the indicator loads:
- Its internal breadth series (percentage of constituents above MA200)
- Its price history to compute forward log-returns at multiple horizons
- Its regime position relative to its own MA200 (for bull/bear filtering)
This means the tool is not tied to the chart symbol you display.
If your chart is SPX but the indicator setting is “S&P500 Technology”, the expected return projection is computed for the Technology sector using its own data, not the chart’s data.
You can therefore:
- Visualize macro-driven expected returns for any major US index or sector.
- Compare how different parts of the market historically reacted to similar macro states.
- Switch assets instantly to see which segment historically behaved better in comparable macro conditions.
The indicator becomes an analyzer of macro sensitivity, not a chart-dependent indicator.
2. Method overview
The model answers a statistical question:
“When macro conditions looked like they do today, what forward annualized return did this asset usually deliver?”
To do this it combines four macro pillars:
- Market breadth of the selected asset
- Yield curve slope (US 10Y minus 2Y)
- US credit spread (high yield minus gov)
- US real rate (TIPS 10Y)
It normalizes each metric into a 0–100 score, groups similar historical states into bins, and examines what the asset did next across six horizons (from ~9 months to ~5 years).
This produces a historical map connecting macro states to realized forward returns.
It is not a forecast model.
It is a conditional-distribution estimator: it tells you what has historically happened from similar setups.
3. Why this produces useful insights on assets
For any chosen asset (SPX, Nasdaq, sectors…), the indicator computes:
- Its forward return distribution in similar macro states.
- How often these states occurred (n).
- Whether the macro environment that preceded positive returns in the past resembles today’s.
- Whether the asset tends to be more sensitive or more resilient than the broad index under given macro configurations.
- Whether a given sector historically benefited from specific yield-curve, credit or real-rate environments.
This lets you answer questions such as:
- Does this sector usually outperform in an inverted yield curve environment?
- Does the Nasdaq historically recover strongly after breadth collapses?
- How did the S&P500 behave historically when real rates were this high?
- Is today’s credit-spread environment typically associated with positive or negative forward returns for this index?
These insights are not predictions but statistical context backed by past market behavior.
4. Why the technique is robust (and why it matters)
The engine uses strict, non-optimistic data processing:
- Winsorization of returns to neutralize extreme outliers without deleting information.
- Shrinkage estimators to avoid overfitting when bins contain few occurrences.
- Adaptive or static bounds for scaling macro indicators, ensuring comparability across cycles.
- Inverse-variance weighting of horizons with penalties for horizon redundancy.
- HAC-style adjustments to reduce autocorrelation bias in return estimation.
Each method aims to prevent artificial inflation of expected-return values and to keep the estimator stable even in unusual macro states.
This produces a result that is not “optimistic”, not curve-fit, not dependent on chart tricks, and not sensitive to isolated historical anomalies.
5. What you get as a user
A single clean line:
Expected Annual Return (%)
This line reflects how the chosen asset historically performed after macro environments similar to today’s.
The color gradient and confidence indicator (n) show the density of comparable episodes in history.
This makes the output extremely simple to read:
- High, stable expectation: historically supportive macro environment.
- Low or negative expectation: historically weaker environments.
- Low confidence: the macro state is rare and historical comparisons are limited.
The tool therefore adds context, not signals.
It helps you understand the environment the asset is currently in, based on how markets behaved in similar conditions across US market history.

Volatility Signal-to-Noise Ratio🙏🏻 this is VSNR: the most effective and simple volatility regime detector & automatic volatility threshold scaler that somehow no1 ever talks about.
This is simply an inverse of the coefficient of variation of absolute returns, but properly constructed taking into account temporal information, and made online via recursive math with algocomplexity O(1) both in expanding and moving windows modes.
How do the available alternatives differ (while some’re just worse)?
Mainstream quant stat tests like Durbin-Watson, Dickey-Fuller etc: default implementations are ALL not time aware. They measure different kinds of regime, which is less (if at all) relevant for actual trading context. Mix of different math, high algocomplexity.
The closest one is MMI by financialhacker, but his approach is also not time aware, and has a higher algocomplexity anyways. Best alternative to mine, but pls modify it to use a time-weighted median.
Fractal dimension & its derivatives by John Ehlers: again not time aware, very low info gain, relies on bar sizes (high and lows), which don’t always exist unlike changes between datapoints. But it’s a geometric tool in essence, so this is fundamental. Let it watch your back if you already use it.
Hurst exponent: much higher algocomplexity, mix of parametric and non-parametric math inside. An invention, not a math entity. Again, not time aware. Also measures different kinds of regime.
How to set it up:
Given my other tools, I choose length so that it will match the amount of data that your trading method or study uses multiplied by ~ 4-5. E.g if you use some kind of bands to trade volatility and you calculate them over moving window 64, put VSNR on 256.
However it depends mathematically on many things, so for your methods you may instead need multipliers of 1 or ~ 16.
Additionally if you wanna use all data to estimate SNR, put 0 into length input.
How to use for regime detection:
First we define:
MR bias: mean reversion bias meaning volatility shorts would work better, fading levels would work better
Momo bias: momentum bias meaning volatility longs would work better, trading breakouts of levels would work better.
The study plots 3 horizontal thresholds for VSNR, just check its location:
Above upper level: significant Momo bias
Above 1 : Momo bias
Below 1 : MR bias
Below lower level: significant MR bias
Take a look at the screenshots, 2 completely different volatility regimes are spotted by VSNR, while an ADF does not show different regime:
^^ CBOT:ZN1!
^^ INDEX:BTCUSD
How to use as automatic volatility threshold scaler
Copy the code from the script, and use VSNR as a multiplier for your volatility threshold.
E.g you use a regression channel and fade/push upper and lower thresholds which are RMSEs multiples. Inside the code, multiply RMSE by VSNR, now you’re adaptive.
^^ The same logic as when MM bots widen spreads with vola goes wild.
How it works:
Returns follow Laplace distro -> logically abs returns follow exponential distro , cuz laplace = double exponential.
Exponential distro has a natural coefficient of variation = 1 -> signal to noise ratio defined as mean/stdev = 1 as well. The same can be said for Student t distro with parameter v = 4. So 1 is our main threshold.
We can add additional thresholds by discovering SNRs of Student t with v = 3 and v = 5 (+- 1 from baseline v = 4). These have lighter & heavier tails each favoring mean reversion or momentum more. I computed the SNR values you see in the code with mpmath python module, with precision 256 decimals, so you can trust it I put it on my momma.
Then I use exponential smoothing with properly defined alphas (one matches cumulative WMA and another minimizes error with WMA in moving window mode) to estimate SNR of abs returns.
…
Lightweight huh?
∞

MILLION MEN - Zone ScannerWhat it is
MILLION MEN - Zone Scanner is a context-driven momentum tool that visualizes trend regimes (bullish / bearish) and highlights the first-touch opportunity within each regime’s reactive zones. It’s designed to help traders identify pullbacks inside an existing bias rather than chasing breakouts.
How it works
Uses a custom RSI-style momentum meter calculated from RMA of up/down moves.
When the meter > upper threshold → Green Regime.
When the meter < lower threshold → Red Regime.
Defines LONG Zone (34 – 40) and SHORT Zone (60 – 70) for mean-reversion touches.
Prints L FT or S FT on the first confirmed touch after a regime turns on.
Optional candle-color filter (green bar for LONG / red bar for SHORT).
Exit signals trigger once the meter revisits the regime boundary.
Optional Neon Glow styling improves visual clarity without clutter.
How to use
Identify regime direction (green = bullish bias, red = bearish bias).
Wait for the first touch into the relevant zone.
Confirm with higher-time-frame structure or volume context.
Manage position or exit once the meter retests its regime limit.
Use it as a context tool, not an auto-entry system.
Originality & Value
This script enforces discipline by allowing only one signal per regime, reducing over-trading and noise. The zone visualization and glow layers offer a clean, cinematic UI consistent with the MILLION MEN visual standard.
Limitations & Transparency
Works best on standard candlesticks and normal-time frames (tested on BTC, ETH, XRP, BNB, XAUUSD).
No look-ahead or future data.
Signals are bar-close confirmed (barstate.isconfirmed).
Educational tool — not financial advice.
Free Protected Version
Published for public educational use under the MILLION MEN framework. Core logic is protected to maintain script integrity.

Choppiness Index | CipherDecodedThe Choppiness Index is a multi-timeframe regime indicator that measures whether price action is trending or consolidating.
This recreation was inspired by the Choppiness Index chart from Checkonchain, with full credit to their team for the idea.
🔹 How It Works
CI = 100 * log10( SUM(ATR(1), n) / (highest(high, n) – lowest(low, n)) ) / log10(n)
Where:
n – lookback length (e.g. 14 days / 10 weeks / 10 months)
ATR(1) – true-range of each bar
SUM(ATR(1), n) – total true-range over n bars
highest(high, n) and lowest(low, n) – price range over n bars
Low values → strong trend
High values → sideways consolidation
Below is a simplified function used in the script for computing CI on any timeframe:
f_ci(_n) =>
_tr = ta.tr(true)
_sum = math.sum(_tr, _n)
_hh = ta.highest(high, _n)
_ll = ta.lowest(low, _n)
_rng = _hh - _ll
_rng > 0 ? 100 * math.log10(_sum / _rng) / math.log10(_n) : na
Consolidation Threshold — 50.0
Trend Threshold — 38.2
When Weekly CI < Trend Threshold, a trending zone (yellow) appears.
When Weekly CI > Consolidation Threshold, a consolidation zone (purple) appears.
Users can toggle either background independently.
🔹 Example Background Logic
bgcolor(isTrend and Trend ? color.new(#f3e459, 50) : na, title = "Trending", force_overlay = true)
bgcolor(isConsol and Cons ? color.new(#974aa5, 50) : na, title = "Consolidation", force_overlay = true)
🔹 Usage Tips
Observe the Weekly CI for regime context.
Combine with price structure or trend filters for signal confirmation.
Low CI values (< 38) indicate strong trend activity — the market may soon consolidate to reset.
High CI values (> 60) reflect sideways or range-bound conditions — the market is recharging before a potential new trend.
🔹 Disclaimer
This indicator is provided for educational purposes.
No trading outcomes are guaranteed.
This tool does not guarantee market turns or performance; it should be used as part of a broader system.
Use responsibly and perform your own testing.
🔹 Credits
Concept origin — Checkonchain Choppiness Index

AI Bot Regime Feed (v6) — stableThis indicator generates real-time, structured JSON alerts for external trading bots or automation systems.
It combines multiple technical layers to identify market regimes and high-probability buy/sell events, and sends them to any webhook endpoint (e.g., a FastAPI or Zapier listener).

Markov Chain Regime & Next‑Bar Probability Forecast✨ What it is
A regime-aware, math-driven panel that forecasts the odds for the very next candle. It shows:
• P(next r > 0)
• P(next r > +θ)
• P(next r < −θ)
• A 4-bucket split of next-bar outcomes (>+θ | 0..+θ | −θ..0 | <−θ)
• Next-regime probabilities: Calm | Neutral | Volatile
🧠 Why the math is strong
• Markov regimes: Markets cluster in volatility “moods.” We learn a 3-state regime S∈{Calm, Neutral, Volatile} with a transition matrix A, where A = P(Sₜ₊₁=j | Sₜ=i).
• Condition on the future state: We estimate event odds given the next regime j—
q_pos(j)=P(rₜ₊₁>0 | Sₜ₊₁=j), q_gt(j)=P(rₜ₊₁>+θ | Sₜ₊₁=j), q_lt(j)=P(rₜ₊₁<−θ | Sₜ₊₁=j)—
and mix them with transitions from the current (or frozen) state sNow:
P(event) = Σⱼ A · q(event | j).
This mixture-of-regimes view (HMM-style one-step prediction) ties next-bar outcomes to where volatility is likely headed.
• Statistical hygiene: Laplace/Beta smoothing, minimum-sample gating, and unconditional fallbacks keep estimates stable. Heavy computations run on confirmed bars; “Freeze at close” avoids intrabar flicker.
📊 What each value means
• Regime label & background: 🟩 Calm, 🟧 Neutral, 🟥 Volatile — quick read of market context.
• P(next r > 0): Directional tilt for the very next bar.
• P(next r > +θ): Odds of an outsized positive move beyond θ.
• P(next r < −θ): Odds of an outsized negative move beyond −θ.
• Partition row: Distributes next-bar probability across four intuitive buckets; they ≈ sum to 100%.
• Next Regime Probs: Likelihood of switching to Calm/Neutral/Volatile on the next bar (row of A for the current/frozen state).
• Samples row: How many next-bar samples support each next-state estimate (a confidence cue).
• Smoothing α: The Laplace prior used to stabilize binary event rates.
⚙️ Inputs you control
• Returns: Log (default) or %
• Include Volume (z-score) + lookback
• Include Range (HL/PrevClose)
• Rolling window N (transitions & estimates)
• θ as percent (e.g., 0.5%)
• Freeze forecast at last close (recommended)
• Display toggles (plots, partition, samples)
🎯 How to use it
• Volatility awareness & sizing: Rising P(next regime = Volatile) → consider smaller size, wider stops, or skipping marginal entries.
• Breakout preparation: Elevated P(next r > +θ) highlights environments where range expansion is more likely; pair with your setup/trigger.
• Defense for mean-reversion: If P(next r < −θ) lifts while you’re late long (or P(next r > +θ) lifts while late short), tighten risk or wait for better context.
• Calibration tip: Start θ near your market’s typical bar size; adjust until “>+θ” flags truly meaningful moves for your timeframe.
📝 Method notes & limits
Activity features (|r|, volume z, range) are standardized; only positive z’s feed the composite activity score. Estimates adapt to instrument/timeframe; rare regimes or small windows increase variance (hence smoothing, sample gating, fallbacks). This is a context/forecast tool, not a standalone signal—combine with your entry/exit rules and risk management.
🧩 Strategies too
We also develop full strategy versions that use these probabilities for entries, filters, and position sizing. Like this publication if you’d like us to release the strategy edition next.
⚠️ Disclaimer
Educational use only. Not financial advice. Markets involve risk. Past performance does not guarantee future results.
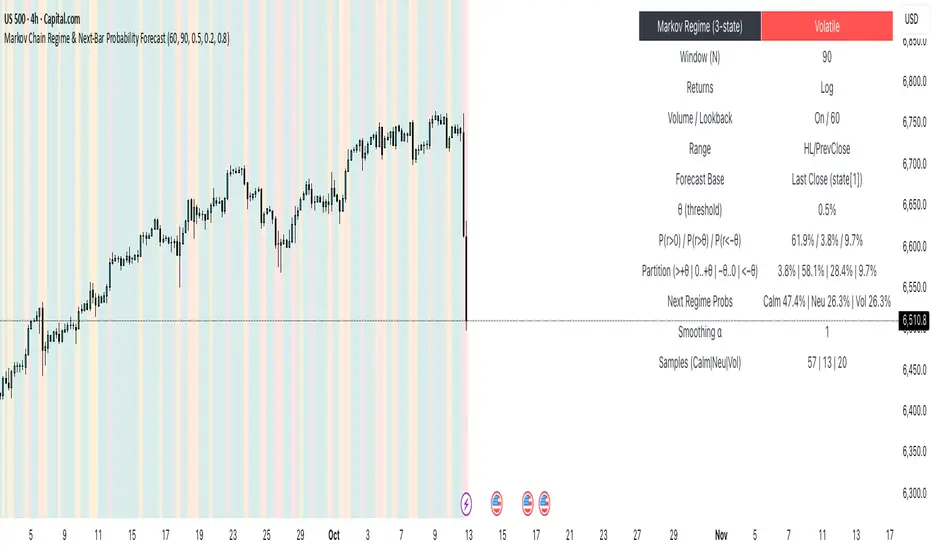
Market Regime IndexThe Market Regime Index is a top-down macro regime nowcasting tool that offers a consolidated view of the market’s risk appetite. It tracks 32 of the world’s most influential markets across asset classes to determine investor sentiment by applying trend-following signals to each independent asset. It features adjustable parameters and a built-in alert system that notifies investors when conditions transition between Risk-On and Risk-Off regimes. The selected markets are grouped into equities (7), fixed income (9), currencies (7), commodities (5), and derivatives (4):
Equities = S&P 500 E-mini Index Futures, Nasdaq-100 E-mini Index Futures, Russell 2000 E-mini Index Futures, STOXX Europe 600 Index Futures, Nikkei 225 Index Futures, MSCI Emerging Markets Index Futures, and S&P 500 High Beta (SPHB)/Low Beta (SPLV) Ratio.
Fixed Income = US 10Y Treasury Yield, US 2Y Treasury Yield, US 10Y-02Y Yield Spread, German 10Y Bund Yield, UK 10Y Gilt Yield, US 10Y Breakeven Inflation Rate, US 10Y TIPS Yield, US High Yield Option-Adjusted Spread, and US Corporate Option-Adjusted Spread.
Currencies = US Dollar Index (DXY), Australian Dollar/US Dollar, Euro/US Dollar, Chinese Yuan/US Dollar, Pound Sterling/US Dollar, Japanese Yen/US Dollar, and Bitcoin/US Dollar.
Commodities = ICE Brent Crude Oil Futures, COMEX Gold Futures, COMEX Silver Futures, COMEX Copper Futures, and S&P Goldman Sachs Commodity Index (GSCI) Futures.
Derivatives = CBOE S&P 500 Volatility Index (VIX), ICE US Bond Market Volatility Index (MOVE), CBOE 3M Implied Correlation Index, and CBOE VIX Volatility Index (VVIX)/VIX.
All assets are directionally aligned with their historical correlation to the S&P 500. Each asset contributes equally based on its individual bullish or bearish signal. The overall market regime is calculated as the difference between the number of Risk-On and Risk-Off signals divided by the total number of assets, displayed as the percentage of markets confirming each regime. Green indicates Risk-On and occurs when the number of Risk-On signals exceeds Risk-Off signals, while red indicates Risk-Off and occurs when the number of Risk-Off signals exceeds Risk-On signals.
Bullish Signal = (Fast MA – Slow MA) > (ATR × ATR Margin)
Bearish Signal = (Fast MA – Slow MA) < –(ATR × ATR Margin)
Market Regime = (Risk-On signals – Risk-Off signals) ÷ Total assets
This indicator is designed with flexibility in mind, allowing users to include or exclude individual assets that contribute to the market regime and adjust the input parameters used for trend signal detection. These parameters apply to each independent asset, and the overall regime signal is smoothed by the signal length to reduce noise and enhance reliability. Investors can position according to the prevailing market regime by selecting factors that have historically outperformed under each regime environment to minimise downside risk and maximise upside potential:
Risk-On Equity Factors = High Beta > Cyclicals > Low Volatility > Defensives.
Risk-Off Equity Factors = Defensives > Low Volatility > Cyclicals > High Beta.
Risk-On Fixed Income Factors = High Yield > Investment Grade > Treasuries.
Risk-Off Fixed Income Factors = Treasuries > Investment Grade > High Yield.
Risk-On Commodity Factors = Industrial Metals > Energy > Agriculture > Gold.
Risk-Off Commodity Factors = Gold > Agriculture > Energy > Industrial Metals.
Risk-On Currency Factors = Cryptocurrencies > Foreign Currencies > US Dollar.
Risk-Off Currency Factors = US Dollar > Foreign Currencies > Cryptocurrencies.
In summary, the Market Regime Index is a comprehensive macro risk-management tool that identifies the current market regime and helps investors align portfolio risk with the market’s underlying risk appetite. Its intuitive, color-coded design makes it an indispensable resource for investors seeking to navigate shifting market conditions and enhance risk-adjusted performance by selecting factors that have historically outperformed. While it has proven historically valuable, asset-specific characteristics and correlations evolve over time as market dynamics change.

Overnight Z/VolRatio SignalThis indicator highlights overnight setups where both volatility expansion and prior-day range deviation suggest directional opportunity at the RTH open.
It calculates:
• Overnight Z-Score (Z_long): how far the overnight session’s range tilts from the 20-day overnight mean, standardized by its standard deviation.
• VolRatio: ratio of the current RTH session volume to the 20-day average, a proxy for participation and conviction.
Signal Logic (LONG bias)
A long-bias condition triggers when:
• Z_long ≥ 0.40 (overnight tilt strongly positive)
• VolRatio ≥ 1.30 (above-average RTH volume)
• Optional filters: R1/R4 region alignment, YDH/YDL proximity, and other context flags.
Visuals mark qualifying days with colored labels and session highlights.
It is intended as a context signal — not an auto-trading system — for SPY/SPX/ES or correlated large-cap indices.
Usage Notes
• Works best when applied to daily or intraday 5m chart with extended hours enabled.
• Typical exit: ~150 minutes after 09:30 ET.
• Fridays are optionally excluded to avoid expiration-related distortions.

Trendline Breakout Strategy [KedArc Quant] Description
A single, rule-based system that builds two trendlines from confirmed swing pivots and trades their breakouts, with optional retest, trend-regime gates (EMA / HTF EMA), and ATR-based risk. All parts serve one decision flow: structure → breakout → gated entry → managed risk.
What it does (for traders)
Draws Up line (teal) through the last two Higher Lows and Down line (red) through the last two Lower Highs, then extends them forward.
Long when price breaks above red; Short when price breaks below teal.
Optional Retest entry: after a break, wait for a pullback toward the broken line within an ATR-scaled buffer.
Uses ATR stop and R-multiple target so risk is consistent across symbols/timeframes.
Labels HL1/HL2/LH1/LH2 so non-coders can verify which pivots built each line.
Why these components are combined
Pure breakout systems on trendlines suffer from three practical issues:
False breaks in chop → solved by trend-regime gates (EMA / HTF EMA) that only allow trades aligned with the prevailing trend.
Uneven volatility across markets/timeframes → solved by ATR-based stop/target, normalizing distance so R-multiples are comparable.
First break whipsaws near wedge apices → mitigated by the optional retest rule that demands a pullback/hold before entry.
These modules are not separate indicators with their own signals. They are support roles inside one method.
The pivot engine defines structure, the breakout detector defines signal, the regime gates decide if we’re allowed to take that signal, and the ATR module sizes risk.
Together they make the trendline breakout usable, testable, and explainable.
How it works (mechanism; each component explained)
1) Pivot engine (structure, non-repainting)
Swings are confirmed with ta.pivotlow/high(L, R). A pivot only exists after R bars (no look-ahead), so once plotted, the line built from those pivots will not repaint.
2) Trendline builder (geometry)
Teal line updates when two consecutive pivot lows satisfy HL2.price > HL1.price (and HL2 occurs after HL1).
Red line updates when two consecutive pivot highs satisfy LH2.price < LH1.price.
Lines are extended right and their current value is read every bar via line.get_price().
3) Breakout detector (signal)
On every bar, compute:
crossover(close, redLine) ⇒ Long breakout
crossunder(close, tealLine) ⇒ Short breakdown
4) Regime gates (trend filters, not separate signals)
EMA gate: allow longs only if close > EMA(len), shorts only if close < EMA(len).
HTF EMA gate (optional): same rule on a higher timeframe to avoid fighting the larger trend.
These do not create entries; they simply permit or block the breakout signal.
5) Retest module (optional confirmation)
After a breakout, record the line price. A valid retest occurs if price pulls back within an ATR-scaled buffer toward that broken line and then closes back in the breakout direction.
This reduces first-tick fakeouts.
6) Risk module (position exit)
Initial stop = ATR(len) × atrMult from entry.
Target = tpR × (ATR × atrMult) (e.g., 2R).
This keeps results consistent across instruments/timeframes.
Entries & exits
Long entry
Base: close breaks above red and passes EMA/HTF gates.
Retest (if enabled): after the break, price pulls back near the broken red line (within the ATR buffer) and holds; then enter.
Short entry
Mirror logic with teal (break below & gates), optionally with a retest.
Exit
strategy.exit places ATR stop & R-multiple target automatically.
Optional “flip”: close if the opposite base signal triggers.
How to use it (step-by-step)
Timeframe: 1–15m for intraday, 1–4h for swing.
Start defaults: Pivot L/R = 5, EMA len = 200, ATR len = 14, ATR mult = 2, TP = 2R, Retest = ON.
Tune sensitivity:
Faster lines (more trades): set L/R = 3–4.
Fewer counter-trend trades: enable HTF EMA (e.g., 60-min or Daily).
Visual audit: labels HL1/HL2 & LH1/LH2 show which pivots built each line—verify by eye.
Alerts: use Long breakout, Short breakdown, and Retest alerts to automate.
Originality (why it merits publication)
Trades the visualization: many “auto-trendline” tools only draw lines; this one turns them into testable, alertable rules.
Integrated design: each component has a defined role in the same pipeline—no unrelated indicators bolted together.
Transparent & non-repainting: pivot confirmation removes look-ahead; labels let non-coders understand the setup that produced each signal.
Notes & limitations
Lines update only after pivot confirmation; that lag is intentional to avoid repainting.
Breakouts near an apex can whipsaw; prefer Retest and/or HTF gate in choppy regimes.
Backtests are idealized; forward-test and size risk appropriately.
⚠️ Disclaimer
This script is provided for educational purposes only.
Past performance does not guarantee future results.
Trading involves risk, and users should exercise caution and use proper risk management when applying this strategy.

EMA vs TMA Regime FilterEMA vs TMA Regime Filter
This indicator is built as a visual study tool to compare the behavior of the Exponential Moving Average (EMA) and the Triangular Moving Average (TMA).
The EMA applies an exponential weighting to price data, giving stronger importance to the most recent values. This makes it a faster, more responsive line that reflects short-term momentum. The TMA, by contrast, applies a double-smoothing process (or in the “True TMA” option, a split SMA sequence), which produces a much slower curve. The TMA emphasizes balance over reactivity, often used for filtering noise and observing longer-term structure.
When both are plotted on the same chart, their differences become clear. The shaded region between them highlights times when short-term price dynamics diverge from longer-term smoothing. This is where the idea of “regime” comes in — not as a trading signal, but as a descriptive way of seeing whether market action is currently dominated by speed or by stability.
Users can customize:
Line styles, widths, and colors.
Cloud transparency for visual clarity.
Whether to color bars based on relative position (optional, purely visual).
The goal is not to create a system, but to help traders experiment, observe, and learn how different smoothing techniques can emphasize different aspects of price. By switching between the legacy and true TMA, or adjusting lengths, users can study how each approach interprets the same data differently.