Quantum Harmonic Oscillator Overlay🧪 Quantum Harmonic Oscillator Overlay
A visual model of price behavior using quantum harmonic oscillation principles
📜 Indicator Overview
The Quantum Harmonic Oscillator Overlay applies concepts from both classical physics (harmonic motion) and quantum mechanics (energy states) to model and visualize how price orbits around a central trend line. It overlays a Linear Regression line (representing the “mean position” or ground state of price) and calculates surrounding energy levels (σ-zones) akin to quantum shells that price can "jump" between.
This indicator is particularly useful for visualizing mean reversion, volatility compression/expansion, and momentum-driven price breakthroughs.
🧠 Core Concepts
Linear Regression Line (LSR): This is the calculated center of gravity or equilibrium path of price over a user-defined period. Think of it like the lowest energy state or central axis around which price vibrates.
Standard Deviation Zones (σ-levels):
1σ: The majority of normal price activity; within this range, price tends to fluctuate if in balance.
2σ: Indicates volatility or possible breakout pressure.
3σ: Represents extreme movement — a phase shift in energy, potentially leading to reversal or continuation with higher momentum.
Quantum Analogy: Just like in a quantum harmonic oscillator, particles (here, prices) move probabilistically between discrete energy states. The further the price moves from the center, the more "energy" (momentum, volume, volatility) is implied.
⚙️ Input Parameters
Setting Description
Linear Regression Length The number of bars used to calculate the regression trend (default 100). Affects the central path and responsiveness.
σ Multipliers (1σ, 2σ, 3σ) Determine how far each band is from the regression line. Adjusting these can highlight different price behaviors.
Show Energy Level Zones Toggle visibility of the colored bands around the regression line.
Show LSR Center Line Toggles visibility of the white Linear Regression line itself.
🎨 Visual Components
Color Zone Interpretation
✅ Green ±1σ Normal oscillation / mean reversion area. Ideal for range-bound strategies.
🟧 Orange ±2σ Warning zone; price may be gaining momentum or volatility.
🔴 Red ±3σ High-momentum state or anomaly. These regions may imply trend exhaustion, reversals, or breakouts.
White Line: The LSR — the average trajectory of the price movement.
Pink Dots: Appear when price exceeds Zone 3 (outside ±3σ) — a signal of extreme behavior or a possible regime shift.
📈 How to Use This Indicator
1. Detect Overextensions
When price touches or breaches the 3σ zone, it is likely overextended. This can be used to anticipate potential snapbacks or strong breakout trends.
2. Identify Mean Reversion Trades
If price exits the 2σ or 3σ zones and returns toward the center line, this signals a likely mean reversion setup.
3. Volatility Compression or Expansion
Flat zones between σ levels suggest calm markets; widening bands suggest expanding volatility.
4. Use with Confirmation Tools
Combine with momentum oscillators (MACD, RSI) or volume-based signals to confirm reversals or continuation outside Zone 3.
🔮 Philosophical Note
This indicator embodies the metaphor that the market behaves like a quantum oscillator — price particles exist in a probabilistic field and jump between discrete zones of volatility and energy. Tracking these transitions allows the trader to see price behavior as rhythmic, wave-like, and multidimensional rather than purely linear.
Regressions

52SIGNAL RECIPE CCI Linreg Bands═══ 52SIGNAL RECIPE CCI Linreg Bands ═══
◆ Overview
52SIGNAL RECIPE CCI Linreg Bands is an advanced technical indicator that combines the CCI (Commodity Channel Index) with Linear Regression Bands. This indicator visualizes the volatility of the CCI using linear regression bands, helping to clearly identify overbought/oversold areas and more accurately capture potential trend reversal points.
─────────────────────────────────────
◆ Key Features
• CCI-Based Overbought/Oversold Analysis: Uses the traditional CCI indicator to identify overbought/oversold conditions in the market
• Integrated Linear Regression Bands: Applies linear regression analysis to the CCI to visually represent the direction and strength of trends
• Dual Overbought/Oversold Levels: Sets overbought/oversold levels for both CCI and Linear Regression Bands to increase the accuracy of signals
• Advanced Visualization: Intuitive chart analysis is possible with color changes according to trend direction and clear band display
• Multiple Alert Settings: Alert functions for various conditions ensure you don't miss important trading moments
─────────────────────────────────────
◆ Technical Foundation
■ CCI (Commodity Channel Index)
• Basic Settings: 20-period CCI with Weighted Moving Average (WMA) applied
• Calculation Method: Measures the deviation from the average price normalized to a specific range
• Overbought/Oversold Levels: Default values set to +150 (overbought) and -150 (oversold)
■ Linear Regression Bands
• Period: Default value of 100 days
• Deviation: Default value of 4.5 standard deviations
• Center Line: The center line of the linear regression analysis for the CCI values
• Band Width: Displays the range of volatility around the center line based on the calculated standard deviation
• Overbought/Oversold Levels: Default values set to +250 (overbought) and -250 (oversold)
─────────────────────────────────────
◆ Practical Applications
■ Identifying Trading Signals
• Buy Signal:
▶ When the CCI falls below the oversold level (-150)
▶ When the lower band of the Linear Regression Bands falls below the oversold level (-250)
▶ When both conditions are met simultaneously (extreme oversold state) - a strong buy signal
• Sell Signal:
▶ When the CCI rises above the overbought level (+150)
▶ When the upper band of the Linear Regression Bands rises above the overbought level (+250)
▶ When both conditions are met simultaneously (extreme overbought state) - a strong sell signal
■ Trend Analysis
• Uptrend: When the linear regression center line is rising and the CCI is moving above the zero line
• Downtrend: When the linear regression center line is falling and the CCI is moving below the zero line
• Trend Strength: The wider the gap between the bands, the greater the volatility; the narrower, the more stable the trend
■ Divergence Confirmation
• Bearish Divergence: Price forms a new high, but the CCI is lower than the previous high (potential bearish signal)
• Bullish Divergence: Price forms a new low, but the CCI is higher than the previous low (potential bullish signal)
─────────────────────────────────────
◆ Advanced Setting Options
■ CCI Setting Adjustments
• CCI Source: Selectable options include Close (default), Open, High, Low, HL2, HLC3, OHLC4, etc.
• CCI Length: Adjust to lower values for short-term volatility, higher values for long-term trends
■ Linear Regression Setting Adjustments
• Period: Use lower values (20-50) for short-term analysis, higher values (100-200) for long-term analysis
• Deviation: Higher values create wider bands (more signals), lower values create narrower bands (more accurate signals)
■ Overbought/Oversold Level Adjustments
• CCI Levels: Adjust to more extreme values (±200) in highly volatile markets
• Linear Regression Band Levels: Adjustable to ±300 or ±200 depending on market conditions
─────────────────────────────────────
◆ Synergy with Other Indicators
• Bollinger Bands: Use alongside Bollinger Bands on the price chart to compare price volatility with CCI volatility
• MACD: Use with MACD for momentum and trend confirmation
• Fibonacci Retracement: Check CCI Linreg Bands signals with key support/resistance levels
• Moving Averages: Combine moving average crossovers with CCI Linreg Bands signals to improve reliability
─────────────────────────────────────
◆ Conclusion
52SIGNAL RECIPE CCI Linreg Bands provides a powerful and accurate technical analysis tool by combining traditional CCI with linear regression analysis. The dual overbought/oversold system increases the accuracy of trading signals and clearly visualizes trend direction and strength to help traders make decisions. You can achieve optimal results by adjusting various settings to match your trading style and market conditions.
─────────────────────────────────────
※ Disclaimer: Past performance does not guarantee future results. Always use appropriate risk management strategies.
═══ 52SIGNAL RECIPE CCI 선형회귀 밴드 ═══
◆ 개요
52SIGNAL RECIPE CCI 선형회귀 밴드는 CCI(Commodity Channel Index)와 선형회귀 밴드를 결합한 고급 기술적 지표입니다. 이 지표는 선형회귀 밴드를 사용하여 CCI의 변동성을 시각화하여 과매수/과매도 영역을 명확하게 식별하고 잠재적인 추세 반전 지점을 더 정확하게 포착하는 데 도움을 줍니다.
─────────────────────────────────────
◆ 주요 특징
• CCI 기반 과매수/과매도 분석: 전통적인 CCI 지표를 사용하여 시장의 과매수/과매도 상태를 식별
• 통합된 선형회귀 밴드: CCI에 선형회귀 분석을 적용하여 추세의 방향과 강도를 시각적으로 표현
• 이중 과매수/과매도 레벨: CCI와 선형회귀 밴드 모두에 과매수/과매도 레벨을 설정하여 신호의 정확도 향상
• 고급 시각화: 추세 방향에 따른 색상 변화와 명확한 밴드 표시로 직관적인 차트 분석 가능
• 다중 알림 설정: 다양한 조건에 대한 알림 기능으로 중요한 트레이딩 시점을 놓치지 않도록 보장
─────────────────────────────────────
◆ 기술적 기반
■ CCI (Commodity Channel Index)
• 기본 설정: 20기간 CCI에 가중이동평균(WMA) 적용
• 계산 방법: 평균 가격에 대한 편차를 측정하여 정규화한 값으로 표현
• 과매수/과매도 레벨: 기본값으로 +150(과매수)과 -150(과매도) 설정
■ 선형회귀 밴드
• 기간: 기본값 100일
• 편차: 기본값 4.5 표준편차
• 중심선: CCI 값에 대한 선형회귀 분석의 중심선
• 밴드 폭: 계산된 표준편차에 기반하여 중심선 주변의 변동성 범위 표시
• 과매수/과매도 레벨: 기본값으로 +250(과매수)와 -250(과매도) 설정
─────────────────────────────────────
◆ 실용적 응용
■ 트레이딩 신호 식별
• 매수 신호:
▶ CCI가 과매도 레벨(-150) 아래로 떨어질 때
▶ 선형회귀 밴드의 하단이 과매도 레벨(-250) 아래로 떨어질 때
▶ 두 조건이 동시에 충족될 때(극단적 과매도 상태) - 강한 매수 신호
• 매도 신호:
▶ CCI가 과매수 레벨(+150) 위로 상승할 때
▶ 선형회귀 밴드의 상단이 과매수 레벨(+250) 위로 상승할 때
▶ 두 조건이 동시에 충족될 때(극단적 과매수 상태) - 강한 매도 신호
■ 추세 분석
• 상승 추세: 선형회귀 중심선이 상승하고 CCI가 0선 위로 움직일 때
• 하락 추세: 선형회귀 중심선이 하락하고 CCI가 0선 아래로 움직일 때
• 추세 강도: 밴드 사이의 간격이 넓을수록 변동성이 크고, 좁을수록 추세가 안정적
■ 다이버전스 확인
• 약세 다이버전스: 가격이 신고점을 형성하지만 CCI가 이전 고점보다 낮을 때(잠재적 약세 신호)
• 강세 다이버전스: 가격이 신저점을 형성하지만 CCI가 이전 저점보다 높을 때(잠재적 강세 신호)
─────────────────────────────────────
◆ 고급 설정 옵션
■ CCI 설정 조정
• CCI 소스: 선택 가능한 옵션에는 종가(기본값), 시가, 고가, 저가, HL2, HLC3, OHLC4 등이 포함
• CCI 길이: 단기 변동성을 위해 낮은 값으로, 장기 추세를 위해 높은 값으로 조정
■ 선형회귀 설정 조정
• 기간: 단기 분석을 위해 낮은 값(20-50), 장기 분석을 위해 높은 값(100-200) 사용
• 편차: 높은 값은 더 넓은 밴드(더 많은 신호), 낮은 값은 더 좁은 밴드(더 정확한 신호) 생성
■ 과매수/과매도 레벨 조정
• CCI 레벨: 변동성이 큰 시장에서는 더 극단적인 값(±200)으로 조정
• 선형회귀 밴드 레벨: 시장 상황에 따라 ±300 또는 ±200으로 조정 가능
─────────────────────────────────────
◆ 다른 지표와의 시너지
• 볼린저 밴드: 가격 차트의 볼린저 밴드와 함께 사용하여 가격 변동성과 CCI 변동성 비교
• MACD: 모멘텀과 추세 확인을 위해 MACD와 함께 사용
• 피보나치 되돌림: CCI 선형회귀 밴드 신호를 주요 지지/저항 레벨과 함께 확인
• 이동평균선: 이동평균 교차와 CCI 선형회귀 밴드 신호를 결합하여 신뢰성 향상
─────────────────────────────────────
◆ 결론
52SIGNAL RECIPE CCI 선형회귀 밴드는 전통적인 CCI와 선형회귀 분석을 결합하여 강력하고 정확한 기술적 분석 도구를 제공합니다. 이중 과매수/과매도 시스템은 트레이딩 신호의 정확도를 높이고 추세 방향과 강도를 명확하게 시각화하여 트레이더의 의사 결정을 돕습니다. 다양한 설정을 트레이딩 스타일과 시장 상황에 맞게 조정하여 최적의 결과를 얻을 수 있습니다.
─────────────────────────────────────
※ 면책 조항: 과거 성과가 미래 결과를 보장하지 않습니다. 항상 적절한 리스크 관리 전략을 사용하세요.

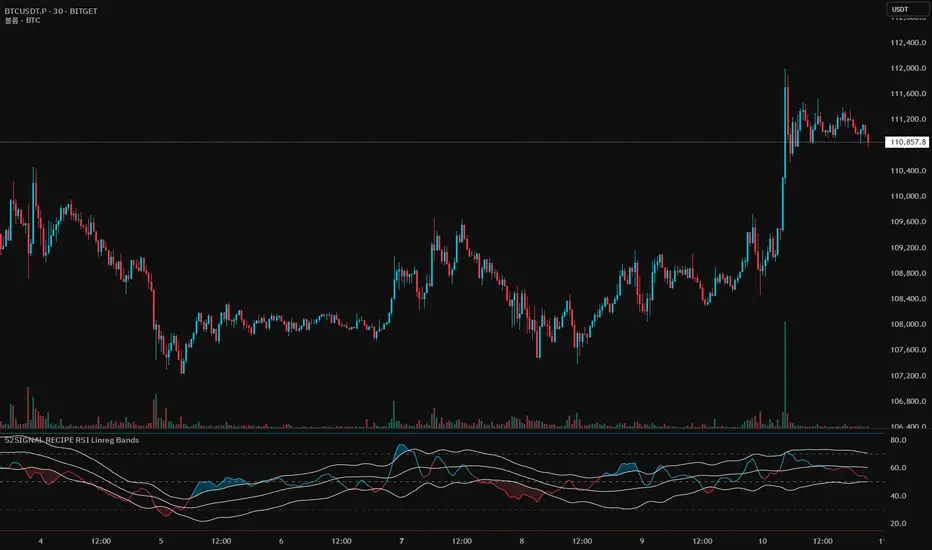
52SIGNAL RECIPE RSI Linreg Bands═══ 52SIGNAL RECIPE RSI Linreg Bands ═══
◆ Overview
52SIGNAL RECIPE RSI Linreg Bands is an advanced technical indicator that combines the RSI (Relative Strength Index) with Linear Regression Bands. This indicator visualizes the volatility of the RSI using linear regression bands, helping to clearly identify overbought/oversold areas and more accurately capture potential trend reversal points.
─────────────────────────────────────
◆ Key Features
• RSI-Based Overbought/Oversold Analysis: Uses the traditional RSI indicator to identify overbought/oversold conditions in the market
• Integrated Linear Regression Bands: Applies linear regression analysis to the RSI to visually represent the direction and strength of trends
• Dual Overbought/Oversold Levels: Sets overbought/oversold levels for both RSI and Linear Regression Bands to increase the accuracy of signals
• Advanced Visualization: Intuitive chart analysis is possible with color changes according to trend direction and clear band display
• Multiple Alert Settings: Alert functions for various conditions ensure you don't miss important trading moments
─────────────────────────────────────
◆ Technical Foundation
■ RSI (Relative Strength Index)
• Basic Settings: 14-period RSI with 5-period Weighted Moving Average (WMA) applied
• Calculation Method: Measures the relative strength of gains and losses, expressed as a value between 0-100
• Overbought/Oversold Levels: Default values set to 70 (overbought) and 30 (oversold)
■ Linear Regression Bands
• Period: Default value of 100 days
• Deviation: Default value of 2.5 standard deviations
• Center Line: The center line of the linear regression analysis for the RSI values
• Band Width: Displays the range of volatility around the center line based on the calculated standard deviation
• Overbought/Oversold Levels: Default values set to 85 (overbought) and 15 (oversold)
─────────────────────────────────────
◆ Practical Applications
■ Identifying Trading Signals
• Buy Signal:
▶ When the RSI falls below the oversold level (30)
▶ When the lower band of the Linear Regression Bands falls below the oversold level (15)
▶ When both conditions are met simultaneously (extreme oversold state) - a strong buy signal
• Sell Signal:
▶ When the RSI rises above the overbought level (70)
▶ When the upper band of the Linear Regression Bands rises above the overbought level (85)
▶ When both conditions are met simultaneously (extreme overbought state) - a strong sell signal
■ Trend Analysis
• Uptrend: When the linear regression center line is rising and the RSI is moving above the midline (50)
• Downtrend: When the linear regression center line is falling and the RSI is moving below the midline (50)
• Trend Strength: The wider the gap between the bands, the greater the volatility; the narrower, the more stable the trend
■ Divergence Confirmation
• Bearish Divergence: Price forms a new high, but the RSI is lower than the previous high (potential bearish signal)
• Bullish Divergence: Price forms a new low, but the RSI is higher than the previous low (potential bullish signal)
─────────────────────────────────────
◆ Advanced Setting Options
■ RSI Setting Adjustments
• RSI Source: Selectable options include Close (default), Open, High, Low, HL2, HLC3, OHLC4, etc.
• RSI Length: Adjust to lower values for short-term volatility, higher values for long-term trends
■ Linear Regression Setting Adjustments
• Period: Use lower values (20-50) for short-term analysis, higher values (100-200) for long-term analysis
• Deviation: Higher values create wider bands (more signals), lower values create narrower bands (more accurate signals)
■ Overbought/Oversold Level Adjustments
• RSI Levels: Adjust to more extreme values (80/20) in highly volatile markets
• Linear Regression Band Levels: Adjustable to 90/10 or 80/20 depending on market conditions
─────────────────────────────────────
◆ Synergy with Other Indicators
• Bollinger Bands: Use alongside Bollinger Bands on the price chart to compare price volatility with RSI volatility
• MACD: Use with MACD for momentum and trend confirmation
• Fibonacci Retracement: Check RSI Linreg Bands signals with key support/resistance levels
• Moving Averages: Combine moving average crossovers with RSI Linreg Bands signals to improve reliability
─────────────────────────────────────
◆ Conclusion
52SIGNAL RECIPE RSI Linreg Bands provides a powerful and accurate technical analysis tool by combining traditional RSI with linear regression analysis. The dual overbought/oversold system increases the accuracy of trading signals and clearly visualizes trend direction and strength to help traders make decisions. You can achieve optimal results by adjusting various settings to match your trading style and market conditions.
─────────────────────────────────────
※ Disclaimer: Past performance does not guarantee future results. Always use appropriate risk management strategies.
═══ 52SIGNAL RECIPE RSI 선형회귀 밴드 ═══
◆ 개요
52SIGNAL RECIPE RSI 선형회귀 밴드는 RSI(상대강도지수)와 선형회귀 밴드를 결합한 고급 기술적 지표입니다. 이 지표는 선형회귀 밴드를 사용하여 RSI의 변동성을 시각화하여 과매수/과매도 영역을 명확하게 식별하고 잠재적인 추세 반전 지점을 더 정확하게 포착하는 데 도움을 줍니다.
─────────────────────────────────────
◆ 주요 특징
• RSI 기반 과매수/과매도 분석: 전통적인 RSI 지표를 사용하여 시장의 과매수/과매도 상태를 식별
• 통합된 선형회귀 밴드: RSI에 선형회귀 분석을 적용하여 추세의 방향과 강도를 시각적으로 표현
• 이중 과매수/과매도 레벨: RSI와 선형회귀 밴드 모두에 과매수/과매도 레벨을 설정하여 신호의 정확도 향상
• 고급 시각화: 추세 방향에 따른 색상 변화와 명확한 밴드 표시로 직관적인 차트 분석 가능
• 다중 알림 설정: 다양한 조건에 대한 알림 기능으로 중요한 트레이딩 시점을 놓치지 않도록 보장
─────────────────────────────────────
◆ 기술적 기반
■ RSI (상대강도지수)
• 기본 설정: 14기간 RSI에 5기간 가중이동평균(WMA) 적용
• 계산 방법: 상승과 하락의 상대적 강도를 측정하여 0-100 사이의 값으로 표현
• 과매수/과매도 레벨: 기본값으로 70(과매수)과 30(과매도) 설정
■ 선형회귀 밴드
• 기간: 기본값 100일
• 편차: 기본값 2.5 표준편차
• 중심선: RSI 값에 대한 선형회귀 분석의 중심선
• 밴드 폭: 계산된 표준편차에 기반하여 중심선 주변의 변동성 범위 표시
• 과매수/과매도 레벨: 기본값으로 85(과매수)와 15(과매도) 설정
─────────────────────────────────────
◆ 실용적 응용
■ 트레이딩 신호 식별
• 매수 신호:
▶ RSI가 과매도 레벨(30) 아래로 떨어질 때
▶ 선형회귀 밴드의 하단이 과매도 레벨(15) 아래로 떨어질 때
▶ 두 조건이 동시에 충족될 때(극단적 과매도 상태) - 강한 매수 신호
• 매도 신호:
▶ RSI가 과매수 레벨(70) 위로 상승할 때
▶ 선형회귀 밴드의 상단이 과매수 레벨(85) 위로 상승할 때
▶ 두 조건이 동시에 충족될 때(극단적 과매수 상태) - 강한 매도 신호
■ 추세 분석
• 상승 추세: 선형회귀 중심선이 상승하고 RSI가 중간선(50) 위로 움직일 때
• 하락 추세: 선형회귀 중심선이 하락하고 RSI가 중간선(50) 아래로 움직일 때
• 추세 강도: 밴드 사이의 간격이 넓을수록 변동성이 크고, 좁을수록 추세가 안정적
■ 다이버전스 확인
• 약세 다이버전스: 가격이 신고점을 형성하지만 RSI가 이전 고점보다 낮을 때(잠재적 약세 신호)
• 강세 다이버전스: 가격이 신저점을 형성하지만 RSI가 이전 저점보다 높을 때(잠재적 강세 신호)
─────────────────────────────────────
◆ 고급 설정 옵션
■ RSI 설정 조정
• RSI 소스: 선택 가능한 옵션에는 종가(기본값), 시가, 고가, 저가, HL2, HLC3, OHLC4 등이 포함
• RSI 길이: 단기 변동성을 위해 낮은 값으로, 장기 추세를 위해 높은 값으로 조정
■ 선형회귀 설정 조정
• 기간: 단기 분석을 위해 낮은 값(20-50), 장기 분석을 위해 높은 값(100-200) 사용
• 편차: 높은 값은 더 넓은 밴드(더 많은 신호), 낮은 값은 더 좁은 밴드(더 정확한 신호) 생성
■ 과매수/과매도 레벨 조정
• RSI 레벨: 변동성이 큰 시장에서는 더 극단적인 값(80/20)으로 조정
• 선형회귀 밴드 레벨: 시장 상황에 따라 90/10 또는 80/20으로 조정 가능
─────────────────────────────────────
◆ 다른 지표와의 시너지
• 볼린저 밴드: 가격 차트의 볼린저 밴드와 함께 사용하여 가격 변동성과 RSI 변동성 비교
• MACD: 모멘텀과 추세 확인을 위해 MACD와 함께 사용
• 피보나치 되돌림: RSI 선형회귀 밴드 신호를 주요 지지/저항 레벨과 함께 확인
• 이동평균선: 이동평균 교차와 RSI 선형회귀 밴드 신호를 결합하여 신뢰성 향상
─────────────────────────────────────
◆ 결론
52SIGNAL RECIPE RSI 선형회귀 밴드는 전통적인 RSI와 선형회귀 분석을 결합하여 강력하고 정확한 기술적 분석 도구를 제공합니다. 이중 과매수/과매도 시스템은 트레이딩 신호의 정확도를 높이고 추세 방향과 강도를 명확하게 시각화하여 트레이더의 의사 결정을 돕습니다. 다양한 설정을 트레이딩 스타일과 시장 상황에 맞게 조정하여 최적의 결과를 얻을 수 있습니다.
─────────────────────────────────────
※ 면책 조항: 과거 성과가 미래 결과를 보장하지 않습니다. 항상 적절한 리스크 관리 전략을 사용하세요.
Asset Premium/Discount Monitor📊 Overview
The Asset Premium/Discount Monitor is a tool for analyzing the relative value between two correlated assets. It measures when one asset is trading at a premium or discount compared to its historical relationship with another asset, helping traders identify potential mean reversion opportunities, or pairs trading opportunities.
🎯 Use Cases
Perfect for analyzing:
NASDAQ:MSTR vs CRYPTO:BTCUSD - MicroStrategy's premium/discount to Bitcoin
NASDAQ:COIN vs BITSTAMP:BTCUSD - Coinbase's relative value to Bitcoin
NASDAQ:TSLA vs NASDAQ:QQQ - Tesla's premium to tech sector
Regional banks AMEX:KRE vs AMEX:XLF - Individual bank stocks vs financial sector
Any two correlated assets where relative value matters
Example of a trade: MSTR vs BTC - When indicator shows MSTR at 95% percentile (extreme premium): Short MSTR, Buy BTC. Then exit when the spread reverts to the mean, say 40-60% percentile.
🔧 How It Works
Core Calculation
Ratio Analysis: Calculates the price ratio between your asset and the correlated asset
Historical Baseline: Establishes the "normal" relationship using a 252-day moving average. You can change this.
Premium Measurement: Measures current deviation from historical average as a percentage
Statistical Context: Provides percentile rankings and standard deviation bands
The Math
Premium % = (Current Ratio / Historical Average Ratio - 1) × 100
🎨 Customization Options
Correlated Asset: Choose any symbol for comparison
Lookback Period: Adjust historical baseline (50-1000 days)
Smoothing: Reduce noise with moving average (1-50 days)
Visual Toggles: Show/hide bands and percentile lines
Color Themes: Customize premium/discount colors
📊 Interpretation Guide
Premium/Discount Reading
Positive %: Asset trading above historical relationship (premium)
Negative %: Asset trading below historical relationship (discount)
Near 0%: Asset at fair value relative to correlation
Percentile Ranking
90%+: Near recent highs - potential selling opportunity
10% and below: Near recent lows - potential buying opportunity
25-75%: Normal trading range
Signal Classifications
🔴 SELL PREMIUM: Asset expensive relative to recent range
🟡 Premium Rich: Moderately expensive, monitor for reversal
⚪ NEUTRAL: Fair value territory
🟡 Discount Opportunity: Moderately cheap, potential accumulation zone
🟢 BUY DISCOUNT: Asset cheap relative to recent range
🚨 Built-in Alerts
Extreme Premium Alert: Triggers when percentile > 95%
Extreme Discount Alert: Triggers when percentile < 5%
⚠️ Important Notes
Works best with highly correlated assets
Historical relationships can change - monitor correlation strength
Not investment advice - use as one factor in your analysis
Backtest thoroughly before implementing any strategy
🔄 Updates & Future Features
This indicator will be continuously improved based on user feedback. So... please give me your feedback!

Logistic Regression ICT FVG🚀 OVERVIEW
Welcome to the Logistic Regression Fair Value Gap (FVG) System — a next-gen trading tool that blends precision gap detection with machine learning intelligence.
Unlike traditional FVG indicators, this one evolves with each bar of price action, scoring and filtering gaps based on real market behavior.
🔧 CORE FEATURES
✨ Smart Gap Detection
Automatically identifies bullish and bearish Fair Value Gaps using volatility-aware candle logic.
📊 Probability-Based Filtering
Uses logistic regression to assign each gap a confidence score (0 to 1), showing only high-probability setups.
🔁 Real-Time Retest Tracking
Continuously watches how price interacts with each gap to determine if it deserves respect.
📈 Multi-Factor Assessment
Evaluates RSI, MACD, and body size at gap formation to build a full context snapshot.
🧠 Self-Learning Engine
The logistic regression model updates on each bar using gradient descent, refining its predictions over time.
📢 Built-In Alerts
Get instant alerts when a gap forms, gets retested, or breaks.
🎨 Custom Display Options
Control the color of bullish/bearish zones, and toggle on/off probability labels for cleaner charts.
🚩 WHAT MAKES IT DIFFERENT
This isn’t just another box-drawing indicator.
While others mark every imbalance, this system thinks before it draws — using statistical modeling to filter out noise and prioritize high-impact zones.
By learning from how price behaves around gaps (not just how they form), it helps you trade only what matters — not what clutters.
⚙️ HOW IT WORKS
1️⃣ Detection
FVGs are identified using ATR-based thresholds and sharp wick imbalances.
2️⃣ Behavior Monitoring
Every gap is tracked — and if respected enough times, it becomes part of the elite training set.
3️⃣ Context Capture
Each new FVG logs RSI, MACD, and body size to provide a feature-rich context for prediction.
4️⃣ Prediction (Logistic Regression)
The model predicts how likely the gap is to be respected and assigns it a probability score.
5️⃣ Classification & Alerts
Gaps above the threshold are plotted with score labels, and alerts trigger for entry/respect/break.
⚙️ CONFIGURATION PANEL
🔧 System Inputs
• Max Retests – How many times a gap must be respected to train the model
• Prediction Threshold – Minimum score to show a gap on the chart
• Learning Rate – Controls how fast the model adapts (default: 0.009)
• Max FVG Lifetime – Expiration duration for unused gaps
• Show Historic Gaps – Show/hide expired or invalidated gaps
🎨 Visual Options
• Bullish/Bearish Colors – Set gap colors to fit your chart style
• Confidence Labels – Show probability scores next to FVGs
• Alert Toggles – Enable alerts for:
– New FVG detected
– FVG respected (entry)
– FVG invalidated (break)
💡 WHY LOGISTIC REGRESSION?
Traditional FVG tools rely on candle shapes.
This system relies on probability — by training on RSI, MACD, and price behavior, it predicts whether a gap will act as a true liquidity zone.
Logistic regression lets the system continuously adapt using new data, making it more accurate the longer it runs.
That means smarter signals, fewer false positives, and a clearer view of where real opportunities lie.

Momentum Regression [BackQuant]Momentum Regression
The Momentum Regression is an advanced statistical indicator built to empower quants, strategists, and technically inclined traders with a robust visual and quantitative framework for analyzing momentum effects in financial markets. Unlike traditional momentum indicators that rely on raw price movements or moving averages, this tool leverages a volatility-adjusted linear regression model (y ~ x) to uncover and validate momentum behavior over a user-defined lookback window.
Purpose & Design Philosophy
Momentum is a core anomaly in quantitative finance — an effect where assets that have performed well (or poorly) continue to do so over short to medium-term horizons. However, this effect can be noisy, regime-dependent, and sometimes spurious.
The Momentum Regression is designed as a pre-strategy analytical tool to help you filter and verify whether statistically meaningful and tradable momentum exists in a given asset. Its architecture includes:
Volatility normalization to account for differences in scale and distribution.
Regression analysis to model the relationship between past and present standardized returns.
Deviation bands to highlight overbought/oversold zones around the predicted trendline.
Statistical summary tables to assess the reliability of the detected momentum.
Core Concepts and Calculations
The model uses the following:
Independent variable (x): The volatility-adjusted return over the chosen momentum period.
Dependent variable (y): The 1-bar lagged log return, also adjusted for volatility.
A simple linear regression is performed over a large lookback window (default: 1000 bars), which reveals the slope and intercept of the momentum line. These values are then used to construct:
A predicted momentum trendline across time.
Upper and lower deviation bands , representing ±n standard deviations of the regression residuals (errors).
These visual elements help traders judge how far current returns deviate from the modeled momentum trend, similar to Bollinger Bands but derived from a regression model rather than a moving average.
Key Metrics Provided
On each update, the indicator dynamically displays:
Momentum Slope (β₁): Indicates trend direction and strength. A higher absolute value implies a stronger effect.
Intercept (β₀): The predicted return when x = 0.
Pearson’s R: Correlation coefficient between x and y.
R² (Coefficient of Determination): Indicates how well the regression line explains the variance in y.
Standard Error of Residuals: Measures dispersion around the trendline.
t-Statistic of β₁: Used to evaluate statistical significance of the momentum slope.
These statistics are presented in a top-right summary table for immediate interpretation. A bottom-right signal table also summarizes key takeaways with visual indicators.
Features and Inputs
✅ Volatility-Adjusted Momentum : Reduces distortions from noisy price spikes.
✅ Custom Lookback Control : Set the number of bars to analyze regression.
✅ Extendable Trendlines : For continuous visualization into the future.
✅ Deviation Bands : Optional ±σ multipliers to detect abnormal price action.
✅ Contextual Tables : Help determine strength, direction, and significance of momentum.
✅ Separate Pane Design : Cleanly isolates statistical momentum from price chart.
How It Helps Traders
📉 Quantitative Strategy Validation:
Use the regression results to confirm whether a momentum-based strategy is worth pursuing on a specific asset or timeframe.
🔍 Regime Detection:
Track when momentum breaks down or reverses. Slope changes, drops in R², or weak t-stats can signal regime shifts.
📊 Trade Filtering:
Avoid false positives by entering trades only when momentum is both statistically significant and directionally favorable.
📈 Backtest Preparation:
Before running costly simulations, use this tool to pre-screen assets for exploitable return structures.
When to Use It
Before building or deploying a momentum strategy : Test if momentum exists and is statistically reliable.
During market transitions : Detect early signs of fading strength or reversal.
As part of an edge-stacking framework : Combine with other filters such as volatility compression, volume surges, or macro filters.
Conclusion
The Momentum Regression indicator offers a powerful fusion of statistical analysis and visual interpretation. By combining volatility-adjusted returns with real-time linear regression modeling, it helps quantify and qualify one of the most studied and traded anomalies in finance: momentum.

Economic Event Timer & Alerts [AlgoXcalibur]Stay ahead of market-moving news with this real-time event tracker and countdown alert system.
This essential algorithm displays critical scheduled events that may influence sudden spikes in market volatility, helping you stay aware and reduce exposure to unpredictable moves before they even happen. Featuring a captivating on-chart display with event titles, adjustable time zone, real-time countdowns, and live alert notifications — you’ll always know what’s ahead — so you can prepare, not react.
🧠 Algorithm Logic
The Economic Event Timer & Alerts system delivers critical market awareness through an array of integrated functions. At its core, a live countdown table provides real-time updates on the day’s scheduled economic events, with dynamic, color-coded countdowns that ensure fast and easy interpretation at a glance. Complementing the table, Countdown Alerts notify you 30 minutes, 10 minutes, and 1 minute prior to each event—giving you clear, timely reminders without the need to constantly monitor your chart. The adjustable time zone input supports ET, CT, MT, PT, or UTC, so the displayed time-of-event aligns with your trading session. Rigorously refined, the algorithm updates the table daily—and clearly displays No Scheduled Events Today to provide certainty and reassurance on days without scheduled events. Packaged in a minimalist, unobtrusive design, the tool remains visually clean and focused for serious traders.
Updated automatically for hassle-free peace of mind.
⚙️ Features
• Time Zone Selector: Easily toggle between time zones to match your trading session.
• Countdown Alerts: Enable real-time notifications to keep you informed and aware of events without having to monitor the chart.
• Update & Expiration Awareness Feature:
This innovative feature includes a simple visual and alert system that prompts you when it’s time to reload the indicator & recreate alerts — ensuring your alerts are always tied to the latest data update.
🔄 Update Available
On the final day of current event data, the indicator will:
• Display Update Available on the indicator’s table
• Send an alert at 4:00 PM ET reminding you to reload & recreate alerts
You can load the updated version anytime that day.
⛔ Expired
If not reloaded, the next day the indicator will:
• Display an EXPIRED banner on the indicator’s table
• Send a Data Expired alert every day at 8:30 AM ET that prompts you to recreate alerts, until you do or disable the alert.
This prevents missing event alerts unknowingly.
Why is this feature necessary?
Even though the indicator is updated when necessary (typically every 2–4 weeks) to provide upcoming event data automatically, TradingView alerts do not auto-update —they stay tied to the version of the script that was active when the alert was created.
This thoughtful refinement is designed to ensure your alerts remain synced to current events and ready for when it matters most.
🚨 Protect Your Capital
At AlgoXcalibur, we understand that the best way to be profitable is to avoid unnecessary risk.
Dedicated to empowering traders with insight that matters, we designed this tool to transform inconvenient economic calendars into effortless, essential information—displayed directly on your chart. Whether you’re managing open positions or timing new trades, knowing when impactful events are about to hit is crucial to being proactive, protecting capital, and trading with confidence. This is not a technical analysis indicator—this is a risk management tool that provides traders with a fundamental edge.
Built for traders who value risk management, market awareness, and algorithm automation.
🔐 To get access or learn more, visit the Author’s Instructions section.

Navy Seal Trading - EdgarTrader📌 Navy Seal Trading – Asia, London, and NY Sessions
This indicator clearly displays the ranges of the Asia, London, and New York sessions, featuring:
✅ Full range visualization for each session
✅ Asia session high, low, and midline, with extended projection lines for precise reaction analysis
✅ Clean, minimalistic, and professional colors to keep your chart focused
🔷 Designed for the Navy Seal Trading community, focused on precision, discipline, and professional execution in the markets.
Use it to:
✔️ Mark liquidity zones
✔️ Identify Asia manipulation ranges
✔️ Prepare executions in London and NY with clear context
💡 Remember: Clarity in your zones gives you the confidence and discipline to execute like a true Navy Seal Trader.

Xcalibur Signals & Alerts [AlgoXcalibur]An advanced trend-following algorithm forged to empower retail traders with an edge.
Xcalibur Signals & Alerts is a sophisticated, multi-layered algorithm designed to consistently deliver real-time trend signals—without clutter or unnecessary complexity. The system combines refined trend-following logic with breakout detection, flat-market filtration, false signal failsafes, take profit cues, live alerts, and more — all in a visually simple, easy-to-use indicator built for all assets, timeframes, and market conditions.
🧠 Algorithm Logic
Xcalibur Signals & Alerts operates on a systematic framework that evaluates multiple technical dimensions in harmony—directional alignment, momentum confirmation, relative strength, volume bias, breakout detection, Fibonacci calculations, and more. Rather than reacting to isolated triggers, it filters every opportunity through a multi-layered confirmation engine. It doesn’t just react to every move—it evaluates them. This cohesive approach ensures that each signal results from aligned conditions—not arbitrary thresholds. By combining structural awareness with adaptive filtering, Xcalibur maintains clarity and consistency across a wide range of market environments—delivering actionable signals without unnecessary noise or lag.
⚙️ User-Adjustable Features
• Adjustable Sensitivity:
Choose from 5 pre-tuned Signal Trigger Settings and 3 dynamic Confirmation Filter Modes to tailor the system to your trading style, asset, and timeframe. Candle color reflects the active trigger condition, while an adaptive cyan line displays the selected Confirmation Filter—blocking signals until the filter threshold is crossed.
• Directional Stability Filter: When enabled, this filter uses mean-reversion calculations to determine directional bias and block unreliable signals during choppy, indecisive price action. A magenta line represents this filter threshold and provides higher-confidence signals during periods of low directional conviction.
• Pullback Allowance Filter:
When enabled, this unique filter uses Fibonacci ratios to deliberately block signals from temporary pullbacks during strong trend periods. A green (uptrend) or red (downtrend) line marks the active pullback allowance zone.
• False Signal Failsafe
:
Two selectable modes:
Simple — Cancels the signal if price breaks the signal candle’s high or low.
Advanced — Requires both a price break and opposing momentum confirmation.
When triggered, the system plots a white “X” signal, turns candles gray, disables the background color, sends an alert (if enabled), and enters standby mode until a valid trend condition re-emerges.
• Reaction Zones:
Identifies probable reversal or breakout zones based on recent price action patterns. A yellow line appears when active, with a yellow caution flag plotted if the price reaches this critical area.
• Take-Profit Cues
: Automatically detects potential trend exhaustion using price action structure and momentum shifts. When triggered, a visual “TP” marker is plotted—advising traders to manage profits or prepare for a possible reversal.
• Trailing Stop:
Plots a dynamic, percentage-based trailing stop or trailing take-profit using your selected input. Adjust it to suit your risk tolerance and asset.
• Multi-Timeframe Monitor
: Displays real-time trend direction across 1m, 2m, 5m, 15m, 1H, 4H, and 1D timeframes in a compact, easy-to-read table.
• Alert System
:
Receive desktop and/or mobile alerts for:
* New trend signals
* Failsafe triggers
* 9:00 AM Morning Greeting messages with auto re-arming confirmation
(Alerts are limited to 9:00 AM – 4:00 PM Eastern Time)
• SuperCandles
: Highlights strong momentum moves with a stunning and easily recognizable glow effect.
• Color-Coded Candles & Background
: Candles reflect the current trigger condition, while the background tint tracks the most recent trend—enhancing situational awareness.
*All input settings include tooltips to guide users through setup and interpretation.
⚔️ Not Just Another Signal Tool
Xcalibur Signals & Alerts was built from the ground up to empower retail traders with access to a cohesive, structured algorithmic system—one that reflects the kind of awareness, discipline, and market adaptability found in professional-grade algorithms.
This is not another oversensitive or under-responsive signal indicator that is limited to one specific type of market condition or trader. It does not utilize hyperactive triggers, rely on lagging crossover logic, or need infinitely adjustable and complex sensitivity settings. Instead of cluttered visuals to interpret, this indicator delivers a simple, easy-to-use tool—prioritizing clarity and usability without compromising on depth and sophistication.
Whether the market is trending, breaking out, or moving sideways, Xcalibur adapts—prioritizing trend stability, directional integrity, and visual clarity from one signal to the next.
⚠️ While the Xcalibur Signals & Alerts algorithm is immune to human emotion, you are not. Be mindful not to fall victim to costly emotions that can manipulate your judgment, and understand the unpredictable and complex nature of trading. No algorithm, strategy, or technique can deliver perfect accuracy, and Xcalibur Signals & Alerts is no exception. While AlgoXcalibur strives to be as accurate as possible, incorrect signals can and will occur. Xcalibur Signals & Alerts is a tool, not a guarantee. Users are fully responsible for making their own trading decisions, implementing proper risk management, and always trading responsibly.
🛡️ Wield Xcalibur as a standalone weapon or use it alongside other tools.
🔐 To get access or learn more, visit the Author’s Instructions section.

LANZ Strategy 1.0🔷 LANZ Strategy 1.0 — Session-Based Directional Logic with Visual Multi-Account Risk Management
LANZ Strategy 1.0 is a structured and disciplined trading strategy designed for the 1-hour timeframe, operating during the NY session and executing trades overnight. It uses the directional behavior between 08:00 and 18:00 New York time to define precise limit entries for the following night. Ideal for traders who prefer time-based execution, clear visuals, and professional risk management across multiple accounts.
🧠 Core Components:
1. Session Direction Confirmation:
At 18:00 NY, the system evaluates the market direction by comparing the open at 08:00 vs the close at 18:00:
If the direction matches the previous day, it is reversed.
If it differs, the current day’s direction is kept.
This logic is designed to avoid trend exhaustion and favor potential reversal opportunities.
2. EP Level & Risk Definition:
Once direction is defined:
For BUY, EP is set at the Low of the session.
For SELL, EP is set at the High of the session.
The system automatically plots:
SL fixed at 18 pips from EP
TP at 3.00× the risk → 54 pips from EP
All levels (EP, SL, TP) are shown with visual lines and price labels.
3. Time-Restricted Entry Execution:
The entry is only valid if price touches the EP between 19:00 and 08:00 NY.
If EP is not touched before 08:00 NY, the trade is automatically cancelled.
4. Multi-Account Lot Sizing:
Traders can configure up to five different accounts, each with its own capital and risk percentage.
The system calculates and displays the lot size per account, based on SL distance and pip value, in a dynamic floating label.
5. Outcome Tracking:
If TP is hit, a +3.00% profit label is displayed along with a congratulatory alert.
If SL is hit, a -1.00% label appears with a loss alert.
If the trade is still open by 09:00 NY, it is manually closed, and the result is shown as a percentage of the initial risk.
📊 Visual Features:
Custom-colored angle and guide lines.
Dynamic angle line starts at 08:00 NY and tracks price until 18:00.
Shaded backgrounds for key time zones (e.g., 08:00, 18:00, 19:00).
BUY/SELL signals shown at 19:00 based on match/divergence logic.
Label panel showing risk metrics and lot size for each active account.
⚙️ How It Works:
08:00 NY: Marks the session open and initiates a dynamic angle line.
18:00 NY: Evaluates the session direction and calculates EP/SL/TP based on outcome.
19:00 NY: Activates limit order monitoring.
During the night (until 08:00 NY): If EP is touched, the trade is triggered.
At 08:00 NY: If no touch occurred, trade is cancelled.
Overnight: TP/SL logic is enforced, showing percentage outcomes.
At 09:00 NY: If still open, trade is closed manually and result is labeled visually.
🔔 Alerts:
🚀 EP execution alert when touched
💢 Stop Loss hit alert
⚡ Take Profit hit alert
✅ Manual close at 09:00 NY with performance result
🔔 Daily reminder at 19:00 NY to configure and prepare the trade
📝 Notes:
Strategy is exclusive to the 1-hour timeframe.
Works best on assets with clean NY session movement.
Perfect for structured, semi-automated swing/overnight trading styles.
Fully visual, self-explanatory, and backtest-friendly.
👨💻 Credits:
Developed by LANZ
A strategy created with precision, discipline, and a vision for traders who value time-based entries, clean execution logic, and visual confidence on the chart.
Special thanks to Kairos — your AI assistant — for the detailed structure, scripting, and documentation of the strategy.
CAGR + Log Slope ColorThis custom TradingView indicator combines two important analytical concepts to help traders identify strong trends with visual clarity:
CAGR (Compound Annual Growth Rate):
Measures the geometric average annual return of the asset over a specified period. It smooths out short-term fluctuations and provides a long-term growth perspective.
Logarithmic Slope Coloring:
The slope of the log-scaled price is calculated and visualized with color gradients. Steeper upward slopes indicate stronger momentum and are highlighted with more intense colors. Downward slopes are shown in contrasting colors for easier identification of bearish trends.
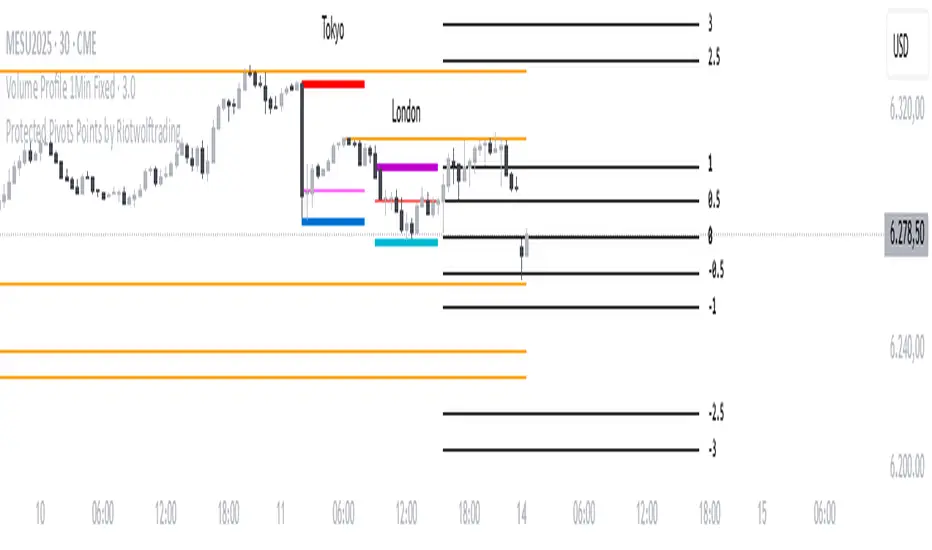
Protected Pivots Points by RiotwolftradingProtected Pivots Points by Riotwolftrading
---
You have an advanced visual tool designed for traders who want to identify and manage key price levels with maximum precision.
This script detects protected pivots (significant highs and lows) and marks them with horizontal lines on the chart. These lines automatically extend for a fixed number of bars or until price invalidates the level with a closing break.
---
🚀 What makes this indicator special?
---
✅ Protected pivot detection:
The indicator identifies protected highs and lows using a fixed pivot strength
✅ Wick break detection (liquidity sweep visualization):
When a wick crosses the pivot level **without the candle closing beyond the level, the indicator automatically changes the line’s color and style.
👉 This immediately shows the trader that the level was tested but remains structurally valid.
✅ Highly customizable visuals:
* Choose whether to show color for protected highs, lows, or wick break levels.
* Set your own colors, line styles (solid, dashed, dotted), and line widths.
---
### 🌟 Why is wick break detection so valuable?
---
💡 Instant context on price action:
No need to manually check every candle to see if a level was barely tested. The indicator changes the line’s appearance automatically, so you can focus on decisions.
💡 Clear distinction between untouched levels and tested levels:
* A level with no wick test is pristine support/resistance.
* A level tested by a wick but not invalidated is still valid — but may have been swept for liquidity.
💡 Crucial for precision trading strategies:
This is particularly important for strategies that rely on:
✅ Liquidity sweeps / stop hunts.
✅ Reversals from tested zones.
✅ Smart Money Concepts (SMC).
✅ ICT concepts, breakers, Quasimodo, BOS/MSS.
The wick break visualization helps filter false breakouts and highlights areas where institutional players may have stepped in.
💡 Avoid premature exits or entries:**
The color/style change tells you a level was tested but not broken, so you avoid overreacting to wick activity.
---
### ⚡ Example use case**
Imagine a protected low line:
🔹 Price dips and its wick touches the level — the line changes color (e.g. violet solid line).
🔹 The level is still valid because the close didn’t break it.
🔹 This could signal a stop hunt or liquidity grab, with a possible reversal opportunity right at that level.
---
### 🧭 **Why most pivot indicators don’t offer this**
Most pivot indicators:
❌ Simply mark the level and remove it after a close break.
❌ Don’t distinguish between a wick test and a true break.
🌟 **This indicator does — giving traders an extra layer of market insight.**
---
### ⚠ **Disclaimer**
This indicator is a visual aid to help identify key levels and price reactions. It does **not** generate buy or sell signals and should be used alongside your trading analysis and strategy.
---
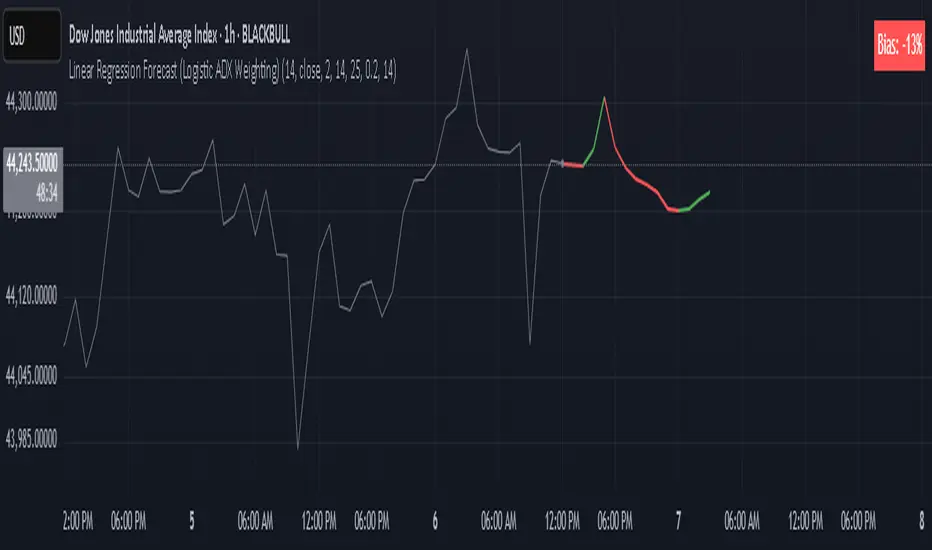
Linear Regression Forecast (ADX Adaptive)Linear Regression Forecast (ADX Adaptive)
This indicator is a dynamic price projection tool that combines multiple linear regression forecasts into a single, adaptive forecast curve. By integrating trend strength via the ADX and directional bias, it aims to visualize how price might evolve in different market environments—from strong trends to mean-reverting conditions.
Core Concept:
This tool builds forward price projections based on a blend of linear regression models with varying lookback lengths (from 2 up to a user-defined max). It then adjusts those projections using two key mechanisms:
ADX-Weighted Forecast Blending
In trending conditions (high ADX), the model follows the raw forecast direction. In ranging markets (low ADX), the forecast flips or reverts, biasing toward mean-reversion. A logistic transformation of directional bias, controlled by a steepness parameter, determines how aggressively this blending reacts to price behavior.
Volatility Scaling
The forecast’s magnitude is scaled based on ADX and directional conviction. When trends are unclear (low ADX or neutral bias), the projection range expands to reflect greater uncertainty and volatility.
How It Works:
Regression Curve Generation
For each regression length from 2 to maxLength, a forward projection is calculated using least-squares linear regression on the selected price source. These forecasts are extrapolated into the future.
Directional Bias Calculation
The forecasted points are analyzed to determine a normalized bias value in the range -1 to +1, where +1 means strongly bullish, -1 means strongly bearish, and 0 means neutral.
Logistic Bias Transformation
The raw bias is passed through a logistic sigmoid function, with a user-defined steepness. This creates a probability-like weight that favors either following or reversing the forecast depending on market context.
ADX-Based Weighting
ADX determines the weighting between trend-following and mean-reversion modes. Below ADX 20, the model favors mean-reversion. Above 25, it favors trend-following. Between 20 and 25, it linearly blends the two.
Blended Forecast Curve
Each forecast point is blended between trend-following and mean-reverting values, scaled for volatility.
What You See:
Forecast Lines: Projected future price paths drawn in green or red depending on direction.
Bias Plot: A separate plot showing post-blend directional bias as a percentage, where +100 is strongly bullish and -100 is strongly bearish.
Neutral Line: A dashed horizontal line at 0 percent bias to indicate neutrality.
User Inputs:
-Max Regression Length
-Price Source
-Line Width
-Bias Steepness
-ADX Length and Smoothing
Use Cases:
Visualize expected price direction under different trend conditions
Adjust trading behavior depending on trending vs ranging markets
Combine with other tools for deeper analysis
Important Notes:
This indicator is for visualization and analysis only. It does not provide buy or sell signals and should not be used in isolation. It makes assumptions based on historical price action and should be interpreted with market context.
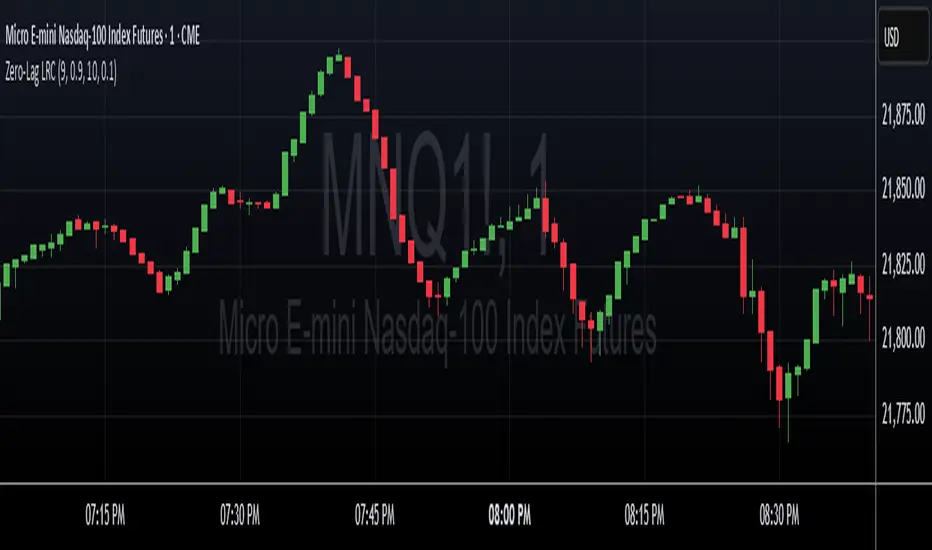
Zero-Lag Linear Regression Candles🚀 Zero-Lag Linear Regression Candles
📊 What It Does
The Zero-Lag Linear Regression Candles change traditional candlestick analysis by creating smoothed, predictive candles that eliminate the lag inherent in standard linear regression methods. Instead of waiting for price confirmation, this indicator anticipates market movements using advanced mathematical modeling.
🎯 Key Features
Tri-Layer Super Responsive System
Layer 1: Weighted Linear Regression with exponential decay weighting
Layer 2: Zero-lag correction algorithm that projects future price direction
Layer 3: Adaptive intelligence that adjusts to current market volatility and momentum
Smart Market Adaptation
Automatically adjusts sensitivity based on market volatility (ATR)
Responds to momentum changes in real-time
Filters out market noise while preserving important signals
Customizable
Regression Length: Fine-tune responsiveness (2-50 periods)
Weight Decay Factor: Control how much emphasis to place on recent vs. historical data
Zero-Lag Periods: Adjust the aggressiveness of lag elimination
Adaptive Factor: Set market adaptation strength
🛠️ Usage Instructions
1. Add to Chart: Apply the indicator to any timeframe
2. Configure Settings: Adjust regression length and sensitivity to match your trading style
3. Interpret Signals:
- Green Candles: Bullish linear regression trend
- Red Candles: Bearish linear regression trend
Created by B3AR_Trades
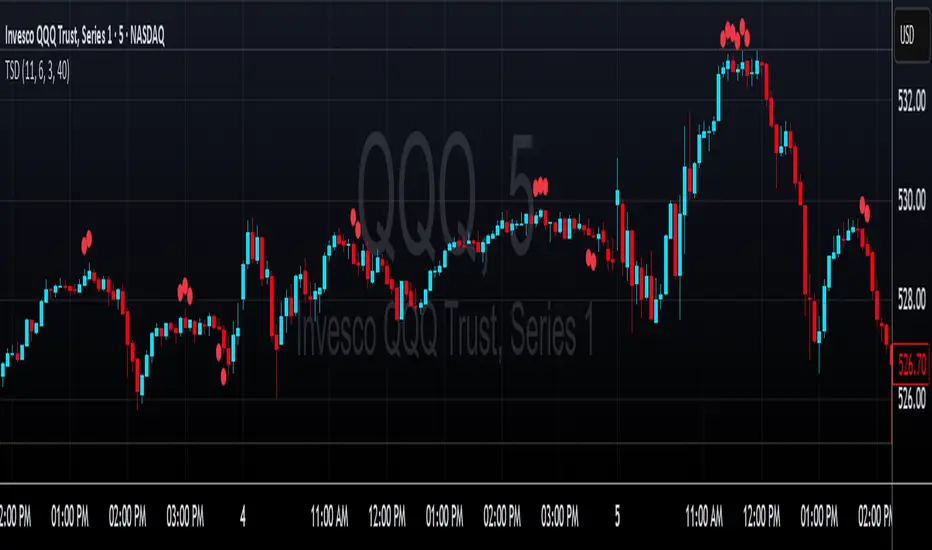
LRHA Trend Shift DetectorLRHA Trend Shift Detector (TSD)
The LRHA Trend Shift Detector is an advanced momentum exhaustion indicator that identifies potential trend reversals and changes by analyzing Linear Regression Heikin Ashi (LRHA) candle patterns. TSD focuses on detecting when strong directional moves begin to lose momentum.
🔬 Methodology
The indicator employs a three-stage detection process:
LRHA Calculation: Applies linear regression smoothing to Heikin Ashi candles, creating ultra-smooth trend-following candles that filter out market noise
Extended Move Detection: Identifies sustained directional moves by counting consecutive bullish or bearish LRHA candles
Momentum Exhaustion Analysis: Monitors for significant changes in candle size compared to recent averages
When an extended move shows clear signs of momentum exhaustion, the indicator signals a potential trend shift with red dots plotted above or below your candlesticks.
⚙️ Parameters
Core Settings
LRHA Length (11): Linear regression period for smoothing calculations. Lower values = more responsive, higher values = smoother trends.
Minimum Trend Bars (4): Consecutive candles required to establish an "extended move." Higher number detects longer term trend changes.
Exhaustion Bars (3): Number of consecutively smaller candles needed to signal exhaustion. Lower is more sensitive.
Size Reduction Threshold (40%): Percentage decrease in candle size to qualify as "exhaustion." Lower is more sensitive.
Trend Trading
Pullback Entries: Identify exhaustion in counter-trend moves for trend continuation
Exit Strategy: Recognize when main trend momentum is fading
Position Sizing: Reduce size when seeing exhaustion in your direction
🎛️ Optimization Tips
For More Signals (Aggressive)
- Decrease LRHA Length (7-9)
- Reduce Minimum Trend Bars (2-3)
- Lower Size Reduction Threshold (25-35%)
For Higher Quality (Conservative)
- Increase LRHA Length (13-18)
- Raise Minimum Trend Bars (5-6)
- Higher Size Reduction Threshold (45-55%)
⚠️ Important Notes⚠️
- **Not a Complete Strategy**: Use as confluence with other analysis methods
- **Market Context Matters**: Consider overall trend direction and key support/resistance levels
- **Risk Management Essential**: Always use proper position sizing and stop losses
- **Backtest First**: Optimize parameters for your specific trading style and instruments
Oculus Ultra Parallel S/R Channel**Oculus Ultra Parallel S/R Channel**
*Version 1.0 | Pine Script v6*
**Overview**
This indicator overlays a statistically-driven support/resistance channel on your chart by fitting a linear regression (median) line and plotting parallel bands at a configurable multiple of standard deviation. It adapts dynamically to both trend and volatility, highlights potential reaction zones, and offers optional alerts when price touches key levels.
**Key Features**
* **Median Regression Line**
Fits a best-fit line through the chosen lookback of price data, showing the underlying trend.
* **Volatility-Based Bands**
Upper and lower bands offset by *N*× standard deviation of regression residuals, capturing dynamic S/R zones.
* **Dynamic Coloring**
* Median line turns **teal** when sloping up, **orange** when sloping down.
* Bands tinted green or red depending on their position relative to the median.
* **Channel Fill**
Optional shaded area between the bands for immediate visual context.
* **Touch Alerts**
Precision alerts and on-chart markers when price touches the support or resistance band, with configurable tick tolerance.
* **Clean Layout**
Minimal lines and plots to avoid chart clutter, adjustable via toggle inputs.
**How to Use**
1. **Apply the Script** – Add to any timeframe in overlay mode.
2. **Configure Inputs** –
* **Channel Length**: Number of bars for regression and volatility calculation.
* **Deviation Factor**: Multiplier for band width (in standard deviations).
* **Show/Hide Elements**: Toggle median line, bands, fill, and touch alerts.
* **Color by Slope**: Enable slope-based median coloring.
* **Touch Tolerance**: Number of ticks within which a band touch is registered.
3. **Interpret the Channel** –
* **Trend**: Follow the slope and color of the median line.
* **Support/Resistance**: Bands represent dynamic zones where price often reacts.
* **Alerts**: Use touch markers or alert pop-ups to time entries or exits at band levels.
**Inputs**
* **Channel Length** (default: 100)
* **Deviation Factor** (default: 1.0)
* **Show Median Regression Line** (true/false)
* **Show Channel Bands** (true/false)
* **Fill Between Bands** (true/false)
* **Color Median by Slope** (true/false)
* **Alert on Band Touch** (true/false)
* **Touch Tolerance (ticks)** (default: 2)
**Version History**
* **1.0** – Initial release with dynamic regression channel, slope coloring, band fill, and touch alerts.
**Disclaimer**
This indicator is intended for educational purposes. Always backtest with your own settings and apply sound risk management before trading live.

VWAP Supply & Demand Zones PRO**Overview:**
This script represents a major evolution of the original "VWAP Supply and Demand Zones" indicator. Initially created to explore price interaction with VWAP, it has now matured into a robust and feature-rich tool for identifying high-probability zones of institutional buying and selling pressure. The update introduces volume and momentum validation, dynamic zone management, alert logic, and a visual dashboard (HUD) — all designed for improved precision and clarity. The structural improvements, anti-repainting logic, and significant added utility warranted releasing this as a new script rather than a minor update.
---
### What It Does:
This indicator dynamically detects **supply and demand zones** using VWAP-based logic combined with **volume** and **momentum confirmation**. When price crosses VWAP with strength, it identifies the potential zone of excess demand (below VWAP) or supply (above VWAP), marking it visually with colored regions on the chart.
Each zone is extended for a user-defined duration, monitored for touch interactions (tests), and tracked for possible breaks. The script helps traders interpret price behavior around these institutional zones as either **reversal** opportunities or **continuation** confirmation depending on context and strategy preference.
---
### How It Works:
* **VWAP Basis**: Zones are anchored at VWAP at the time of a significant cross.
* **Volume & Momentum Filters**: Crosses are only considered valid if backed by above-average volume and notable price momentum.
* **Zone Drawing**: Validated supply and demand zones are drawn as boxes on the chart. Each is extended forward for a customizable number of bars.
* **Touch Counting**: Zones track the number of price touches. Alerts are issued after a user-defined number of tests.
* **Break Detection**: If price closes significantly beyond a zone boundary, the zone is marked as broken and visually dimmed.
* **Visual Dashboard (HUD)**: A compact real-time HUD displays VWAP value, active zone counts, and current market bias.
---
### How to Use It:
**Reversal Trading:**
* Look for price **rejecting** a zone after touching it.
* Use rejection candles or secondary indicators (e.g., RSI divergence) to confirm.
* These setups may offer low-risk entries when price respects the zone.
**Continuation Trading:**
* A **break of a zone** suggests strong directional bias.
* Use confirmed zone breaks to enter in the direction of momentum.
* Ideal in trending environments, especially with high volume and ATR movement.
---
### Key Inputs:
* **VWAP Length**: Moving VWAP period (default: 20)
* **Zone Width %**: Percentage size of zone buffer (default: 0.5%)
* **Min Touches**: How many times price must test a zone before alerts trigger
* **Zone Extension**: How far into the future zones are projected
* **Volume & ATR Filters**: Ensure only strong, valid crossovers create zones
---
### Alerts:
You can enable alerts for:
* **New zone creation**
* **Zone tests (after minimum touch count)**
* **Zone breaks**
* **VWAP crosses**
* **Active presence inside a zone (entry conditions)**
These alerts help automate market monitoring, making it suitable for discretionary or systematic workflows.
---
### Why It's a New Script:
This is not a cosmetic update. The internal logic, signal generation, filtering methodology, visual engine, and UX framework have been entirely rebuilt from the ground up. The result is a highly adaptive, precision-oriented tool — appropriate for intraday scalpers and swing traders alike. It goes far beyond the original in terms of functionality and reliability, justifying a fresh release.
---
### Suitable Markets and Timeframes:
* Works across all liquid markets (crypto, equities, futures, forex)
* Best used on timeframes where volume data is stable (5m and above recommended)
* Recalibrate inputs for optimal detection across instruments

Wavelet Filter with Adaptive Upsampling [BackQuant]Wavelet Filter with Adaptive Upsampling
The Wavelet Filter with Adaptive Upsampling is an advanced filtering and signal reconstruction tool designed to enhance the analysis of financial time series data. It combines wavelet transforms with adaptive upsampling techniques to filter and reconstruct price data, making it ideal for capturing subtle market movements and enhancing trend detection. This system uses high-pass and low-pass filters to decompose the price series into different frequency components, applying adaptive thresholding to eliminate noise and preserve relevant signal information.
Shout out to Loxx for the Least Squares fitting of trigonometric series and Quinn and Fernandes algorithm for finding frequency
www.tradingview.com
Key Features
1. Frequency Decomposition with High-Pass and Low-Pass Filters:
The indicator decomposes the input time series using high-pass and low-pass filters to separate the high-frequency (detail) and low-frequency (trend) components of the data. This decomposition allows for a more accurate analysis of underlying trends, while mitigating the impact of noise.
2. Soft Thresholding for Noise Reduction:
A soft thresholding function is applied to the high-frequency component, allowing for the reduction of noise while retaining significant market signals. This function adjusts the coefficients of the high-frequency data, removing small fluctuations and leaving only the essential price movements.
3. Adaptive Upsampling Process:
The upsampling process in this script can be customized using different methods: sinusoidal upsampling, advanced upsampling, and simple upsampling. Each method serves a unique purpose:
Sinusoidal Upsample uses a sine wave to interpolate between data points, providing a smooth transition.
Advanced Upsample utilizes a Quinn-Fernandes algorithm to estimate frequency and apply more sophisticated interpolation techniques, adapting to the market’s cyclical behavior.
Simple Upsample linearly interpolates between data points, providing a basic upsampling technique for less complex analysis.
4. Reconstruction of Filtered Signal:
The indicator reconstructs the filtered signal by summing the high and low-frequency components after upsampling. This allows for a detailed yet smooth representation of the original time series, which can be used for analyzing underlying trends in the market.
5. Visualization of Reconstructed Data:
The reconstructed series is plotted, showing how the upsampling and filtering process enhances the clarity of the price movements. Additionally, the script provides the option to visualize the log returns of the reconstructed series as a histogram, with positive returns shown in green and negative returns in red.
6. Cumulative Series and Trend Detection:
A cumulative series is plotted to visualize the compounded effect of the filtered and reconstructed data. This feature helps traders track the overall performance of the asset over time, identifying whether the asset is following a sustained upward or downward trend.
7. Adaptive Thresholding and Noise Estimation:
The system estimates the noise level in the high-frequency component and applies an adaptive thresholding process based on the standard deviation of the downsampled data. This ensures that only significant price movements are retained, further refining the trend analysis.
8. Customizable Parameters for Flexibility:
Users can customize the following parameters to adjust the behavior of the indicator:
Frequency and Phase Shift: Control the periodicity of the wavelet transformation and the phase of the upsampling function.
Upsample Factor: Adjust the level of interpolation applied during the upsampling process.
Smoothing Period: Determine the length of time used to smooth the signal, helping to filter out short-term fluctuations.
References
Enhancing Cross-Sectional Currency Strategies with Context-Aware Learning to Rank
arxiv.org
Daubechies Wavelet - Wikipedia
en.wikipedia.org
Quinn Fernandes Fourier Transform of Filtered Price by Loxx
Note on Usage for Mean-Reversion Strategy
This indicator is primarily designed for trend-following strategies. However, by taking the inverse of the signals, it can be adapted for mean-reversion strategies. This involves buying underperforming assets and selling outperforming ones. Caution: This method may not work effectively with highly correlated assets, as the price movements between correlated assets tend to mirror each other, limiting the effectiveness of mean-reversion strategies.
Final Thoughts
The Wavelet Filter with Adaptive Upsampling is a powerful tool for traders seeking to improve their understanding of market trends and noise. By using advanced wavelet decomposition and adaptive upsampling, this system offers a clearer, more refined picture of price movements, enhancing trend-following strategies. It’s particularly useful for detecting subtle shifts in market momentum and reconstructing price data in a way that removes noise, providing more accurate insights into market conditions.

Fair Value Trend Model [SiDec]ABSTRACT
This pine script introduces the Fair Value Trend Model, an on-chart indicator for TradingView that constructs a continuously updating "fair-value" estimate of an asset's price via a logarithmic regression on historical data. Specifically, this model has been applied to Bitcoin (BTC) to fully grasp its fair value in the cryptocurrency market. Symmetric channel bands, defined by fixed percentage offsets around this central fair-value curve, provide a visual band within which normal price fluctuations may occur. Additionally, a short-term projection extends both the fair-value trend and its channel bands forward by a user-specified number of bars.
INTRODUCTION
Technical analysts frequently seek to identify an underlying equilibrium or "fair value" about which prices oscillate. Traditional approaches-moving averages, linear regressions in price-time space, or midlines-capture linear trends but often misrepresent the exponential or power-law growth patterns observable in many financial markets. The Fair Value Trend Model addresses this by performing an ordinary least squares (OLS) regression in log-space, fitting ln(Price) against ln(Days since inception). In practice, the primary application has been to Bitcoin, aiming to fully capture Bitcoin's underlying value dynamics.
The result is a curved trend line in regular (price-time) coordinates, reflecting Bitcoin's long-term compounding characteristics. Surrounding this fair-value curve, symmetric bands at user-specified percentage deviations serve as dynamic support and resistance levels. A simple linear projection extends both the central fair-value and its bands into the immediate future, providing traders with a heuristic for short-term trend continuation.
This exposition details:
Data transformation: converting bar timestamps into days since first bar, then applying natural logarithms to both time and price.
Regression mechanics: incremental (or rolling-window) accumulation of sums to compute the log-space fit parameters.
Fair-value reconstruction: exponentiation of the regression output to yield a price-space estimate.
Channel-band definition: establishing ±X% offsets around the fair-value curve and rendering them visually.
Forecasting methodology: projecting both the fair-value trend and channel bands by extrapolating the most recent incremental change in price-space.
Interpretation: how traders can leverage this model for trend identification, mean-reversion setups, and breakout analysis, particularly in Bitcoin trading.
Analysing the macro cycle on Bitcoin's monthly timeframe illustrates how the fair-value curve aligns with multi-year structural turning points.
DATA TRANSFORMATION AND NOTATION
1. Timestamp Baseline (t0)
Let t0 = timestamp of the very first bar on the chart (in milliseconds). Each subsequent bar has a timestamp ti, where ti ≥ t0.
2. Days Since Inception (d(t))
Define the “days since first bar” as
d(t) = max(1, (t − t0) / 86400000.0)
Here, 86400000.0 represents the number of milliseconds in one day (1,000 ms × 60 seconds × 60 minutes × 24 hours). The lower bound of 1 ensures that we never compute ln(0).
3. Logarithmic Coordinates:
Given the bar’s closing price P(t), define:
xi = ln( d(ti) )
yi = ln( P(ti) )
Thus, each data point is transformed to (xi, yi) in log‐space.
REGRESSION FORMULATION
We assume a log‐linear relationship:
yi = a + b·xi + εi
where εi is the residual error at bar i. Ordinary least squares (OLS) fitting minimizes the sum of squared residuals over N data points. Define the following accumulated sums:
Sx = Σ for i = 1 to N
Sy = Σ for i = 1 to N
Sxy = Σ for i = 1 to N
Sx2 = Σ for i = 1 to N
N = number of data points
The OLS estimates for b (slope) and a (intercept) are:
b = ( N·Sxy − Sx·Sy ) / ( N·Sx2 − (Sx)^2 )
a = ( Sy − b·Sx ) / N
All‐Time Versus Rolling‐Window Mode:
All-Time Mode:
Each new bar increments N by 1.
Update Sx ← Sx + xN, Sy ← Sy + yN, Sxy ← Sxy + xN·yN, Sx2 ← Sx2 + xN^2.
Recompute a and b using the formulas above on the entire dataset.
Rolling-Window Mode:
Fix a window length W. Maintain two arrays holding the most recent W values of {xi} and {yi}.
On each new bar N:
Append (xN, yN) to the arrays; add xN, yN, xN·yN, xN^2 to the sums Sx, Sy, Sxy, Sx2.
If the arrays’ length exceeds W, remove the oldest point (xN−W, yN−W) and subtract its contributions from the sums.
Update N_roll = min(N, W).
Compute b and a using N_roll, Sx, Sy, Sxy, Sx2 as above.
This incremental approach requires only O(1) operations per bar instead of recomputing sums from scratch, making it computationally efficient for long time series.
FAIR‐VALUE RECONSTRUCTION
Once coefficients (a, b) are obtained, the regressed log‐price at time t is:
ŷ(t) = a + b·ln( d(t) )
Mapping back to price space yields the “fair‐value”:
F(t) = exp( ŷ(t) )
= exp( a + b·ln( d(t) ) )
= exp(a) · ^b
In other words, F(t) is a power‐law function of “days since inception,” with exponent b and scale factor C = exp(a). Special cases:
If b = 1, F(t) = C · d(t), which is an exponential function in original time.
If b > 1, the fair‐value grows super‐linearly (accelerating compounding).
If 0 < b < 1, it grows sub‐linearly.
If b < 0, the fair‐value declines over time.
CHANNEL‐BAND DEFINITION
To visualise a “normal” range around the fair‐value curve F(t), we define two channel bands at fixed percentage offsets:
1. Upper Channel Band
U(t) = F(t) · (1 + α_upper)
where α_upper = (Channel Band Upper %) / 100.
2. Lower Channel Band
L(t) = F(t) · (1 − α_lower)
where α_lower = (Channel Band Lower %) / 100.
For example, default values of 50% imply α_upper = α_lower = 0.50, so:
U(t) = 1.50 · F(t)
L(t) = 0.50 · F(t)
When “Show FV Channel Bands” is enabled, both U(t) and L(t) are plotted in a neutral grey, and a semi‐transparent fill is drawn between them to emphasise the channel region.
SHORT‐TERM FORECAST PROJECTION
To extend both the fair‐value and its channel bands M bars into the future, the model uses a simple constant‐increment extrapolation in price space. The procedure is:
1. Compute Recent Increments
Let
F_prev = F( t_{N−1} )
F_curr = F( t_N )
Then define the per‐bar change in fair‐value:
ΔF = F_curr − F_prev
Similarly, for channel bands:
U_prev = U( t_{N−1} ), U_curr = U( t_N ), ΔU = U_curr − U_prev
L_prev = L( t_{N−1} ), L_curr = L( t_N ), ΔL = L_curr − L_prev
2. Forecasted Values After M Bars
Assuming the same per‐bar increments continue:
F_future = F_curr + M · ΔF
U_future = U_curr + M · ΔU
L_future = L_curr + M · ΔL
These forecasted values produce dashed lines on the chart:
A dashed segment from (bar_N, F_curr) to (bar_{N+M}, F_future).
Dashed segments from (bar_N, U_curr) to (bar_{N+M}, U_future), and from (bar_N, L_curr) to (bar_{N+M}, L_future).
Forecasted channel bands are rendered in a subdued grey to distinguish them from the current solid bands. Because this method does not re‐estimate regression coefficients for future t > t_N, it serves as a quick visual heuristic of trend continuation rather than a precise statistical forecast.
MATHEMATICAL SUMMARY
Summarising all key formulas:
1. Days Since Inception
d(t_i) = max( 1, ( t_i − t0 ) / 86400000.0 )
x_i = ln( d(t_i) )
y_i = ln( P(t_i) )
2. Regression Summations (for i = 1..N)
Sx = Σ
Sy = Σ
Sxy = Σ
Sx2 = Σ
N = number of data points (or N_roll if using rolling‐window)
3. OLS Estimator
b = ( N · Sxy − Sx · Sy ) / ( N · Sx2 − (Sx)^2 )
a = ( Sy − b · Sx ) / N
4. Fair‐Value Computation
ŷ(t) = a + b · ln( d(t) )
F(t) = exp( ŷ(t) ) = exp(a) · ^b
5. Channel Bands
U(t) = F(t) · (1 + α_upper)
L(t) = F(t) · (1 − α_lower)
with α_upper = (Channel Band Upper %) / 100, α_lower = (Channel Band Lower %) / 100.
6. Forecast Projection
ΔF = F_curr − F_prev
F_future = F_curr + M · ΔF
ΔU = U_curr − U_prev
U_future = U_curr + M · ΔU
ΔL = L_curr − L_prev
L_future = L_curr + M · ΔL
IMPLEMENTATION CONSIDERATIONS
1. Time Precision
Timestamps are recorded in milliseconds. Dividing by 86400000.0 yields days with fractional precision.
For the very first bar, d(t) = 1 ensures x = ln(1) = 0, avoiding an undefined logarithm.
2. Incremental Versus Sliding Summation
All‐Time Mode: Uses persistent scalar variables (Sx, Sy, Sxy, Sx2, N). On each new bar, add the latest x and y contributions to the sums.
Rolling‐Window Mode: Employs fixed‐length arrays for {x_i} and {y_i}. On each bar, append (x_N, y_N) and update sums; if array length exceeds W, remove the oldest element and subtract its contribution from the sums. This maintains exact sums over the most recent W data points without recomputing from scratch.
3. Numerical Robustness
If the denominator N·Sx2 − (Sx)^2 equals zero (e.g., all x_i identical, as when only one day has passed), then set b = 0 and a = Sy / N. This produces a constant fair‐value F(t) = exp(a).
Enforcing d(t) ≥ 1 avoids attempts to compute ln(0).
4. Plotting Strategy
The fair‐value line F(t) is plotted on each new bar. Its color depends on whether the current price P(t) is above or below F(t): a “bullish” color (e.g., green) when P(t) ≥ F(t), and a “bearish” color (e.g., red) when P(t) < F(t).
The channel bands U(t) and L(t) are plotted in a neutral grey when enabled; otherwise they are set to “not available” (no plot).
A semi‐transparent fill is drawn between U(t) and L(t). Because the fill function is executed at global scope, it is automatically suppressed if either U(t) or L(t) is not plotted (na).
5. Forecast Line Management
Each projection line (for F, U, and L) is created via a persistent line object. On successive bars, the code updates the endpoints of the same line rather than creating a new one each time, preserving chart clarity.
If forecasting is disabled, any existing projection lines are deleted to avoid cluttering the chart.
INTERPRETATION AND APPLICATIONS
1. Trend Identification
The fair‐value curve F(t) represents the best‐fit long‐term trend under the assumption that ln(Price) scales linearly with ln(Days since inception). By capturing power‐law or exponential patterns, it can more accurately reflect underlying compounding behavior than simple linear regressions.
When actual price P(t) lies above U(t), it may be considered “overextended” relative to its long‐term trend; when price falls below L(t), it may be deemed “oversold.” These conditions can signal potential mean‐reversion or breakout opportunities.
2. Mean‐Reversion and Breakout Signals
If price re‐enters the channel after touching or slightly breaching L(t), some traders interpret this as a mean‐reversion bounce and consider initiating a long position.
Conversely, a sustained move above U(t) can indicate strong upward momentum and a possible bullish breakout. Traders often seek confirmation (e.g., price remaining above U(t) for multiple bars, rising volume, or corroborating momentum indicators) before acting.
3. Rolling Versus All‐Time Usage
All‐Time Mode: Captures the entire dataset since inception, focusing on structural, long‐term trends. It is less sensitive to short‐term noise or volatility spikes.
Rolling‐Window Mode: Restricts the regression to the most recent W bars, making the fair‐value curve more responsive to changing market regimes, sudden volatility expansions, or fundamental shifts. Traders who wish to align the model with local behaviour often choose W so that it approximates a market cycle length (e.g., 100–200 bars on a daily chart).
4. Channel Percentage Selection
A wider band (e.g., ±50 %) accommodates larger price swings, reducing the frequency of breaches but potentially delaying actionable signals.
A narrower band (e.g., ±10 %) yields more frequent “overbought/oversold” alerts but may produce more false signals during normal volatility. It is advisable to calibrate the channel width to the asset’s historical volatility regime.
5. Forecast Cautions
The short‐term projection assumes that the last single‐bar increment ΔF remains constant for M bars. In reality, trend acceleration or deceleration can occur, rendering the linear forecast inaccurate.
As such, the forecast serves as a visual guide rather than a statistically rigorous prediction. It is best used in conjunction with other momentum, volume, or volatility indicators to confirm trend continuation or reversal.
LIMITATIONS AND CONSIDERATIONS
1. Power‐Law Assumption
By fitting ln(P) against ln(d), the model posits that P(t) ≈ C · ^b. Real markets may deviate from a pure power‐law, especially around significant news events or structural regime changes. Temporary misalignment can occur.
2. Fixed Channel Width
Markets exhibit heteroskedasticity: volatility can expand or contract unpredictably. A static ±X % band does not adapt to changing volatility. During high‐volatility periods, a fixed ±50 % may prove too narrow and be breached frequently; in unusually calm periods, it may be excessively broad, masking meaningful variations.
3. Endpoint Sensitivity
Regression‐based indicators often display greater curvature near the most recent data, especially under rolling‐window mode. This can create sudden “jumps” in F(t) when new bars arrive, potentially confusing users who expect smoother behaviour.
4. Forecast Simplification
The projection does not re‐estimate regression slope b for future times. It only extends the most recent single‐bar change. Consequently, it should be regarded as an indicative extension rather than a precise forecast.
PRACTICAL IMPLEMENTATION ON TRADINGVIEW
1 Adding the Indicator
In TradingView’s “Indicators” dialog, search for Fair Value Trend Model or visit my profile, under "scripts" add it to your chart.
Add it to any chart (e.g., BTCUSD, AAPL, EURUSD) to see real‐time computation.
2. Configuring Inputs
Show Forecast Line: Toggle on or off the dashed projection of the fair‐value.
Forecast Bars: Choose M, the number of bars to extend into the future (default is often 30).
Forecast Line Colour: Select a high‐contrast colour (e.g., yellow).
Bullish FV Colour / Bearish FV Colour: Define the colour of the fair‐value line when price is above (e.g., green) or below it (e.g., red).
Show FV Channel Bands: Enable to display the grey channel bands around the fair‐value.
Channel Band Upper % / Channel Band Lower %: Set α_upper and α_lower as desired (defaults of 50 % create a ±50 % envelope).
Use Rolling Window?: Choose whether to restrict the regression to recent data.
Window Bars: If rolling mode is enabled, designate W, the number of bars to include.
3. Visual Output
The central curve F(t) appears on the price chart, coloured green when P(t) ≥ F(t) and red when P(t) < F(t).
If channel bands are enabled, the chart shows two grey lines U(t) and L(t) and a subtle shading between them.
If forecasting is active, dashed extensions of F(t), U(t), and L(t) appear, projecting forward by M bars in neutral hues.
CONCLUSION
The Fair Value Trend Model furnishes traders with a mathematically principled estimate of an asset’s equilibrium price curve by fitting a log‐linear regression to historical data. Its channel bands delineate a normal corridor of fluctuation based on fixed percentage offsets, while an optional short‐term projection offers a visual approximation of trend continuation.
By operating in log‐space, the model effectively captures exponential or power‐law growth patterns that linear methods overlook. Rolling‐window capability enables responsiveness to regime shifts, whereas all‐time mode highlights broader structural trends. Nonetheless, users should remain mindful of the model’s assumptions—particularly the power‐law form and fixed band percentages—and employ the forecast projection as a supplemental guide rather than a standalone predictor.
When combined with complementary indicators (e.g., volatility measures, momentum oscillators, volume analysis) and robust risk management, the Fair Value Trend Model can enhance market timing, mean‐reversion identification, and breakout detection across diverse trading environments.
REFERENCES
Draper, N. R., & Smith, H. (1998). Applied Regression Analysis (3rd ed.). Wiley.
Tsay, R. S. (2014). Introductory Time Series with R (2nd ed.). Springer.
Hull, J. C. (2017). Options, Futures, and Other Derivatives (10th ed.). Pearson.
These references provide background on regression, time-series analysis, and financial modeling.

Curved Trend Channels (Zeiierman)█ Overview
Curved Trend Channels (Zeiierman) is a next-generation trend visualization tool engineered to adapt dynamically to both linear and non-linear market behavior. It introduces a novel curvature-based channeling system that grows over time during trending conditions, mirroring the natural acceleration of price trends, while simultaneously leveraging adaptive range filtering and dual-layer candle trend logic.
This tool is ideal for traders seeking smooth yet reactive dynamic channels that evolve with market structure. Whether used in curved mode or traditional slope mode, it provides exceptional clarity on trend transitions, volatility compression, and breakout development.
█ How It Works
⚪ Adaptive Range Filter Foundation
The core of the system is a volatility-based range filter that determines the underlying structure of the bands:
Pre-Smoothing of High/Low Data – Highs and lows are smoothed using a selectable moving average (SMA, EMA, HMA, KAMA, etc.) before calculating the volatility range.
Volatility Envelope – The range is scaled using a fixed factor (2.618) and further adjusted by a Band Multiplier to form the primary envelope around price.
Smoothed Volatility Curve – Final bands are stabilized using a long lookback, ensuring clean visual structure and trend clarity.
⚪ Curved Channel Logic
In Curved Mode, the trend channel grows over time when the trend direction remains unchanged:
Base Step Size (× ATR) – Sets the minimum unit of slope change.
Growth per Bar (× ATR) – Defines the acceleration rate of the channel slope with time.
Trend Persistence Recognition – The longer a trend persists, the more pronounced the slope becomes, mimicking real market accelerations.
This dynamic, time-dependent logic enables the channel to "curve" upward or downward, tracking long-standing trends with increasing confidence.
⚪ Trend Slope
As an alternative to curved logic, traders can activate a regular Trend slope using:
Slope Length – Determines how quickly the trend line adapts to price shifts.
Multiplicative Factor – Amplifies the sensitivity of the slope, useful in fast-moving markets or lower timeframes.
⚪ Candle Trend Confirmation
A robust second-layer trend detection method, the Candle Trend System evaluates directional pressure by analyzing smoothed price action:
Multi-tier Smoothing – Trend lines are derived from short-, medium-, and long-term candle movement.
█ How to Use
⚪ Trend Identification
When the Trend Line direction and Candle Colors are in agreement, this indicates strong, persistent directional conviction. Use these moments to enter with trend confirmation and manage risk more confidently.
⚪ Retest
During ongoing trends, the price will often pull back into the dynamic channel. Look for:
Support/resistance interactions at the upper or lower bands.
█ Settings
Scaled Volatility Length – Controls the historical depth used to stabilize the volatility bands.
Smoothing Type – Choose from HMA, KAMA, VIDYA, FRAMA, Super Smoother, etc. to match your asset and trading style.
Volatility MA Length – Smoothing length for the calculated range; shorter = more reactive.
High/Low Smoother Length – Additional smoothing to reduce noise from spikes or false pivots.
Band Multiplier – Widens or tightens the band range based on personal preference.
Enable Curved Channel – Toggle between curved or regular trend slope behavior.
Base Step (× ATR) – The starting point for curved slope progression.
Growth per Bar (× ATR) – How much the slope accelerates per bar during a sustained trend.
Slope – Reactivity of the standard trend line to price movements.
Multiplicative Factor – Sensitivity adjustment for HyperTrend slope.
Candle Trend Length – Lookback period for trend determination from candle structure.
-----------------
Disclaimer
The content provided in my scripts, indicators, ideas, algorithms, and systems is for educational and informational purposes only. It does not constitute financial advice, investment recommendations, or a solicitation to buy or sell any financial instruments. I will not accept liability for any loss or damage, including without limitation any loss of profit, which may arise directly or indirectly from the use of or reliance on such information.
All investments involve risk, and the past performance of a security, industry, sector, market, financial product, trading strategy, backtest, or individual's trading does not guarantee future results or returns. Investors are fully responsible for any investment decisions they make. Such decisions should be based solely on an evaluation of their financial circumstances, investment objectives, risk tolerance, and liquidity needs.

Regression Channel (Interactive)Weighted Interactive Regression Channel (WIRC)
Overview
The Weighted Interactive Regression Channel improves on traditional regression channels by emphasizing key price points through intelligent weighting. Instead of treating all candles equally, WIRC adapts to market dynamics for better trend detection and channel accuracy.
Key Differences from Standard Channels
Weighted vs. Equal: Prioritizes significant events over uniform weighting
Dynamic vs. Static: Adapts in real time to market changes
Accurate vs. Basic: Reduces noise, enhances signal clarity
Customizable vs. Fixed: Full control over weights and visuals
Weighting Methods
Direction Change – Highlights reversal points via local peaks/troughs
Volume-Based – Emphasizes high-volume candles, ideal for breakouts
Price Range – Weights wide-range candles to capture volatility
Time Decay – Prioritizes recent data for current market relevance
Interactive Features
Data Range: Set channel start/end over 1–500 bars
Visuals: Line styles, color coding, fill options, reference lines
Stats: Slope, R², standard deviation, point count, weight method
Technical Implementation
Weighted Regression Formula: Uses weights for slope, intercept, and deviation
Channel Lines: Center = weighted regression; bounds = ± deviation × multiplier
Usage Scenarios
Trend Analysis: Use Direction Change + longer range
Breakouts: Use Volume weighting + fill + boundary watching
Volatility: Apply Price Range weighting + monitor standard deviation
Current Market: Use Time Decay + shorter ranges + stat display
Parameter Tips
Channel Width:
Narrow (1.0–1.5): Responsive
Standard (1.5–2.0): Balanced
Wide (2.0–3.0+): Conservative
Weighting Intensity:
Conservative (1.5–2.0)
Moderate (2.0–3.0)
Aggressive (3.0+)
Advanced Use
Multi-Timeframe: Use different weightings per timeframe
Market Structure: Detect swings, institutional zones
Risk Management: Dynamic S/R levels, volatility-driven sizing
Best Practices
Start with Direction Change
Test different ranges
Monitor stats
Combine with other indicators
Adjust to market context
Recalibrate regularly
Conclusion
WIRC delivers a smarter, more adaptive view of price action than standard regression tools. With real-time customization and multiple weighting options, it’s ideal for traders seeking precision across strategies—trend tracking, breakout confirmation, or volatility insight.

WLSMA: fast approximation🙏🏻 Sup TV & @alexgrover
O(N) algocomplexity, just one loop inside. No, you can't do O(1) @ updates in moving window mode, only expanding window will allow that.
Now I have time series & stats models of my own creation, nowhere else available, just TV and my github for now, ain’t no legacy academic industry I always have fun about, but back in 2k20 when I consciously ain’t known much about quant, I remember seeing post by @alexgrover recreating Moving Regression Endpoint dropped on price chart (called LSMA here) as a linear filter combination of filters (yea yeah DSP terms) as 3WMA - 2SMA. Now it’s my time to do smth alike aye?
...
This script is remake of my 1st degree WLSMA via linear filter combo. It’s much faster, we aint calculate moving regression per se, we just match its freq response. You can see it on the screen (WLSMAfa) almost perfectly matching the original one (WLSMA).
...
While humans like to overfit, I fw generalizations. So your lovely WMA is actually just one case of a more general weight pattern: pow(len - i, e), where pow is the power function and e is the exponent itself. So:
- If e = 0, then we have SMA (every number in 0th power is one)
- If e = 1, we get WMA
- If e = 2, we get quadratic weights.
We can recreate WLSMA freq response then by combining 2 filters with e = 1 and e = 2.
This is still an approximation, even tho enormously precise for the tasks you’ve shared with me. Due to the non-linear nature of the thing it’s all we can do, and as window size grows, even this small discrepancy converges with true WLSMA value, so we’re all good. Pls don’t try to model this 0.00xxxx discrepancy, it’s not natural.
...
DSP approach is unnatural for prices, but you can put this thing on volume delta and be happy, or on other metrics of yours, if for some reason u dont wanna estimate thresholds by fitting a distro.
All good TV
∞
P.S.: strangely, the first script made & dropped in the location in Saint P where my actual quant way has started ~5 years ago xD, very thankful

Support and Resistance Logistic Regression | Flux Charts💎 GENERAL OVERVIEW
Introducing our new Logistic Regression Support / Resistance indicator! This tool leverages advanced statistical modeling "Logistic Regressions" to identify and project key price levels where the market is likely to find support or resistance. For more information about the process, please check the "HOW DOES IT WORK ?" section.
Logistic Regression Support / Resistance Features :
Intelligent S/R Identification : The indicator uses a logistic regression model to intelligently identify and plot significant support and resistance levels.
Predictive Probability : Each identified level comes with a calculated probability, indicating how likely it is to act as a true support or resistance based on historical data.
Retest & Break Labels : The indicator clearly marks on your chart when a detected support or resistance level is retested (price touches and respects the level) or broken (price decisively crosses through the level).
Alerts : Real-time alerts for support retests, resistance retests, support breaks, and resistance breaks.
Customizable : You can change support & resistance line style, width and colors.
🚩 UNIQUENESS
What makes this indicator truly unique is its application of logistic regression to the concept of support and resistance. Instead of merely identifying historical highs and lows, our indicator uses a statistical model to predict the future efficacy of these levels. It analyzes underlying market conditions (like RSI and body size at pivot formation) to assign a probability to each potential S/R zone. This predictive insight, combined with dynamic, real-time labeling of retests and breaks, provides a more robust and adaptive understanding of market structure than traditional, purely historical methods.
📌HOW DOES IT WORK ?
The Logistic Regression Support / Resistance indicator operates in several key steps:
First, it identifies significant pivot highs and lows on the chart based on a user-defined "Pivot Length." These pivots are potential areas of support or resistance.
For each detected pivot, the indicator extracts relevant market data at that specific point, including the RSI (Relative Strength Index) and the Body Size (the absolute difference between the open and close price of the candle). These serve as input features for the model.
The core of the indicator lies in its logistic regression model. This model is continuously trained on past pivot data and their subsequent behavior (i.e., whether they were "respected" as support/resistance multiple times). It learns the relationship between the extracted features (RSI, Body Size) and the likelihood of a pivot becoming a significant S/R level.
When a new pivot is identified, the model uses its learned insights to calculate a prediction value—a probability (from 0 to 1) that this specific pivot will act as a strong support or resistance.
If the calculated probability exceeds a user-defined "Probability Threshold," the pivot is designated a "Regression Pivot" and drawn on the chart as a support or resistance line. The indicator then actively tracks how price interacts with these levels, displaying "R" labels for retests when the price bounces off the level and "B" labels for breaks when the price closes beyond it.
⚙️ SETTINGS
1. General Configuration
Pivot Length: This setting defines the number of bars used to determine a significant high or low for pivot detection.
Target Respects: This input specifies how many times a level must be "respected" by price action for it to be considered a strong support or resistance level by the underlying model.
Probability Threshold: This is the minimum probability output from the logistic regression model for a detected pivot to be considered a valid support or resistance level and be plotted on the chart.
2. Style
Show Prediction Labels: Enable or disable labels that display the calculated probability of a newly identified regression S/R level.
Show Retests: Toggle the visibility of "R" labels on the chart, which mark instances where price has retested a support or resistance level.
Show Breaks: Toggle the visibility of "B" labels on the chart, which mark instances where price has broken through a support or resistance level.
