Reversal Buy and Sell SignalsThis indicator is fast and minimalistic reversal-detection indicator designed to capture high-probability turning points in the market. It combines engulfing candlestick patterns, a strong candle body filter, and RSI momentum analysis to generate precise BUY and SELL signals with minimal noise.
Reversaltrading

DCA Ladder CalculatorThis script is a DCA (Dollar-Cost Averaging) Ladder Calculator with Risk & Leverage Management baked in.
It’s designed for both LONG and SHORT positions, and helps you:
🎯 Strategically scale into positions across multiple entry points
🔐 Control risk exposure via defined capital allocation
⚖️ Utilize leverage responsibly — for efficiency, not destruction
🧮 Visualize risk, stop loss level, and entry distribution
🔁 Adapt to trend reversals or key zones, especially when combined with reversal indicators or higher timeframe signals
🧠 How It Works
This tool takes a capital allocation approach to building a ladder of positions:
1. You define:
- Portfolio value
- Risk per trade (as %)
- Leverage
- Number of DCA levels
- Entry multiplier (e.g. 1x, 2x, 4x...)
2. The script then:
- Calculates total margin to risk = Portfolio × Risk %
- Calculates total leveraged position size = Margin × Leverage
- Distributes entries according to exponential weights (1x, 2x, 4x...), totaling 7 for 3 levels
- Calculates per-entry:
- Entry price (based on price zone spacing)
- Multiplier
- Exact margin per entry
- Leverage per entry (margin × leverage)
- Computes:
- Average entry price (margin-weighted)
- Approximate stop loss level based on recent ATR and price structure
- % drawdown to SL
- Total margin and position size
3. Displays all this in a clean on-chart table.
📈 How to Use It
1. Apply the indicator to a chart (default: 1D — ideal for clean zones).
2. Configure your:
- Portfolio Value (total trading capital)
- Risk per Trade (%) (your acceptable loss)
- Leverage (exchange or strategy-based)
- DCA Levels (e.g. 3 = anchor + 2 entries)
- Multiplier (typically 2.0 for doubling)
3. Choose LONG or SHORT mode depending on direction.
4. The table will show:
- Entry price ladder
- Margin used per entry
- Total position size
- Approx. stop loss (where your full risk is defined)
Use in conjunction with price action, S/R zones, trendline breaks, volume divergence, or reversal indicators.
✅ Best Practices for Using This Tool
- Leverage is a tool, not a weapon. Use it to scale smartly — not recklessly.
- Use fewer, higher-conviction entries. Don’t blindly ladder; combine with price structure and signals.
- Stick to your risk percent. Never risk more than you can afford to lose. Let this calculator enforce discipline.
- Combine with other confirmation tools, like RSI divergence, momentum shifts, OB zones, etc.
- Avoid martingale-style over-exposure. This is not a gambling tool — it’s for capital efficiency.
🛡️ What This Tool Does NOT Do
- This is not a trade signal indicator.
- It does not place trades or auto-manage positions.
- It does not replace personal responsibility or strategy — it's a tool to help apply structure.
⚠️ Disclaimer
This script is for educational and informational purposes only.
It does not constitute financial advice, nor is it a recommendation to buy or sell any financial instrument.
Always consult a licensed financial advisor before making investment decisions.
Use of leverage involves high risk and can lead to substantial losses.
The author and publisher assume no liability for any trading losses resulting from use of this script.

AP Capital – Volatility + High/Low Projection v1.1📌 AP Capital – Volatility + High/Low Projection v1.1
Predictive Daily Volatility • Session Logic • High/Low Projection Indicator
This indicator is designed to help traders visually understand daily volatility conditions, identify session-based turning points, and anticipate potential highs and lows of the day using statistical behavior observed across thousands of bars of intraday data.
It combines intraday session structure, volatility regime classification, and context from the previous day’s expansion to highlight high-probability areas where the market may set its daily high or daily low.
🔍 What This Indicator Does
1. Volatility Regime Detection
Each day is classified into:
🔴 High Volatility (trend continuation & expansion likely)
🟡 Normal Volatility
🔵 Low Volatility (chop, false breaks, mean-reversion common)
The background color automatically adapts so you always know what environment you're trading in.
2. Session-Based High/Low Identification
Different global sessions tend to create different market behaviors:
Asia session frequently sets the LOW of day
New York & Late US sessions frequently set the HIGH of day
This indicator uses those probabilities to highlight potential turning points.
3. Potential High / Low of Day Projections
The script plots:
🟢 Potential LOW of Day
🔴 Potential HIGH of Day
These appear only when:
Price hits the session-statistical turning zone
Volatility conditions match
Yesterday’s expansion or compression context agrees
This keeps signals clean and prevents over-marking.
4. Clean Visuals
Instead of cluttering the chart, highs and lows are marked only when conditions align, making this tool ideal for:
Session scalpers
Day traders
Gold / NAS100 / FX intraday traders
High-probability reversal traders
🧠 How It Works
The engine combines:
Daily range vs 20-day average
Real-time intraday high/low formation
Session-specific probability weighting
Previous day expansion and volatility filters
This results in highly reliable signals for:
Fade trades
Reversal setups
Timing entries more accurately
✔️ Best Uses
Identifying where the day’s range is likely to complete
Avoiding trades during low-volatility compression days
Detecting where the market is likely to turn during major sessions
Using potential HIGH/LOW levels as take-profit zones
Enhancing breakout or reversal strategies
⚠️ Disclaimer
This indicator does not repaint, but it is not a standalone entry tool.
It is designed to provide context, session awareness, and volatility-driven turning points to assist your existing strategy.
Always combine with sound risk management.

Tactical Deviation🎯 TACTICAL DEVIATION - Volume-Backed VWAP Deviation Analysis
What Makes This Different?
Unlike basic VWAP indicators, Tactical Deviation combines:
• Multi-timeframe VWAP deviation bands (Daily/Weekly/Monthly)
• Volume spike intelligence - signals only appear with volume confirmation
• Pivot reversal detection at deviation extremes
• Optional multi-VWAP confluence system
• Smart defaults for quality over quantity
This unique combination filters weak setups and identifies high-probability entries at extreme price deviations from fair value.
📊 DEFAULT SETTINGS (Ready to Use)
✅ Daily VWAP with ±2σ deviation bands
✅ Volume spike detection (1.5x average required)
✅ 2σ minimum deviation for signals
❌ Weekly/Monthly VWAPs (enable for multi-timeframe)
❌ Pivot reversal requirement (enable for stronger signals)
❌ Fill zones (optional visual enhancement)
Why: Daily VWAP is most relevant for intraday trading. 2σ bands catch meaningful moves. Volume spikes ensure conviction. Clean chart focuses on what matters.
🚀 HOW TO USE
BASIC USAGE:
• Green triangles (below bars) = Long signals at oversold deviations
• Red triangles (above bars) = Short signals at overbought deviations
SIGNAL QUALITY:
• Normal size, bright colors = Volume spike (best quality)
• Small size, lighter colors = Volume momentum
• Tiny size = No volume confirmation
DEVIATION ZONES:
• ±2σ = Extreme deviation (signals appear here)
• ±1σ to ±2σ = Extended but not extreme
• Within ±1σ = Normal range
TRADING APPROACHES:
Mean Reversion:
→ Enter when price reaches ±2σ with volume spike
→ Target: Return to VWAP or opposite band
→ Stop: Beyond extreme deviation
Trend Continuation:
→ Use bands to identify pullbacks
→ Enter pullback to VWAP in trending market
→ Volume confirms continuation
Reversal Trading:
→ Enable "Require Pivot Reversal" for stronger signals
→ Signals only when deviation + pivot reversal occur
→ Higher probability, fewer signals
⚙️ EXPLORE SETTINGS FOR FULL USE
VWAP SETTINGS:
• Show Weekly/Monthly VWAP = Multi-timeframe context
• Show ±1σ Bands = Normal deviation range
• Show ±3σ Bands = Extreme extremes (rare but powerful)
SIGNAL SETTINGS:
• Min Deviation: 1σ (more signals) | 2σ (default) | 3σ (fewer, extreme only)
• Require Pivot Reversal: OFF (default) | ON (stronger but fewer)
• Volume Spike Threshold: 1.5x (default) | 2.0x+ (major spikes) | 1.2x (more signals)
CONFLUENCE SETTINGS:
• Require Multi-VWAP Confluence: OFF (default) | ON (2+ VWAPs must agree)
• Min VWAPs: 2 (Daily + Weekly/Monthly) | 3 (all must agree)
VISUAL SETTINGS:
• Show Fill Zones = Shaded areas between bands
• Fill Opacity = Transparency adjustment
• Line Widths = Customize thickness
💡 PRO TIPS
1. Start with defaults, then enable features as you learn
2. Volume spike requirement filters weak moves - keep it enabled
3. Enable Weekly/Monthly VWAPs for higher timeframe context
4. Enable confluence for swing trading setups
5. Pivot reversals: ON for reversals, OFF for continuations
6. Check top-right info table for current deviation levels
🎨 VISUAL GUIDE
• Cyan Line = Daily VWAP (fair value)
• Cyan Bands = Daily deviation zones
• Orange Line = Weekly VWAP (if enabled)
• Purple Line = Monthly VWAP (if enabled)
• Green Triangle = Long signal (oversold)
• Red Triangle = Short signal (overbought)
⚠️ IMPORTANT
Educational purposes only. Always use proper risk management. Signals are based on statistical deviation, not guarantees. Volume confirmation improves quality but doesn't guarantee outcomes. Combine with your own analysis.
The unique combination of VWAP deviation analysis, volume profile confirmation, pivot identification, and multi-timeframe confluence in a single clean interface makes Tactical Deviation different from basic VWAP indicators.
Happy Trading! 📈

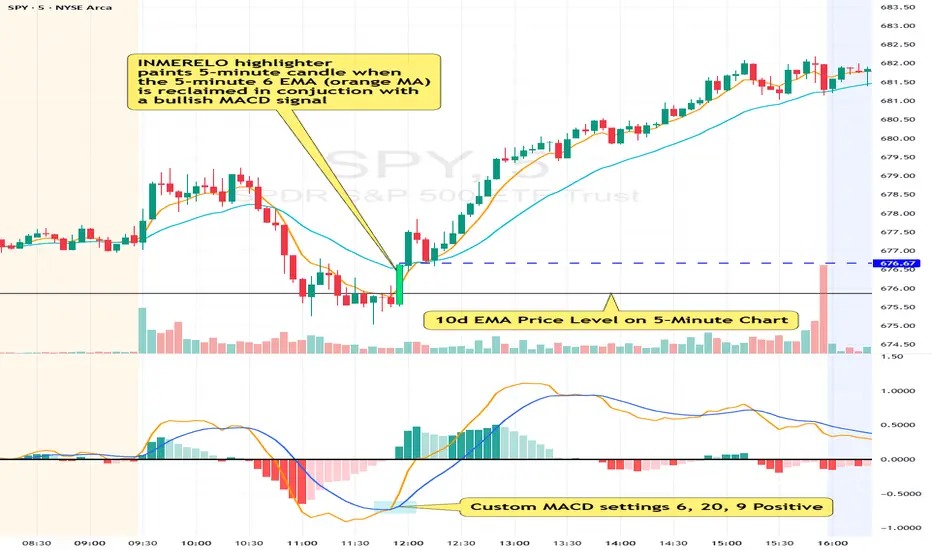
INMERELO EMA Reclaim HighlighterOverview
The INMERELO EMA Reclaim indicator highlights intraday candles reclaiming a configurable EMA on any timeframe. It identifies candles based on customizable candle geometry filters and confirms momentum using a custom MACD setup.
Features
Configurable Intraday EMA
Any EMA length and timeframe. Default: 6-period EMA on chart timeframe.
Highlights when price reclaims the EMA after a configurable number of prior closes below it.
Candle Geometry Filters (ORB-Style)
Open Position: Maximum position of open relative to candle range (0–1). Default: 0.40
Close Position: Minimum position of close relative to candle range (0–1). Default: 0.70
Body Fraction: Minimum body size relative to candle range. Default: 0.50
Custom MACD Filter
Fast line above slow line.
Configurable: Fast (default 6), Slow (default 20), Signal (default 9).
Prior Closes Below EMA Filter
Configurable minimum number of prior closes below EMA. Default: 2
Visual Options
Paint candle with configurable color.
Optional arrow display above reclaim candle (toggleable).
Flexible
Works on any intraday timeframe, including 5-minute, 2-minute, 15-minute, etc.
Settings Overview
Setting Default Notes
EMA Length 6 EMA used for reclaim detection
EMA Timeframe Chart TF Can be set to any intraday timeframe
Open ≤ 0.40 ORB-style filter
Close ≥ 0.70 ORB-style filter
Body Fraction 0.50 ORB-style filter
Min Prior Closes Below EMA 2 Minimum closes below EMA before reclaim
MACD Fast 6 Custom MACD fast line
MACD Slow 20 Custom MACD slow line
MACD Signal 9 Custom MACD signal line
Paint Candle True Highlights valid candles
Candle Color Lime Configurable
Show Arrow False Optional visual
Summary:
The INMERELO EMA Reclaim indicator identifies intraday candles reclaiming a configurable EMA, filtered by customizable candle geometry and MACD momentum. Visual options include painted candles and optional arrows, and all settings are fully configurable.
Order-Flow Proxy (VWAP Deviation Zones)Order-Flow Proxy (VWAP Deviation Zones) helps traders visualize when market price moves unusually far away from its Volume-Weighted Average Price (VWAP) — a key fair-value level used by institutional participants.
When price stretches too far above or below VWAP, it often signals temporary imbalance between buying and selling pressure.
This tool highlights those moments using simple color zones and an optional statistical Z-Score filter for deeper precision.
In short: it’s a clean, minimal mean-reversion indicator showing when price is statistically “too far” from fair value.
Red zone → Price extended above VWAP → possible buyer exhaustion or short setup.
Green zone → Price extended below VWAP → possible seller exhaustion or long setup.
VWAP line → Acts as a dynamic fair-value anchor.
Concept:
VWAP combines both price and traded volume to define where most transactions occurred.
Deviations from it — measured either by a fixed distance (1%) or by Z-Score — can reveal overvaluation or undervaluation zones used by professional traders for contrarian setups.
How to use:
Apply the indicator to any intraday chart (1m–1h recommended).
Watch for background color shifts — red or green.
Optionally enable the Z-Score filter to focus only on statistically extreme deviations.
Combine with volume spikes, liquidity sweeps, or your own order-flow tools for confirmation.
Tip:
Best used as a visual overlay for detecting stretched markets and potential reversals.

Ultimate MACD Suite [BigBeluga]🔵 OVERVIEW
The Ultimate MACD Suite is an advanced momentum-based system that enhances the classic MACD with modern features tailored for professional traders.
It transforms MACD into a full market-decision engine — offering multi-timeframe confluence, adaptive histogram behavior, divergence detection, heatmap trend visualization, and actionable reversal signals.
This toolkit goes far beyond standard MACD, helping traders identify trend momentum shifts, exhaustion zones, high-probability reversal areas, and breakout confirmation signals across multiple timeframes simultaneously. It's to be used as part of a major trading system and to simplify usage of the MACD.
⚠️ Note:
This is not a traditional MACD — it uses normalized values , enhanced visual feedback, and a multi-timeframe dashboard engine for superior signal quality and clarity.
🔵 CONCEPTS
Combines MACD momentum, signal-line crossovers, and histogram reversals into one system
Uses normalized scaling to detect extreme momentum levels and exhaustion zones
Multi-timeframe dashboard displays consensus signal alignment across several timeframes
Divergence engine identifies bullish & bearish trend weakening early
Heatmap mode visually distinguishes strong trend phases from neutral or fading momentum
Reversal arrows & crosses highlight actionable turning points on chart
🔵 FEATURES
Normalized MACD Engine — improves signal clarity across all assets/timeframes
MACD Heatmap Mode — color-coded slope intensity for trend strength monitoring
MACD Rising and Falling Mode — color-coded rising and falling MACD regimes
Histogram Reversal Detection — early momentum fade signal before price turns
Signal-Line Momentum Shifts — bullish ▲ & bearish ▼ alerts on cross-confirmation
Overbought/Oversold Bands — enhanced visual thresholds at ±80 levels
Smart Divergence Detection (Non-Lag) — confirms regular bullish & bearish divergences
Multi-Timeframe Dashboard — MACD, signal, histogram & divergence signals across 5+ TFs
Reversal Push-Filter — ensures only clean signals after confirmed momentum inflection
On-Chart Reversal Labels — optional compact signal markers for clean visual execution
Histogram Color Logic — rising/falling or heatmap mode for deeper momentum reading
🔵 HOW TO USE
Look for MACD crossing above signal + green histogram to confirm bullish momentum
Use ▼ and ▲ arrows to catch confirmed momentum reversals
Monitor the dashboard — the more timeframes align, the stronger the setup
Watch divergences for trend exhaustion or reversal setups
Treat histogram trend shifts as early momentum clues before price reacts
Use ±80 levels to identify overheated conditions & fade opportunities
Combine with structure, volume, or BigBeluga liquidity tools for higher accuracy
🔵 ALERTS
The indicator includes a full alert suite for automation and real-time trade readiness:
MACD crossovers (Bullish / Bearish)
Histogram reversals & zero-line shifts
Bullish / Bearish divergence detection
Overbought / Oversold MACD alerts
Bullish ▲ and bearish ▼ reversal triggers
Use these alerts to automate signal monitoring or feed algorithmic systems.
🔵 CONCLUSION
The Ultimate MACD Suite transforms a classic indicator into a powerful trading engine.
With multi-timeframe alignment, heatmapping, divergence logic, normalized scaling and automated signals, it becomes an elite momentum-confirmation and reversal-timing system built for serious traders.
Whether scalping intraday or managing swing positions, this MACD engine helps identify the most profitable phases of trend movement — while warning early when a trend is weakening.
Script payant

Tristan's Tri-band StrategyTristan's Tri-band Strategy - Confluence Trading System
Strategy Overview:
This strategy combines three powerful technical indicators - RSI, Williams %R, and Bollinger Bands - into a single visual trading system. Instead of cluttering your chart with separate indicator panels, all signals are displayed directly on the price chart using color-coded gradient overlays, making it easy to spot high-probability trade setups at a glance.
How It Works:
The strategy identifies trading opportunities when multiple indicators align (confluence), suggesting strong momentum shifts:
📈 Long Entry Signals:
RSI drops to 30 or below (oversold)
Williams %R reaches -80 to -100 range (oversold)
Price touches or breaks below the lower Bollinger Band
All three conditions must align during your selected trading session
📉 Short Entry Signals:
RSI rises to 70 or above (overbought)
Williams %R reaches 0 to -20 range (overbought)
Price touches or breaks above the upper Bollinger Band
All three conditions must align during your selected trading session
Visual Indicators:
(faint) Green gradients below candles = Bullish oversold conditions (buying opportunity)
(faint) Red/Orange gradients above candles = Bearish overbought conditions (selling opportunity)
Stacked/brighter gradients = Multiple indicators confirming the same signal (higher probability) will stack and show brighter / less faint
Blue Bollinger Bands = Volatility boundaries and mean reversion zones
Exit Strategy:
Long trades exit when price reaches the upper Bollinger Band OR RSI becomes overbought (≥70)
Short trades exit when price reaches the lower Bollinger Band OR RSI becomes oversold (≤30)
Key Features:
✅ Session Filters - Trade only during NY (9:30 AM-4 PM), London (3 AM-11:30 AM), or Asia (7 PM-1 AM EST) sessions
✅ No Repainting - Signals are confirmed on candle close for realistic backtesting and live trading
✅ Customizable Parameters - Adjust RSI levels, BB standard deviations, Williams %R periods, and gradient visibility
✅ Visual Clarity - See all three indicators at once without switching between panels
✅ Built-in Alerts - Get notified when entry and exit conditions are met
How to Use Effectively:
Choose Your Trading Session - For day trading US stocks, enable only the NY session. For forex or 24-hour markets, select the sessions that match your schedule.
Look for Gradient Stacking - The brightest, most visible gradients occur when both RSI and Williams %R signal together. These are your highest-probability setups.
Confirm with Price Action - Wait for the candle to close before entering. The strategy enters on the next bar's open to prevent repainting.
Respect the Bollinger Bands - Entries occur at the outer bands (price extremes), and exits occur at the opposite band or when momentum reverses.
Backtest First - Test the strategy on your preferred instruments and timeframes. Works best on liquid assets with clear trends and mean reversion patterns (stocks, major forex pairs, indices).
Adjust Gradient Visibility - Use the "Gradient Strength" slider (lower = more visible) to make signals stand out on your chart style.
Best Timeframes: 5-minute to 1-hour charts for intraday trading; 4-hour to daily for swing trading (I have also found the 3 hour timeframe to work really well for some stocks / ETFs.)
Best Markets: Liquid instruments with volatility - SPY, QQQ, major stocks, EUR/USD, GBP/USD, major indices
Risk Management: This is a mean reversion strategy that works best in ranging or choppy markets. In strong trends, signals may appear less frequently. Always use proper position sizing and stop losses based on your risk tolerance.
----------------------------------------------
Note: Past performance does not guarantee future results. This strategy is provided for educational purposes. Always backtest thoroughly and practice proper risk management before live trading.RetryClaude can make mistakes. Please double-check responses. Sonnet 4.5

v2.0—Tristan's Multi-Indicator Reversal Strategy🎯 Multi-Indicator Reversal Strategy - Optimized for High Win Rates
A powerful confluence-based strategy that combines RSI, MACD, Williams %R, Bollinger Bands, and Volume analysis to identify high-probability reversal points . Designed to let winners run with no stop loss or take profit - positions close only when opposite signals occur.
Also, the 3 hour timeframe works VERY well—just a lot less trades.
📈 Proven Performance
This strategy has been backtested and optimized on multiple blue-chip stocks with 80-90%+ win rates on 1-hour timeframes from Aug 2025 through Oct 2025:
✅ V (Visa) - Payment processor
✅ MSFT (Microsoft) - Large-cap tech
✅ WMT (Walmart) - Retail leader
✅ IWM (Russell 2000 ETF) - Small-cap index
✅ NOW (ServiceNow) - Enterprise software
✅ WM (Waste Management) - Industrial services
These stocks tend to mean-revert at extremes, making them ideal candidates for this reversal-based approach. I only list these as a way to show you the performance of the script. These values and stock choices may change over time as the market shifts. Keep testing!
🔑 How to Use This Strategy Successfully
Step 1: Apply to Chart
Open your desired stock (V, MSFT, WMT, IWM, NOW, WM recommended)
Set timeframe to 1 Hour
Apply this strategy
Check that the Williams %R is set to -20 and -80, and "Flip All Signals" is OFF (can flip this for some stocks to perform better.)
Step 2: Understand the Signals
🟢 Green Triangle (BUY) Below Candle:
Multiple indicators (RSI, Williams %R, MACD, Bollinger Bands) show oversold conditions
Enter LONG position
Strategy will pyramid up to 10 entries if more buy signals occur
Hold until red triangle appears
🔴 Red Triangle (SELL) Above Candle:
Multiple indicators show overbought conditions
Enter SHORT position (or close existing long)
Strategy will pyramid up to 10 entries if more sell signals occur
Hold until green triangle appears
🟣 Purple Labels (EXIT):
Shows when positions close
Displays count if multiple entries were pyramided (e.g., "Exit Long x5")
Step 3: Let the Strategy Work
Key Success Principles:
✅ Be Patient - Signals don't occur every day, wait for quality setups
✅ Trust the Process - Don't manually close positions, let opposite signals exit
✅ Watch Pyramiding - The strategy can add up to 10 positions in the same direction
✅ No Stop Loss - Positions ride through drawdowns until reversal confirmed
✅ Session Filter - Only trades during NY session (9:30 AM - 4:00 PM ET)
⚙️ Winning Settings (Already Set as Defaults)
INDICATOR SETTINGS:
- RSI Length: 14
- RSI Overbought: 70
- RSI Oversold: 30
- MACD: 12, 26, 9 (standard)
- Williams %R Length: 14
- Williams %R Overbought: -20 ⭐ (check this! And adjust to your liking)
- Williams %R Oversold: -80 ⭐ (check this! And adjust to your liking)
- Bollinger Bands: 20, 2.0
- Volume MA: 20 periods
- Volume Multiplier: 1.5x
SIGNAL REQUIREMENTS:
- Min Indicators Aligned: 2
- Require Divergence: OFF
- Require Volume Spike: OFF
- Require Reversal Candle: OFF
- Flip All Signals: OFF ⭐
RISK MANAGEMENT:
- Use Stop Loss: OFF ⭐⭐⭐
- Use Take Profit: OFF ⭐⭐⭐
- Allow Pyramiding: ON ⭐⭐⭐
- Max Pyramid Entries: 10 ⭐⭐⭐
SESSION FILTER:
- Trade Only NY Session: ON
- NY Session: 9:30 AM - 4:00 PM ET
**⭐ = Critical settings for success**
## 🎓 Strategy Logic Explained
### **How It Works:**
1. **Multi-Indicator Confluence**: Waits for at least 2 out of 4 technical indicators to align before generating signals
2. **Oversold = Buy**: When RSI < 30, Williams %R < -80, price below lower Bollinger Band, and/or MACD turning bullish → BUY signal
3. **Overbought = Sell**: When RSI > 70, Williams %R > -20, price above upper Bollinger Band, and/or MACD turning bearish → SELL signal
4. **Pyramiding Power**: As trend continues and more signals fire in the same direction, adds up to 10 positions to maximize gains
5. **Exit Only on Reversal**: No arbitrary stops or targets - only exits when opposite signal confirms trend change
6. **Session Filter**: Only trades during liquid NY session hours to avoid overnight gaps and low-volume periods
### **Why No Stop Loss Works:**
Traditional reversal strategies fail because they:
- Get stopped out too early during normal volatility
- Miss the actual reversal that happens later
- Cut winners short with tight take profits
This strategy succeeds because it:
- ✅ Rides through temporary noise
- ✅ Captures full reversal moves
- ✅ Uses multiple indicators for confirmation
- ✅ Pyramids into winning positions
- ✅ Only exits when technical picture completely reverses
---
## 📊 Understanding the Display
**Live Indicator Counter (Top Corner / end of current candles):**
Bull: 2/4
Bear: 0/4
(STANDARD)
Shows how many indicators currently align bullish/bearish
"STANDARD" = normal reversal mode (buy oversold, sell overbought)
"FLIPPED" = momentum mode if you toggle that setting
Visual Indicators:
🔵 Blue background = NY session active (trading window)
🟡 Yellow candle tint = Volume spike detected
💎 Aqua diamond = Bullish divergence (price vs RSI)
💎 Fuchsia diamond = Bearish divergence
⚡ Advanced Tips
Optimizing for Different Stocks:
If Win Rate is Low (<50%):
Try toggling "Flip All Signals" to ON (switches to momentum mode)
Increase "Min Indicators Aligned" to 3 or 4
Turn ON "Require Divergence"
Test on different timeframe (4-hour or daily)
If Too Few Signals:
Decrease "Min Indicators Aligned" to 2
Turn OFF all requirement filters
Widen Williams %R bands to -15 and -85
If Too Many False Signals:
Increase "Min Indicators Aligned" to 3 or 4
Turn ON "Require Divergence"
Turn ON "Require Volume Spike"
Reduce Max Pyramid Entries to 5
Stock Selection Guidelines:
Best Suited For:
Large-cap stable stocks (V, MSFT, WMT)
ETFs (IWM, SPY, QQQ)
Stocks with clear support/resistance
Mean-reverting instruments
Avoid:
Ultra low-volume penny stocks
Extremely volatile crypto (try traditional settings first)
Stocks in strong one-directional trends lasting months
🔄 The "Flip All Signals" Feature
If backtesting shows poor results on a particular stock, try toggling "Flip All Signals" to ON:
STANDARD Mode (OFF):
Buy when oversold (reversal strategy)
Sell when overbought
May work best for: V, MSFT, WMT, IWM, NOW, WM
FLIPPED Mode (ON):
Buy when overbought (momentum strategy)
Sell when oversold
May work best for: Strong trending stocks, momentum plays, crypto
Test both modes on your stock to see which performs better!
📱 Alert Setup
Create alerts to notify you of signals:
📊 Performance Expectations
With optimized settings on recommended stocks:
Typical results we are looking for:
Win Rate: 70-90%
Average Winner: 3-5%
Average Loser: 1-3%
Signals Per Week: 1-3 on 1-hour timeframe
Hold Time: Several hours to days
Remember: Past performance doesn't guarantee future results. Always use proper risk management.

Tristan's Multi-Indicator Reversal StrategyMulti-Indicator Reversal Strategy - Buy Low, Sell High
A comprehensive reversal detection system that combines multiple proven technical indicators to identify high-probability entry points for catching reversals at market extremes.
📊 Strategy Overview
This strategy is designed for traders who want to buy at lows and sell at highs by detecting when stocks are overextended and ready to reverse. It works by requiring multiple technical indicators to align before generating a signal, significantly reducing false entries.
Best Used On:
Timeframe: 1-hour charts (also works on 15min, 30min, 4hour)
Session: NY Trading Session (9:30 AM - 4:00 PM ET)
Assets: Stocks, ETFs, Crypto (particularly volatile tech stocks like ZM, TSLA, AAPL)
Trading Style: Swing trading, Intraday reversals
🔧 Technical Components
The strategy combines FIVE powerful technical indicators:
1. RSI (Relative Strength Index)
2. MACD (Moving Average Convergence Divergence)
3. Williams %R
4. Bollinger Bands
5. Volume Analysis
6. Divergence Detection (Optional)
🎨 Visual Signals
Entry Signals:
🟢 Green Triangle (below candle) = BUY LONG signal
🔴 Red Triangle (above candle) = SELL SHORT signal
Exit Signals:
🟣 Purple Label = Position closed (shows "x2", "x3" if multiple entries)
Additional Indicators:
💎 Aqua Diamond = Bullish divergence detected
💎 Fuchsia Diamond = Bearish divergence detected
🔵 Blue Background = NY Session active
🟡 Yellow Bar Tint = Volume spike detected
⚪ Small Circles = Near-signal conditions (2+ indicators aligned)
Live Counter:
Top corner shows: "Bull: X/4" and "Bear: X/4"
Indicates how many indicators currently align
⚙️ How to Use This Strategy
For Beginners (More Signals):
Set "Min Indicators Aligned" to 2
Turn OFF "Require Divergence"
Turn OFF "Require Volume Spike"
Turn OFF "Require Reversal Candle Pattern"
Keep "Allow Multiple Entries" OFF
This gives you more frequent signals to learn from.
For Advanced Traders (High Probability):
Set "Min Indicators Aligned" to 3 or 4
Turn ON "Require Divergence"
Turn ON "Require Volume Spike"
Turn ON "Require Reversal Candle Pattern"
Adjust stop loss to your risk tolerance
This filters for only the highest-quality setups.
Recommended Settings for 1-Hour Charts:
Min Indicators Aligned: 3
Stop Loss: 2.5%
Take Profit: 5.0%
RSI Length: 14
Williams %R Length: 14
Volume Multiplier: 1.5x
Session: NY only (for stocks)
BUY SIGNAL generated when:
2-4 indicators show oversold/bullish conditions:
RSI < 30 and turning up
MACD crossing bullish or histogram positive
Williams %R < -80 and turning up
Price at/below lower Bollinger Band
Optional confirmations (if enabled):
Bullish divergence detected
Volume spike present
Bullish reversal candle pattern
Session filter: Signals only during NY trading hours
SELL SIGNAL Generated When:
2-4 indicators show overbought/bearish conditions:
RSI > 70 and turning down
MACD crossing bearish or histogram negative
Williams %R > -20 and turning down
Price at/above upper Bollinger Band
Optional confirmations (if enabled):
Bearish divergence detected
Volume spike present
Bearish reversal candle pattern
🛡️ Risk Management Features
Automatic Stop Loss: Protects capital (default 2.5%)
Take Profit Target: Locks in gains (default 5.0%)
Pyramiding Control: Toggle to prevent position stacking
Session Filter: Avoids overnight risk and low-liquidity periods
Position Flipping: Automatically reverses when opposite signal appears
💡 Best Practices
✅ DO:
Wait for candle close before entering (built into strategy)
Use on volatile assets with clear trends
Combine with your own analysis and risk management
Backtest on your specific assets and timeframes
Start with paper trading to learn the signals
Adjust indicator requirements based on market conditions
❌ DON'T:
Use on very low timeframes (<5 min) without adjustment
Ignore the session filter on stocks
Use maximum leverage - these are reversal trades
Trade during major news events or earnings
Expect 100% win rate - focus on risk/reward ratio
📊 Performance Notes
This strategy prioritizes quality over quantity. With default settings, you may see:
2-5 signals per week on 1-hour charts
Higher win rate with stricter settings (3-4 indicators aligned)
Best performance during trending markets with clear reversals
Reduced performance in choppy, sideways markets
Tip: Adjust "Min Indicators Aligned" based on market conditions:
Trending markets: Use 3-4 (fewer but stronger signals)
Range-bound markets: Use 2 (more signals, but watch for false breakouts)

RSI Reversal + BB RSIReversal Alerts
SELL Reversal (reversalSELL)
Triggers when:
RSI touches or crosses above the upper BB, and
The current candle is bearish (close < open).
→ Plots a small red circle above the candle
→ Fires alert named “reversalSELL”
BUY Reversal (reversalBUY)
Triggers when:
RSI touches or crosses below the lower BB, and
The current candle is bullish (close > open).
→ Plots a small green circle below the candle
→ Fires alert named “reversalBUY”

Ultimate Risk Management Toolkit [ T W K ] :Smart Levels is Smart Trades!
All Trading View users and Stock market Enthusiast, get charged with the all new ( never seen before ) " Ultimate Risk Management Toolkit ⚙📏⚙ " .
Inputs and Features:
1: Drag the Bar-Time vertical line to the desired Entry candle ( manually ) for R:R management and controlling emotional trading.
2: Target, Entry, and SL line style, Width input.
3: Manual specific level Entry and Stop-Loss, input option.
4: Three types of Auto / Manual ' R:R ' risk reward ratio, targets with proper Entry, Stop-Loss points, and Stop-Loss level.
5: Three types of Entry options to fix Emotional trading habit.
6: Trailing Stop-Loss input option ( can be utilize as profit locking/booking ).
It will give more Power to manage your trades with proper R:R ( Auto / manual ) ratio, defined Entry and controlled Stop-Loss Levels.
Compatible with All Devices (Laptop / Mobile / Tablet / PC).
✅ HOW TO GET ACCESS :
Add to favorite and enjoy the true Trading View's sprit of community growth, without any limitations.
If you like any of my Invite-Only indicators, kindly DM and let me know!
⚠ RISK DISCLAIMER :
All content provided by "@TradeWithKeshhav" is for informational & educational purposes only.
It does not constitute any financial advice or a solicitation to buy or sell any securities of any type. All investments / trading involve risks. Past performance does not guarantee future results / returns.
Regards :
Team @TradeWithKeshhav
Happy trading and investing!

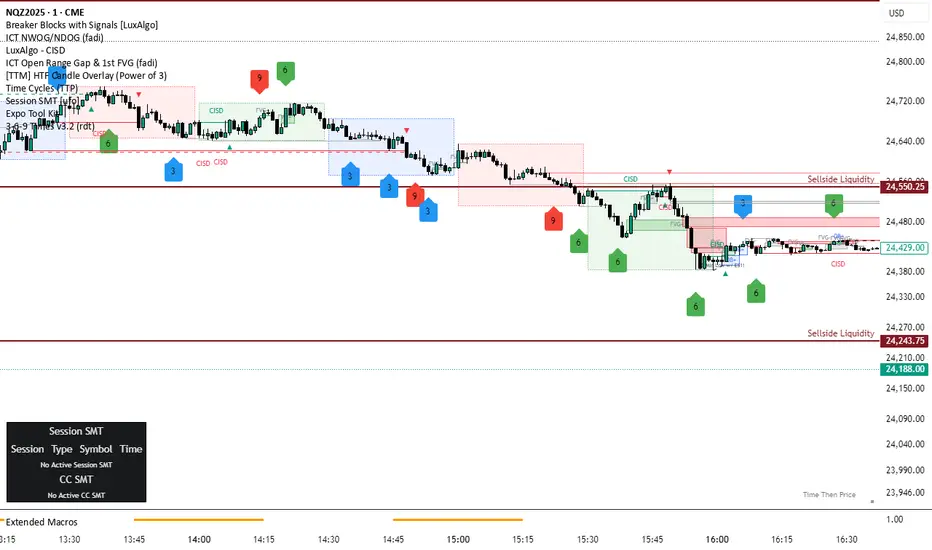
3-6-9 Times v3.2 (rdt)3-6-9 Times v3.1 Indicator Overview
Core Concept
This indicator identifies specific times/dates where the digital root (sum of digits reduced to a single number) equals 3, 6, or 9, which are considered significant in numerology and certain trading methodologies.
How It Calculates Roots:
For Intraday Timeframes (minutes, hours):
Formula: Hour + First Minute Digit + Last Minute Digit → Reduce to single digit
For Daily/Weekly/Monthly Timeframes:
Uses Month + Day calculations with similar digit reduction logic.
Key Features:
1. Break Filter (Default: ON)
Only displays labels after a swing high/low is broken
Prevents clutter by filtering out times that don't coincide with price action
Configurable pivot length (default: 2 bars)
Optional directional filter: green candles must break highs, red candles must break lows
2. Root Selection
Toggle individual roots (3, 6, or 9) on/off
Each root has customizable color
Default colors: Blue (3), Green (6), Red (9)
3. Display Options
Marking Style: Labels, Vertical Lines, or Both
Label Text Format:
Root Only (default) - shows just "3", "6", or "9"
Time/Date Only - shows the actual time/date
Root + Time/Date (separate lines) - shows both
Label Background: Toggle colored box behind text (default: OFF)
Chart Background: Toggle colored background highlight (default: OFF)
Text Color: Customizable (default: black)
4. Session Filter:
Set specific hours/minutes for when to display signals
Default: 00:00 to 23:59 (all day)
Useful for focusing on specific trading sessions
5. Hour Offset
Manual adjustment for timezone/DST issues
Range: -12 to +12 hours
Helps align calculations with your preferred timezone
6. Label Placement
Green candles: Label appears above the bar
Red candles: Label appears below the bar
7. Alerts
Four alert conditions available:
Any 3-6-9 root hit
Specific Root 3 hit
Specific Root 6 hit
Specific Root 9 hit
Typical Use Case
Traders use this to identify potential reversal or continuation points when:
A 3/6/9 time occurs
Price breaks a recent swing high/low
Combining this timing signal with other technical analysis
The indicator helps identify "energetic" time windows that may correlate with increased volatility or directional moves.
3-6-9 Times v3.1 (rdt)3-6-9 Times v3.1 Indicator Overview
Core Concept
This indicator identifies specific times/dates where the digital root (sum of digits reduced to a single number) equals 3, 6, or 9, which are considered significant in numerology and certain trading methodologies.
How It Calculates Roots:
For Intraday Timeframes (minutes, hours):
Formula: Hour + First Minute Digit + Last Minute Digit → Reduce to single digit
For Daily/Weekly/Monthly Timeframes:
Uses Month + Day calculations with similar digit reduction logic.
Key Features:
1. Break Filter (Default: ON)
Only displays labels after a swing high/low is broken
Prevents clutter by filtering out times that don't coincide with price action
Configurable pivot length (default: 2 bars)
Optional directional filter: green candles must break highs, red candles must break lows
2. Root Selection
Toggle individual roots (3, 6, or 9) on/off
Each root has customizable color
Default colors: Blue (3), Green (6), Red (9)
3. Display Options
Marking Style: Labels, Vertical Lines, or Both
Label Text Format:
Root Only (default) - shows just "3", "6", or "9"
Time/Date Only - shows the actual time/date
Root + Time/Date (separate lines) - shows both
Label Background: Toggle colored box behind text (default: OFF)
Chart Background: Toggle colored background highlight (default: OFF)
Text Color: Customizable (default: black)
4. Session Filter:
Set specific hours/minutes for when to display signals
Default: 00:00 to 23:59 (all day)
Useful for focusing on specific trading sessions
5. Hour Offset
Manual adjustment for timezone/DST issues
Range: -12 to +12 hours
Helps align calculations with your preferred timezone
6. Label Placement
Green candles: Label appears above the bar
Red candles: Label appears below the bar
7. Alerts
Four alert conditions available:
Any 3-6-9 root hit
Specific Root 3 hit
Specific Root 6 hit
Specific Root 9 hit
Typical Use Case
Traders use this to identify potential reversal or continuation points when:
A 3/6/9 time occurs
Price breaks a recent swing high/low
Combining this timing signal with other technical analysis
The indicator helps identify "energetic" time windows that may correlate with increased volatility or directional moves.

Cnagda Pure Price ActionCnagda Pure Price Action (CPPA) indicator is a pure price action-based system designed to provide traders with real-time, dynamic analysis of the market. It automatically identifies key candles, support and resistance zones, and potential buy/sell signals by combining price, volume, and multiple popular trend indicators.
How Price Action & Volume Analysis Works
Silver Zone – Logic, Reason, and Trade Planning
Logic & Visualization:
The Silver Zone is created when the closing price is the lowest in the chosen window and volume is the highest in that window.
Visually, a large silver-colored box/rectangle appears on the chart.
Thick horizontal lines (top and bottom) are drawn at the high and low of that candle/bar, extending to the right.
Reasoning:
This combination typically occurs at strong “accumulation” or support areas:
Sellers push the price down to the lowest point, but aggressive buyers step in with high volume, absorbing supply.
Indicates potential exhaustion of selling and likely shift in market control to buyers.
How to Plan Trades Using Silver Zone:
Watch if price returns to the Silver Zone in the future: It often acts as powerful support.
Bullish entries (buys) can be planned when price tests or slightly pierces this zone, especially if new buy signals occur (like yellow/green candle labels).
Place your stop-loss below the bottom line of the Silver Zone.
Target: Look for the nearest resistance or opposing zone, or use indicator’s bullish label as confirmation.
Extra Tip:
Multiple touches of the Silver Zone reinforce its importance, but if price closes deeply below it with high volume, that’s a caution signal—support may be breaking.
Black Zone – Logic, Reason, and Trade Planning (as CPPA):
Logic & Visualization:
The Black Zone is created when the closing price is the highest in the chosen window and volume is the lowest in that window.
Visually, a large black-colored box/rectangle appears on the chart, along with thick horizontal lines at the top (high) and bottom (low) of the candle, extending to the right.
Reasoning:
This combination signals a strong “distribution” or resistance area:
Buyers push the price up to a local high, but low volume means there is not much follow-through or conviction in the move.
Often marks exhaustion where uptrend may pause or reverse, as sellers can soon step in.
How to Plan Trades Using Black Zone:
If price revisits the Black Zone in the future, it often acts as major resistance.
Bearish entries (sells) are considered when price is near, testing, or slightly above the Black Zone—especially if new sell signals appear (like blue/red candle labels).
Place your stop-loss just above the top line of the Black Zone.
Target: Nearest support zone (such as a Silver Zone) or next indicator’s bearish label.
Extra Tip:
Multiple touches of the Black Zone make it stronger, but if price closes far above with rising volume, be cautious—resistance might be breaking.
Support Line – Logic, Reason, and Trade Planning (as Cppa):
Logic & Visualization:
The Support Line is a dynamically drawn dashed line (usually blue) that marks key price levels where the market has previously shown significant buying interest.
The line is generated whenever a candle forms a high price with high volume (orange logic).
The script checks for historical pivot lows, past support zones, and even higher timeframe (HTF) supports, and then extends a blue dashed line from that price level to the right, labeling it (sometimes as “Prev Support Orange, HTF”).
Reasoning:
This line helps you visually identify where demand has been strong enough to hold price from falling further—essentially a floor in the market used by professional traders.
If price approaches or re-tests this line, there’s a good chance buyers will defend it again.
How to Plan Trades Using Support Line:
Watch for price to approach the Support Line during down moves. If you see a bullish candlestick pattern, buy labels (yellow/green), or other indicators aligning, this can be a high-probability entry zone.
Great for planning stop-loss for long trades: place stops just below this line.
Target: Next resistance zone, Black Zone, or the top of the last swing.
Extra Tip:
Multiple confirmations (support line + Silver Zone + bullish label) provide powerful entry signals.
If price closes strongly below the Support Line with volume, be cautious—support may be breaking, and a trend reversal or deeper correction could follow.
Resistance Line – Logic, Reason, and Trade Planning (from CPPA):
Logic & Visualization:
The Resistance Line is a dynamically drawn dashed line (usually purple or red) that identifies price levels where the market has previously faced significant selling pressure.
This line is created when a candle reaches a high price combined with high volume (orange logic), or from a historical pivot high/resistance,
The script also tracks higher timeframe (HTF) resistance lines, labeled as “Prev Resistance Orange, HTF,” and extends these dashed lines to the right across the chart.
Reasoning:
Resistance Lines are visual markers of “supply zones,” where buyers previously failed, and sellers took control.
If the price returns to this line later, sellers may get active again to defend this level, halting the uptrend.
How to Plan Trades Using Resistance Line:
Watch for price to approach the Resistance Line during up moves. If you see bearish candlestick patterns, sell labels (blue/red), or bearish indicator confirmation, this becomes a strong shorting opportunity.
Perfect for placing stop-loss in short trades—put your stop just above the Resistance Line.
Target: Next support zone (Silver Zone) or bottom of the last swing.
If the price breaks above with high volume, avoid shorting—resistance may be failing.
Extra Tip:
Multiple resistances (Resistance Line + Black Zone + bearish label) make short signals stronger.
Choppy movement around this line often signals indecision; wait for a clear rejection before entering trades.
Bullish / Bearish Label – Logic, Reason, and Trade Planning:
Logic & Visualization:
The indicator constantly calculates a "Bull Score" and a "Bear Score" based on several factors:
Trend direction from price slope
Confirmation by popular indicators (RSI, ADX, SAR, CMF, OBV, CCI, Bollinger Bands, TWAP)
Adaptive scoring (higher score for each bullish/bearish condition met)
If Bull Score > Bear Score, the chart displays a green "BULLISH" label (usually below the bar).
If Bear Score > Bull Score, the chart displays a red "BEARISH" label (usually above the bar).
If neither dominates, a "NEUTRAL" label appears.
Reasoning:
The labels summarize complex price action and indicator analysis into a simple, actionable sentiment cue:
Bullish: Majority of conditions indicate buying strength; trend is up.
Bearish: Majority signals show selling pressure; trend is down.
How to Use in Trade Planning:
Use the Bullish label as confirmation to enter or hold long (buy) positions, especially if near support/Silver Zone.
Use the Bearish label to enter/hold short (sell) positions, especially if near resistance/Black Zone.
For best results, combine with candle color, volume analysis, or other labels (yellow/green for buys, blue/red for sells).
Avoid trading against these labels unless you have strong confluence from zones/support levels.
Yellow Label (Buy Signal) – Logic, Reason & Trade Planning:
Logic & Visualization:
The yellow label appears below a candle (label.style_label_up, yloc.belowbar) and marks a potential buy signal.
Script conditions:
The candle must be a “yellow candle” (which means it’s at the local lowest close, not a high, with normal volume).
Volume is decreasing for 2 consecutive candles (current volume < previous volume, previous volume < second previous).
When these conditions are met, a yellow label is plotted below the candle.
Reasoning:
This scenario often marks the end of selling pressure and start of possible accumulation—buyers may be stepping in as sellers exhaust.
Decreasing volume during a local price low means selling is slowing, possibly hinting at a reversal.
How to Trade Using Yellow Label:
Entry: Consider buying at/just above the yellow-labeled candle’s close.
Stop-loss: A bit below the candle’s low (or Silver Zone line, if present).
Target: Next resistance level, Black Zone, or chart’s bullish label.
Extra Tip:
If the yellow label is found at/near a Silver Zone or Support Line, and trend is “Bullish,” the setup gets even stronger.
Avoid trading if overall indicator shows “Bearish.”
Green Label (Buy with Increasing Volume) – Logic, Reason & Trade Planning:
Logic & Visualization:
The green label is plotted below a candle (label.style_label_up, yloc.belowbar) and marks a strong buy signal.
Script conditions:
The candle must be a “yellow candle” (at the local lowest close, normal volume).
Volume is increasing for 2 consecutive candles (current volume > previous volume, previous volume > second previous).
When these conditions are met, a green label is plotted below the candle.
Reasoning:
This scenario signals that buyers are stepping in aggressively at a local price low—the end of a downtrend with strong, rising activity.
Increasing volume at a price low is a classic sign of accumulation, where institutions or large players may be buying.
How to Trade Using Green Label:
Entry: Consider buying at/just above the green-labeled candle’s close for a momentum-based reversal.
Stop-loss: Slightly below the candle’s low, or the Silver Zone/support line if present.
Target: Nearest resistance zone/Black Zone, indicator’s bullish label, or next swing high.
Extra Tip:
If the green label is near other supports (Silver Zone, Support Line), the setup is extra strong.
Use confirmation from Bullish labels or trend signals for best results.
Green label setups are suitable for quick, high momentum trades due to increasing volume
Blue Label (Sell Signal on Decreasing Volume) – Logic, Reason & Trade Planning:
Logic & Visualization:
The blue label is plotted above a candle (label.style_label_down, yloc.abovebar) as a potential sell signal.
Script conditions:
The candle is a “blue candle” (local highest close, but not also lowest, and volume is neither highest nor lowest).
Volume is decreasing over 2 consecutive candles (current volume < previous, previous < two ago).
When these match, a blue label appears above the candle.
Reasoning:
This typically signals buyer exhaustion at a local high: price has gone up, but volume is dropping, suggesting big players may not be buying any more at these levels.
The trend is losing strength, and a reversal or pullback is likely.
How to Trade Using Blue Label:
Entry: Look to sell at/just below the candle with the blue label.
Stop-loss: Just above the candle’s high (or above the Black Zone/resistance if present).
Target: Nearest support, Silver Zone, or a swing low.
Extra Tip:
Blue label signals are stronger if they appear near Black Zones or Resistance Lines, or when the general market label is "Bearish."
As with buy setups, always check for confirmation from trend or volume before trading aggressively.
Here’s a summary of all key chart labels, zones, and trading logic of your Price Action script:
Silver Zone: Powerful support zone. Created at lowest close + highest volume. Best for buy entries near its lines.
Black Zone: Strong resistance zone. Created at highest close + lowest volume. Ideal for short trades near its levels.
Support Line: Blue dashed line at historical demand; buyers defend here. Look for bullish setups when price approaches.
Resistance Line: Purple/red dashed line at supply; sellers defend here. Great for bearish setups when price nears.
Bullish/Bearish Labels: Summarize trend direction using price action + multiple indicator confirmations. Plan buys, holds on bullish; sells, shorts on bearish.
Yellow Label: Buy signal on decreasing volume and local price low. Entry above candle, stop below, target next resistance.
Green Label: Strong buy on increasing volume at a price low. Entry for momentum trade, stop below, target next zone.
Blue Label: Sell signal on dropping volume and local price high. Entry below candle, stop above, target next support.
Best Practices:
Always combine zone/label signals for higher probability trades.
Use stop-loss near zones/lines for risk management.
Prefer trading in the trend direction (bullish/bearish label agrees with your entry).
if Any Question, Suggestion Feel free to ask
Disclaimer:
All information provided by this indicator is for educational and analysis purposes only, and should not be considered financial advice.

Project Pegasus RevenantDescription
Project Pegasus Revenant is a reversal and liquidity-trap detection system combining a configurable fractal reversal engine with the SweepTrigger liquidity finder. It highlights potential structural turning points and stop-hunt scenarios directly on the chart.
What’s unique
Fractal Reversal Engine: Adjustable strictness (1 = loose, 5 = strict) to fit different market conditions.
Signal Filtering: Minimum bar spacing to avoid clustering of false or repeated signals.
SweepTrigger Add-on: Detects liquidity sweeps with wick-based rejection logic, auto-doji detection, and range-strength confirmation.
Dual Signal Output: Circle markers for pure fractal reversals, triangles for sweep-based liquidity traps.
Adaptive Filters: Customizable thresholds for body size, candle range, and sweep strength.
How it works (technical)
Fractals: A reversal fractal is confirmed when the high/low at position n is surrounded by lower/higher highs/lows across a configurable frontier.
Signal confirmation: Once price trades back through the fractal level within a limited number of bars, a potential reversal is triggered.
Bar filter: Signals require a minimum distance in bars to prevent noise.
SweepTrigger logic:
Wick comparison (upper vs lower) determines rejection direction.
Doji and low-body candles are auto-filtered.
Range check ensures the current candle exceeds a configurable multiple of the average range.
Visuals:
Green/Red circles = fractal reversals.
Cyan/Purple triangles = liquidity sweep triggers.
How to use
Watch fractal signals to anticipate structural reversal points.
Combine SweepTrigger signals with liquidity highs/lows for identifying stop hunts and fakeouts.
Use as standalone reversal tool or as confirmation within a broader system (e.g., order blocks, volume profile, or market structure).
Key settings
Reversal Mode: 1–5 (controls strictness of fractals).
SweepTrigger: On/off toggle, lookback window, body-size filter, range strength multiplier.
Visuals: Shapes, sizes, and color-coded signals for clear separation between fractal and sweep triggers.
Notes & limitations
Works on all timeframes.
Signals are reactive (based on confirmed bars), not predictive — no lookahead logic.
Too strict settings may reduce signal frequency; too loose may increase noise.
Disclaimer
For educational and informational purposes only. Not financial advice.

CNagda Anchor2EntryCNagda Anchor2Entry Pine Script v6 overlay indicator pulls higher-timeframe (HTF) signal events to define anchor high/low levels and then projects visual entry labels on the lower-timeframe (LTF). It also draws auto-oriented Fibonacci retracement/extension levels for context, but it does not execute orders, stops, or targets—only visual guidance.
Inputs
Key inputs include Lookback Length for HTF scanning and a Signal Timeframe used with request.security to import HTF events onto the active chart.
Entry behavior can be set to “Confirm only” or “Wait candle,” trade side can be restricted to Buy/Sell/Both, and individual strategies (Buy WAIT/S1; Sell REV/S1/S2/S3) can be toggled.
HTF logic
The script defines WAIT/BUY setup and confirmation, SELL reversal on breaking the WAIT BUY low, and several volume/candle-based patterns (Sell S1/S2/S3, Buy S1).
It captures the associated highs/lows at those events with ta.valuewhen and imports them via request.security to form anchors (anc_hi/anc_lo) and “new trigger” booleans that gate label creation on the LTF.
Flip entries
When enabled, “Flip entries” generate contrarian labels based on breaking or confirming HTF anchors: crossing above anc_hi can trigger a flip-to-sell label, and crossing below anc_lo can trigger a flip-to-buy label.
The flip mode supports Immediate (on cross) or Confirm (on sustained break) to control how strict the trigger is.
Fibonacci drawing
User-specified Fib levels are parsed from a string, safely converted to floats, and drawn as dotted horizontal lines only when they fall inside an approximate visible viewport. Orientation (up or down) is decided automatically from pending signal direction and a simple context score (candle bias, trend, and price vs. mid), with efficient redraw/clear guards to avoid clutter.
Dynamic anchors
If HTF anchors are missing or too far from current price (checked with an ATR-based threshold), the script falls back to local swing highs/lows to keep the reference range relevant. This dynamic switch helps Fib levels and labels remain close to current market structure without manual intervention.
Signal labels
Labels are created only on confirmed bars to avoid repainting noise, with one “latest” label kept by deleting the previous one. The script places BUY/SELL labels for WAIT/CONFIRM, direct HTF patterns (Buy S1, Sell S1/S2/S3), and contrarian flip events, offset slightly from highs/lows with clear coloring and configurable sizes.
Visual context
Bars are softly colored (lime tint for bullish, orange tint for bearish) for quick context, and everything renders as an overlay on the price chart. Fib labels include a Δ readout (distance from current close), and line extension length, label sizes, and viewport padding are adjustable.
How to use
Set the Signal Timeframe and Lookback Length to establish which HTF structures and ranges will drive the anchors and entry conditions. Choose entry flow (Wait vs Confirm), enable Flip if contrarian triggers are desired, select the trade side, toggle strategies, and customize Fibonacci levels plus dynamic-anchor fallback for practical on-chart guidance.
Notes
This is a visual decision-support tool; it does not place trades, stops, or targets and should be validated on charts before live use. It is written for Pine Script v6 and relies heavily on request.security for HTF-to-LTF transfer of signals and anchors.

Mean Reversion Probability Zones [BigBeluga]🔵 OVERVIEW
The Mean Reversion Probability Zones indicator measures the likelihood of price reverting back toward its mean . By analyzing oscillator dynamics (RSI, MFI, or Stochastic), it calculates probability zones both above and below the oscillator. These zones are visualized as histograms, colored regions on the main chart, and a compact dashboard, helping traders spot when the market is statistically stretched and more likely to revert.
🔵 CONCEPTS
Mean Reversion : The tendency of price to return to its average after significant extensions.
Oscillator-Based Analysis : Uses RSI, MFI, or Stochastic as the base signal for detecting overextension.
Probability Model : The probability of reversion is computed using three factors:
Whether the oscillator is rising or declining.
Whether the oscillator is above or below user-defined thresholds.
The oscillator’s actual value (distance from equilibrium).
Dual-Zone Output :
Upper histogram = probability of downward mean reversion.
Lower histogram = probability of upward mean reversion.
Historical Extremes : The dashboard highlights the recent maximum probability values for both upward and downward scenarios.
🔵 FEATURES
Oscillator Choice : Switch between RSI, MFI, and Stochastic.
Customizable Zones : User-defined upper/lower thresholds with independent colors.
Probability Histograms :
Above oscillator → down reversion probability.
Below oscillator → up reversion probability.
Colored Gradient Zones on Chart : Visual overlays showing where mean reversion probabilities are strongest.
Probability Labels : Percentages displayed next to histogram values for clarity.
Dashboard : Compact table in the corner showing the recent maximum probabilities for both upward and downward mean reversion.
Overlay Compatibility : Works in both chart pane and sub-pane with oscillators.
🔵 HOW TO USE
Set Oscillator : Choose RSI, MFI, or Stochastic depending on your strategy style.
Adjust Zones : Define upper/lower bounds for when oscillator values indicate strong overbought/oversold conditions.
Interpret Histograms :
Orange (upper) histogram → higher chance of a pullback/downward mean reversion.
Green (lower) histogram → higher chance of upward reversion/bounce.
Watch Gradient Zones : On the main chart, shaded areas highlight where probability of mean reversion is elevated.
Consult Dashboard : Use the “Recent MAX” values to understand how strong recent reversion probabilities have been in either direction.
Confluence Strategy : Combine with support/resistance, order flow, or trend filters to avoid counter-trend trades.
🔵 CONCLUSION
The Mean Reversion Probability Zones provides traders with an advanced way to quantify and visualize mean reversion opportunities. By blending oscillator momentum, threshold logic, and probability calculations, it highlights when markets are statistically stretched and primed for reversal. Whether you are a contrarian trader or simply looking for exhaustion signals to fade, this tool helps bring structure and clarity to mean reversion setups.

PowerDelta Oscillator [FxScripts]PowerDelta Oscillator
The PowerDelta Oscillator measures real-time buying and selling pressure using the proprietary PowerDelta Algorithm. By quantifying order flow, it identifies whether the market conditions favor bullish or bearish activity, helping traders determine directional bias for both trend and countertrend setups.
Calculation Methodology
The PowerDelta computes the delta (difference) between buying and selling pressure by integrating both price movement and volume behavior rather than relying solely on volume or price-based approximations like other oscillators.
The PowerDelta Algorithm evaluates six core price-volume conditions:
Price advancing with increasing volume
Price advancing with decreasing volume
Price consolidating with increasing volume
Price consolidating with decreasing volume
Price declining with increasing volume
Price declining with decreasing volume
From these conditions, the algorithm derives:
Accumulation vs Distribution phases
Buyer/Seller exhaustion points
Effort vs No Result scenarios (volume pressure failing to move price)
Operational Use
The PowerDelta Oscillator has three operational modes:
Trend
Countertrend
Blended (Trend/Countertrend hybrid)
Trend Mode
In Trend Mode, the indicator plots an oscillator that fluctuates between positive and negative values:
Positive readings indicate dominant buying pressure
Negative readings indicate dominant selling pressure
The magnitude of the reading reflects the intensity of the pressure
Crossovers at the zero line provide directional shifts:
Negative → Positive: bullish transition
Positive → Negative: bearish transition
Additionally:
Sustained positive values indicate control by buyers, long bias is favoured
Sustained negative values indicate control by sellers, short bias is favoured
The magnitude of displacement from zero provides additional confirmation of market strength or weakness
Countertrend Mode
In Countertrend Mode, the primary use of the PowerDelta Oscillator is to locate divergences between price and the oscillator (as visualised on the chart above) which helps traders pinpoint potential reversals
The oscillator is much more sensitive in this mode, making highs, lows and hence divergences, easier to spot
Like Trend Mode, the magnitude of displacement from zero provides additional confirmation of market strength or weakness
The various Analytical Scenarios detailed below provide detailed use cases for both Trend and Countertrend Mode
Blended Mode
To provide maximum flexibility, there’s also a third Blended Mode
This mode combines elements of the two primary modes and can be used as part of a hybrid approach making it easier to spot both trends and reversals
Alternative Source
The PowerDelta algorithm utilises volume data therefore it’s best to use the most reliable source of volume data for the instrument being traded
For instance, whilst XAUUSD provides excellent results with most forex brokers, slightly better results may be achieved using GC futures data which comes direct from the exchange (data package required)
To use a third-party source, select 'Alternative' and input the relevant source
This can also be used as a way to monitor correlated pairs by adding two instances of the PowerDelta to the same chart, selecting pair 1 e.g. EURUSD as the first instance and the correlated pair e.g. USDCHF as the second instance
Thorough backtesting advised
Analytical Scenarios
Accumulation: High positive oscillator readings combined with upward price movement suggest active accumulation.
Optimal strategy: Monitor pullbacks for potential long entries or wait for a divergence with price and potential reversal.
Distribution: High negative oscillator readings with downward price movement indicate distribution.
Optimal strategy: Monitor pullbacks for potential short entries or wait for a divergence with price and potential reversal.
Buyer Exhaustion: Price forms higher highs while oscillator value declines. Indicates weakening buying strength and potential bearish reversal.
Seller Exhaustion: Price forms lower lows while oscillator value contracts. Indicates weakening selling strength and potential bullish reversal.
Effort / No Result (Buyers): Positive oscillator expansion without higher highs indicates aggressive buying without price confirmation, suggesting overbought conditions and a potential bearish reversal.
Effort / No Result (Sellers): Negative oscillator expansion without lower lows indicates aggressive selling without price confirmation, suggesting oversold conditions and a potential bullish reversal.
Alerts
To trigger alerts when market bias transitions across the zero line:
Right-click on chart → Add Alert on PowerDelta
Condition: PowerDelta → Select Mode
Type: Crossing
Value: 0
Execution: Once Per Bar Close
Adjust additional parameters as required
Performance and Optimization
Backtesting Results: The PowerDelta Oscillator has undergone extensive backtesting across various instruments, timeframes and market conditions, demonstrating strong performance in identifying strong trends and reversals. User backtesting is strongly encouraged as it allows traders to optimize settings for their preferred instruments and timeframes.
Optimization for Diverse Markets: The PowerDelta Oscillator can be used on crypto, forex, indices, commodities and stocks. The PowerDelta Oscillator's algorithmic foundation ensures consistent performance across a variety of instruments. The Trend, Countertrend and Blended Modes make it easy for the trader to set up based on their individual trading style.
Educational Resources and Support
Users of the PowerDelta Oscillator benefit from comprehensive educational resources and full access to FxScripts Support. This ensures traders can maximize the potential of the PowerDelta Oscillator and other tools in the Sigma Indicator Suite by learning best practices and gaining insights from an experienced team of traders.

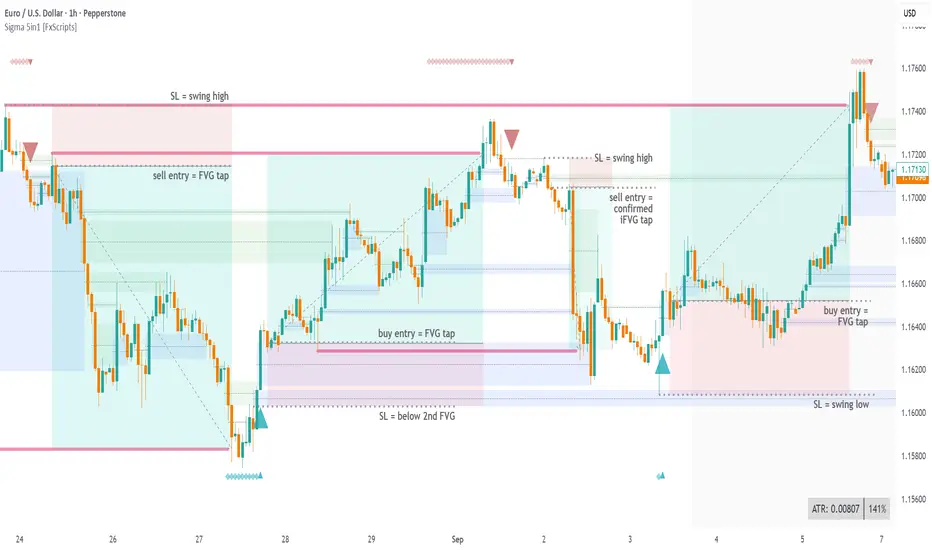
Sigma Reversal Print [FxScripts]Indicator Overview
The Sigma Reversal Print is a powerful tool designed for traders who like to trade reversal strategies plus trend traders looking to enter on strong pullbacks. It integrates advanced price action with volume analysis, highlighting areas where a trend reversal or pullback may be in progress, providing insights into where markets may be exhausted or about to surge.
Key Features and Functionality
Reversal Trading: Tailored primarily for reversal traders, the Sigma Reversal Print highlights zones where the market is likely to change direction. While this approach offers significant potential, it inherently carries a degree of risk due to the precision required in predicting market turning points. The Sigma Reversal Print uses advanced methodology to forecast such reversals with a high degree of accuracy.
Signal Generation Based on Reversal and Pullback Zones: The Reversal Print generates signals when price enters specific conditions, representing exhaustion followed by a change in order flow. These conditions allow the indicator to filter out low-probability signals and focus on those with higher potential for a trend change.
Settings
Sensitivity Control: The sensitivity setting allows traders to adjust the strength of the pattern required for a signal to be generated. The scale ranges from 2-10 with higher sensitivity demanding more confirmation, leading to fewer, generally more reliable, signals however backtesting is highly recommended. Adjusting the sensitivity enables traders to balance early entries with signal accuracy, accommodating both aggressive and more conservative strategies.
Customizable Length: The length setting allows users to fine-tune the calculation period, adjusting the indicator’s responsiveness to overall market conditions. Adjusting length allows the Reversal Print to adapt to the user’s trading style and timeframe of choice. Similar to the sensitivity control, the scale ranges from 2-10 with a higher length demanding more confirmation. This can lead to fewer, often more reliable, signals however, once again, backtesting is highly recommended.
Advanced Filters
Opening Gap Filter: Turning this on allows the system to avoid painting false signals that can be triggered by the daily or weekly opening gap at market open. This setting is toggled on by default.
Price Filter: This filter applies an additional weighted price action algorithm to the signal being painted thus further filtering out weaker signals. Warning dots will still paint however the larger break arrow will no longer paint if the filter is triggered. This setting is toggled on by default.
Volume Filter: This filters out low volume entries which have a lower probability of turning into successful trades. Variable from 1-10 with 1 being the most lenient and 10 the most stringent. Warning dots will still paint however the larger break arrow will no longer paint if the filter is triggered. This setting is toggled on by default.
Alerts
Configure alerts and receive notifications when the first warning dot in a sequence appears (the series of dots seen on the chart) and again when a breakpoint is triggered (the larger arrow on the chart). This feature is particularly beneficial for traders who like to monitor multiple instruments or prefer not to stare at a screen all day.
Performance and Optimization
Backtesting Results: The Reversal Print has undergone extensive backtesting across various instruments, timeframes and market conditions, demonstrating strong performance in identifying reversal points, particularly during volatile or overextended price movements. User backtesting is strongly encouraged as it allows traders to optimize settings for their preferred instruments and timeframes.
Optimization for Diverse Markets: The Reversal Print can be used on crypto, forex, indices, commodities or stocks. The Reversal Print's algorithmic foundation ensures consistent performance across a variety of instruments. Key settings such as Sensitivity and Length will require adjustment based on the volatility and characteristics of each market.
Educational Resources and Support
Users of the Sigma Reversal Print benefit from comprehensive educational resources and full access to FxScripts Support. This ensures traders can maximize the potential of the Reversal Print and other tools in the Sigma Indicator Suite by learning best practices and gaining insights from an experienced team of traders.
Summary
The Reversal Print is a powerful and adaptable tool for reversal and pullback traders, combining statistical analysis and price action to identify high-probability turning points. Its advanced customization options, flexible controls and integration with the Sigma Indicator Suite offer significant advantages over standard indicators. By pinpointing precise entry points, the Reversal Print enables traders to make informed trading decisions with confidence.
Daily Bias on 5 minutes Reversal StrategyThis strategy combines higher-timeframe bias (daily and 1-hour) with 5-minute reversal signals to identify intraday trades. It aims to capitalize on false breakouts of the previous day's high/low, with strict risk management (Strict position sizing, max risk cap, and R:R enforcement), Avoids Over-Trading (1 trade/day rule prevents chasing), SL buffer adapts to volatility.
#1. This strategy does not utilize indicators. We will use the daily (D) price range and look for breakout attempts and rejections at the extreme points on the lower time frame (1h). If rejection occurs, it establishes our bias (bullish or bearish). For final confirmation, we move to the 5-minute timeframe to observe attempts to retest that daily price range. If significant rejection occurs again, that becomes our entry point.
#2. When rejection occurs, the 1-hour candle may form a new extreme point (low/high). Therefore, we will no longer use the daily price range as our trade exit point but instead the new extreme level established after the breakout attempt and price rejection.
To prevent premature trade exits, we also add an SL buffer using ATR while still capping the maximum acceptable risk per trade (as a percentage). Take profit is calculated using a risk-to-reward ratio, with a default setting of 1.5x.
#3. Key Input Parameters
a. Timeframes :
1. Daily TF ((Anchor for daily high/low (default: D).)
2. 1H Bias TF (Bias confirmation timeframe (default: 60))
3. Execution TF (Entry signal timeframe (default: 5, should match chart).
b. Trade Management
1. SL Buffer ATR Multiplier (Buffer beyond swing low/high (default: 6.0))
2. Min ATR Threshold (Minimum buffer size (default: 1.0))
3. Risk Reward Ratio (TP distance multiplier (default: 1.5))
4. Max Risk Allowed (Max risk % of entry (default: 3.0%))
Lookback Bars for SL Bars for swing low/high (default: 60))
c. Break Thresholds
1. 1H Candle Break Threshold (ATR multiplier for 1H break (default: 0.75))
2. 5M Candle Break Threshold (ATR multiplier for 5M break (default: 0.5))

3 Bar Reversal3 Bar Reversal
This pattern is described in John Carter's "Mastering the Trade"
The 3 Bar Reversal indicator is a simple but effective price action tool designed to highlight potential short-term reversals in market direction. It monitors consecutive bar behavior and identifies turning points based on a three-bar pattern. This tool can assist traders in spotting trend exhaustion or early signs of a reversal, particularly in scalping or short-term trading strategies.
How It Works
This indicator analyzes the relationship between consecutive bar closes:
It counts how many bars have passed since the price closed higher than the previous close (barssince(close >= close )) — referred to as an "up streak".
It also counts how many bars have passed since the price closed lower than the previous close (barssince(close <= close )) — known as a "down streak".
A reversal condition is met when:
There have been exactly 3 bars in a row moving in one direction (up or down), and
The 4th bar closes in the opposite direction.
When this condition is detected, the script performs two actions:
Plots a triangle on the chart to signal the potential reversal:
A green triangle below the bar for a possible long (buy) opportunity.
A red triangle above the bar for a possible short (sell) opportunity.
Triggers an alert condition so users can set notifications for when a reversal is detected.
Interpretation
Long Signal: The market has printed 3 consecutive lower closes, followed by a higher close — suggesting bullish momentum may be emerging.
Short Signal: The market has printed 3 consecutive higher closes, followed by a lower close — indicating possible bearish momentum.
These patterns are common in market retracements and can act as confirmation signals when used with other indicators such as RSI, MACD, support/resistance, or volume analysis.
Usage Examples
Scalping: Use the reversal signal to quickly enter short-term trades after a short-term exhaustion move.
Swing Trading: Combine this with trend indicators (e.g., moving averages) to time pullbacks within larger trends.
Confirmation Tool: Use this indicator alongside candlestick patterns or support/resistance zones to validate entry or exit points.
Alert Setup: Enable alerts based on the built-in alertcondition to receive instant notifications for potential trade setups.
Limitations
The 3-bar reversal logic does not guarantee a trend change; it signals potential reversals, which may need confirmation.
Best used in conjunction with broader context such as trend direction, market structure, or other technical indicators.

Head & Shoulders Pattern (Zeiierman)█ Overview
The Head & Shoulders Pattern (Zeiierman) is an advanced pattern recognition tool that automatically detects and visualizes one of the most powerful reversal patterns in technical analysis — the classic Head & Shoulders and Inverse Head & Shoulders formations .
This indicator brings structure clarity directly onto the price chart, allowing traders to instantly spot potential major reversal zones without manually drawing or searching for patterns.
It doesn't just draw lines — it intelligently scans price action for symmetry, pivot behavior, and neckline structures — then projects realistic price targets based on the pattern's height.
⚪ In simple terms:
▸ Standard Head & Shoulders → Bearish Reversal Pattern
▸ Inverse Head & Shoulders → Bullish Reversal Pattern
▸ Target Projection → Estimated Move from Neckline Break
▸ Labels → Clear annotation of Left Shoulder, Head, and Right Shoulder
█ How It Works
The indicator combines multiple technical detection layers into a clean visual model:
⚪ Dynamic Pivot Engine
Automatically detects pivot highs and lows based on user-defined Period.
Longer Period = Broader, higher-confidence patterns
Shorter Period = Smaller, more frequent patterns
⚪ Pattern Detection Logic
Scans pivot structures in real-time to identify valid:
Bearish Head & Shoulders (H&S)
Bullish Inverse Head & Shoulders (iH&S)
Conditions include:
▸ Symmetry validation
▸ Head above (or below) Shoulders
▸ Neckline structure
▸ Minimum price conditions met
█ How to Use
⚪ Reversal Trading
Look for Head & Shoulders at the top of an uptrend
Look for Inverse Head & Shoulders at the bottom of a downtrend
⚪ What makes our tool truly unique is that it goes beyond the traditional textbook definition.
Our custom Head & Shoulders algorithm is built with flexibility and adaptability in mind. It dynamically responds to real-time price action, allowing it to detect valid patterns not only at major trend reversals — but also within trending environments.
That means you can spot Head & Shoulders formations at:
Consolidation zones
Trend continuation areas
Corrective phases within established trends
It doesn’t have to be the absolute top or bottom of a move — and that’s the real power of this tool. It adapts. It evolves. It finds structure where most indicators stay blind.
█ Common Real-World Stop Loss Strategies with Head & Shoulders Patterns
Not all Head & Shoulders patterns are created equal — and neither are the stop loss strategies used to trade them.
Depending on your trading style, risk tolerance, and market context — here are the 3 most common ways traders manage stop placement when trading Head & Shoulders (H&S) or Inverse Head & Shoulders (iH&S) patterns:
⚪ Conservative Stop Placement
Maximum Safety — Minimum Chance of Being Stopped Prematurely
Stop Placement:
Above the Head (Bearish H&S)
Below the Head (Bullish iH&S)
Pros: Safest approach. Provides maximum protection against false breakouts and noise.
Cons: Often results in very large stop losses, especially on bigger patterns or higher timeframes. Risk-to-Reward (RR) can be poor unless the target is far.
⚪ Aggressive Stop Placement
Tighter Risk — Faster Invalidations
Stop Placement:
Above the Right Shoulder (Bearish H&S)
Below the Right Shoulder (Bullish iH&S)
Pros: Smaller stop losses. Improved RR. Ideal for traders who want tighter control over risk.
Cons: Higher chance of getting stopped on retests or minor volatility around the neckline zone.
⚪ Neckline Reclaim Invalidation
Dynamic & Price-Action Based Exit
Stop Placement:
Exit the trade if price closes back above (bearish) or below (bullish) the neckline after breaking it.
Pros: Dynamic approach based on market behavior rather than static levels. Allows more flexibility.
Cons: Requires active trade management. Not suitable for fully automated or set-and-forget trading styles.
█ Why It's Useful
This is not a basic pattern drawing tool — it's a complete detection system built for traders who want to:
Automatically detect powerful reversal patterns
Avoid the subjectivity of manually drawing H&S structures
Trade with clear target projections
Identify high-probability reversal zones
Visually map structure shifts in real-time
█ Settings
Pivot Detection
Period → Number of bars used to scan for pivots (Higher = Bigger patterns)
Pattern Detection
Enable Bullish Head & Shoulders
Enable Bearish Head & Shoulders
Visualization
Customize Colors (Lines, Fills, Labels)
Enable/Disable Labels
Pattern Style: Closed / Open
Custom Label Colors
Target Projection
Enable/Disable Target Projection
Customize Target Colors
-----------------
Disclaimer
The content provided in my scripts, indicators, ideas, algorithms, and systems is for educational and informational purposes only. It does not constitute financial advice, investment recommendations, or a solicitation to buy or sell any financial instruments. I will not accept liability for any loss or damage, including without limitation any loss of profit, which may arise directly or indirectly from the use of or reliance on such information.
All investments involve risk, and the past performance of a security, industry, sector, market, financial product, trading strategy, backtest, or individual's trading does not guarantee future results or returns. Investors are fully responsible for any investment decisions they make. Such decisions should be based solely on an evaluation of their financial circumstances, investment objectives, risk tolerance, and liquidity needs.