RePaNoCHa V4 [Alerts]Script for automatic trading with Alerts.
LG --> Long (green: not confirmed) (lime: confirmed)
ST --> Short (maroon: not confirmed) (red: confirmed)
TS --> Trailing Stop
xL --> Close Long Position
xS --> Close Short Position
SL --> Stop Loss
The trailing stop closes the trade if the price changes direction by a specified percentage or offset. There is no ideal distance because markets and price are always changing and we know that is impossible to exit on the top or bottom. This script interpolate the trailing Stop Offset with profit, higher profit --> higher Trailing Stop Offset. Despite this, it's difficult to catch the price but not impossible. It has a TS delay too. It take a snapshot every X seconds, if the TS is activated the alert is triggered, otherwise the price keeps fluctuating until a new snapshot.
It can be easily converted to Backtest. Just delete "//" on the corresponding part.
Default settings for XBT:USD at 1H.
SAR

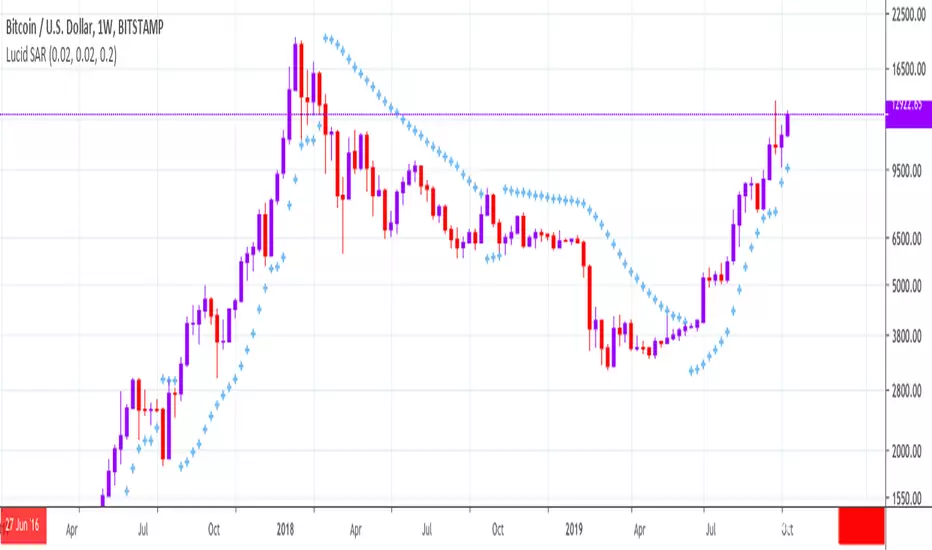
Lucid SARI wrote this script after having listened to Hyperwave with Sawcruhteez and Tyler Jenks of Lucid Investments Strategies LLC on July 3, 2019. They felt that the existing built-in Parabolic SAR indicator was not doing its calculations properly, and they hoped that someone might help them correct this. So I tried my hand at it, learning Pine Script as I went. I worked on it through the early morning hours and finished it by 4 am on July 4, 2019. I've added a few bits of code since, adding the rule regarding the SAR not advancing beyond the high (low) of the prior two candles during an uptrend (downtrend), but the core script is as it was.
This code is open source under the MIT license. If you have any improvements or corrections to suggest, please send me a pull request via the github repository github.com
For more details on the initial script, see
Sawcruhteez from Lucid Investment Strategies wrote the following description of the Parabolic SAR, where the quotes are from Section II of J. Welles Wilder, Jr.'s book New Concepts in Technical Trading Systems (1978)
--------------------------------------------------------------------------------------------------------------------------
Parabolic SAR
"The Parabolic Time / Price System derives its name from the fact that when charted, the
pattern formed by the stops resembles a parabola, or if you will, a French Curve. The system
allows room for the market to react for the first few days after a trade is initiated and then the
stop begins to move up more rapidly. The stop is not only a function of price but also a function
of time .
"The stop never backs up. It moves an incremental amount each day, only in the direction which
the trade has been initiated."
"The stop is also a function of price because the distance the stop moves up is relative to the
favorable distance the price has moved... specifically, the most favorable price reached since the
trade was initiated."
A. The calculation for a bullish Parabolic SAR is:
Tomorrow’s SAR = Today’s SAR + AF(EP - Today’s SAR)
"Acceleration Factor (AF) is one of a progression of numbers beginning at 0.02 and ending at
0.20. The AF is increased by 0.02 each period that a new high is made" (if long) or new low is
made (if short).
EP is the "Extreme Price Point for the trade made so far. If Long , EP is the extreme high price for
the trade; if Short , EP is the extreme low price for the trade.”
Most websites will provide the above calculation for the Parabolic SAR but almost all of them
leave out this crucial detail:
B. "Never move the SAR into the previous day’s range or today’s range
"1. If Long , never move the SAR for tomorrow above the previous day’s low or
today’s low . If the SAR is calculated to be above the previous day’s low or
today’s low, then use the lower low between today and the previous day as
the new SAR. Make the next days calculations based upon this SAR.
"2. If Short , never move the SAR for tomorrow below the previous day’s high or
today’s high . If the SAR is calculated to be below the previous days’ high or
today’s high, then use the higher high between today and the previous day
as the new SAR. Make the next days calculations based upon this SAR."
When a Bullish SAR is broken then it gets placed at the SIP (significant point) of the prior trend.
In otherwords it is placed above the current candle and at the price that was the SIP.
The inverse is true for the first Bullish SAR.
"This system is a true reversal system; that is, every stop point is also a reverse point." If breaking
through a bearish SAR (one above price) that simultaneously signals to close a short and go
long.

Casey's Parabolic SARI whipped together this script after having listened to Hyperwave with Sawcruhteez and Tyler Jenks in the evening on July 3, 2019. They felt that the existing Parabolic SAR was not doing its calculations properly, and they hoped that someone might help them correct this. So I tried my hand at it, learning Pine as I went. I don't know if this script works properly (so don't use it!), but it does show a trend change on the weekly this week as it apparently should. I'm making the script public so that Sawcruhteez and Tyler Jenks can take a look at it.
MIT License
Copyright (c) 2019 Casey Bowman
Permission is hereby granted, free of charge, to any person obtaining a copy
of this software and associated documentation files (the "Software"), to deal
in the Software without restriction, including without limitation the rights
to use, copy, modify, merge, publish, distribute, sublicense, and/or sell
copies of the Software, and to permit persons to whom the Software is
furnished to do so, subject to the following conditions:
The above copyright notice and this permission notice shall be included in all
copies or substantial portions of the Software.
THE SOFTWARE IS PROVIDED "AS IS", WITHOUT WARRANTY OF ANY KIND, EXPRESS OR
IMPLIED, INCLUDING BUT NOT LIMITED TO THE WARRANTIES OF MERCHANTABILITY,
FITNESS FOR A PARTICULAR PURPOSE AND NONINFRINGEMENT. IN NO EVENT SHALL THE
AUTHORS OR COPYRIGHT HOLDERS BE LIABLE FOR ANY CLAIM, DAMAGES OR OTHER
LIABILITY, WHETHER IN AN ACTION OF CONTRACT, TORT OR OTHERWISE, ARISING FROM,
OUT OF OR IN CONNECTION WITH THE SOFTWARE OR THE USE OR OTHER DEALINGS IN THE
SOFTWARE.
SMA/pivot/Bollinger/MACD/RSI en pantalla gráficoMulti-indicador con los indicadores que empleo más pero sin añadir ventanas abajo.
Contiene:
Cruce de 3 medias móviles
La idea es no tenerlas en pantalla, pero están dibujadas también. Yo las dejo ocultas salvo que las quiera mirar para algo.
Lo que presento en pantalla es la media lenta con verde si el cruce de las 3 marca alcista, amarillo si no está claro y rojo si marca bajista.
Pivot
Normalmente los tengo ocultos pero los muestro cuando me interesa. Están todos aunque aparezcan 2 seguidos.
Bandas de Bollinger
No dibujo la línea central porque empleo la media como tal.
Parabollic SAR
Lo empleo para dibujar las ondas de Elliott como postula Matías Menéndez Larre en el capítulo 11 de su libro "Las ondas de Elliott". Así que, aunque se puede mostrar, lo mantengo oculto y lo que muestro es dónde cambia (SAR cambio).
MACD
No está dibujado porque necesitaría sacarlo del gráfico.
Marco en la parte superior cuándo la señal sobrepasa al MACD hacia arriba o hacia abajo con un flecha indicando el sentido de esta señal.
RSI
Similar al MACD pero en la parte inferior.
Probablemente, programe otro indicador para visualizar en una ventanita MACD, RSI y volumen todo junto. El volumen en la principal hay veces que no te permite ver bien alguna sombra y los otros 2 te quitan mucho espacio para graficar si los tienes permanentemente en 2 ventanas separadas.
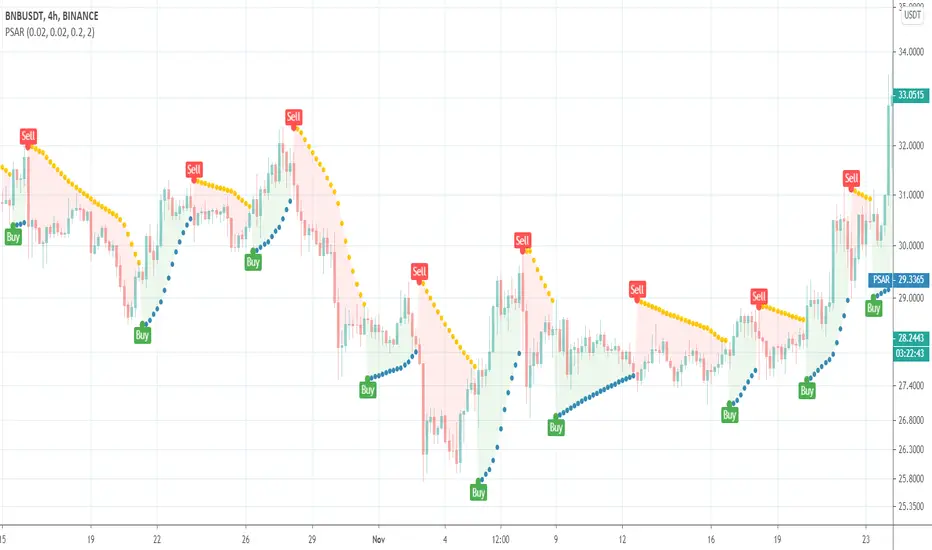
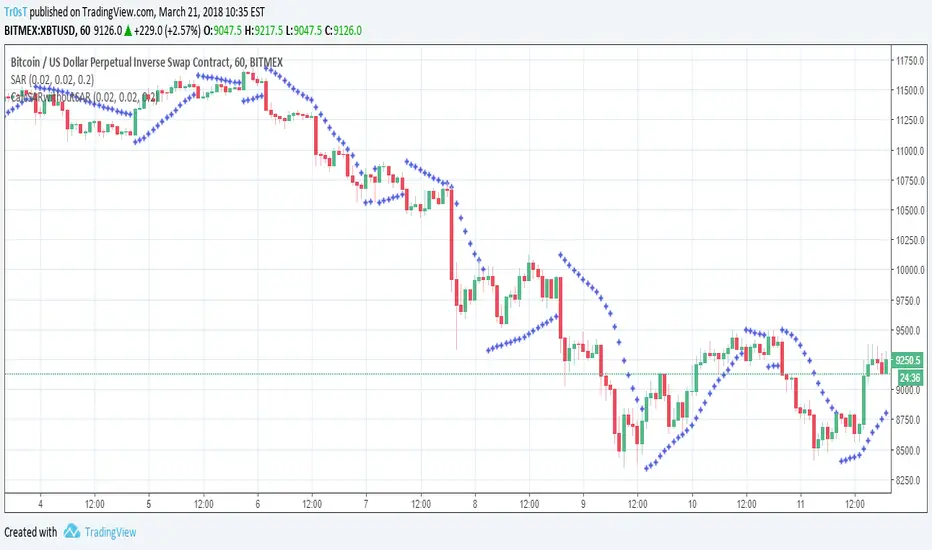
Parabolic SARThis is a redesign of the built-in Parabolic SAR indicator. I added a proper input system, an option to highlight initial points for both lines and an option to choose points width. So, customize it as you want.
Parabolic SAR was originally developed by J. Welles Wilder and described in his book "New Concepts in Technical Trading Systems" (1978). It is a trend-following indicator that can be used as a trailing stop loss.
To know which settings for PSAR are the most profitable on your instrument and timeframe you can use this tool
Profitable Parabolic SAR

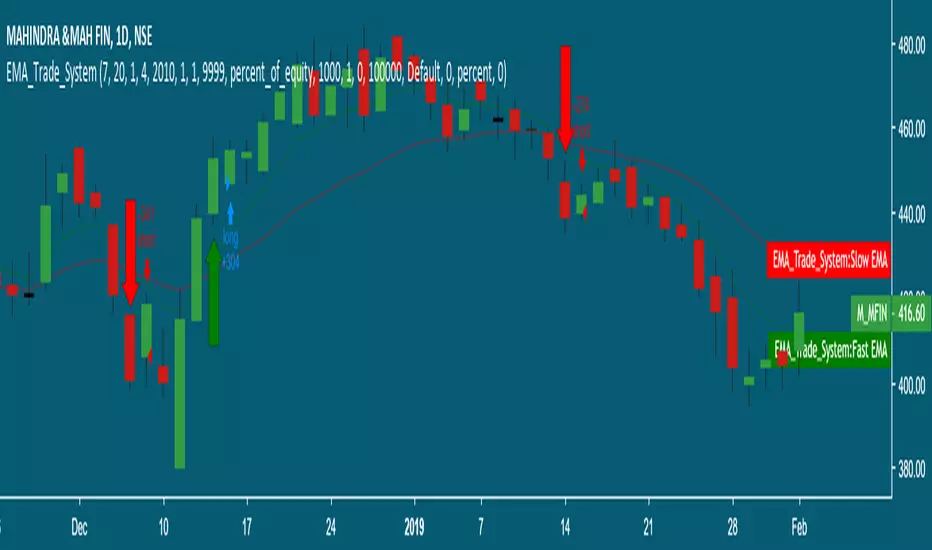
LINEdicator - Trendanalysis toolThis indicator creates an trend channel based on an EMA/SMA combo and a Parabolc SAR indicator.
Watch for the peaks and the size of the red/green channel for possible trend change.
Can also be used as an Entry/Exit/Stop-Loss setting tool.

Parabolic SAR Strategy with Bactesting RangeStandard Parabolic SAR Strategy with SAR level plotted and backtesting range option.

Kozlod - Parabolic SAR Strategy AlertsAlerts for standard Parabolic SAR Strategy.
It works best with "Once per bar" option.

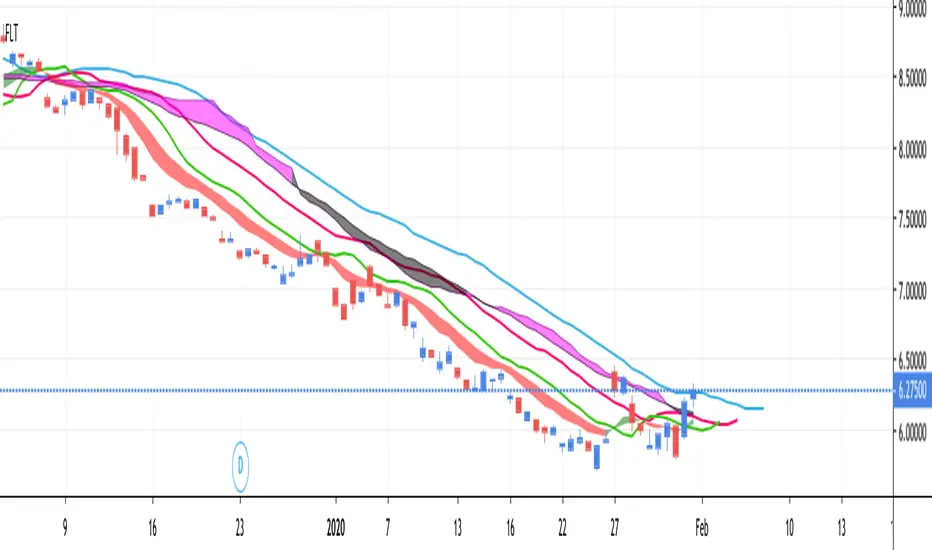
FLT - Fully Loaded TacoThis is a very full indicator.
NOTICE: By default, ALL indicators are turned off in the settings, except for the Bollinger Band, in order to facilitate faster load times.
Features can easily be turned on/off in the settings. You can have as many or as few as you want.
FEATURE LIST:
3 SMAs (Fast, Medium, Slow)
3 EMAs (Fast, Medium, Slow)
Support & Resistance Lines (Lime Color)
Parabolic Support & Resistance (Red dots above, Blue dots below)
Keltner Channel (purple channel lines)
Bollinger Band (Blue Cloud; Center & Borders hidden by default)
TTM Squeeze (Purple Background Color on Chart)
VWAP (Vibrant Blue Glowing Line, Intraday Only)
Fibonacci Retracement (Multicolor, Intraday Only)
Ichimoku Cloud (Standard Colors)
Hull Moving Average + Bollinger BandsThis study make use of Hull Moving Average and Bollinger Bands.
The crosses give signal about HMA and BB crossovers, they are a bit lagging, if you stare well you will spot them a little earlier. It look like a good idea to buy and sell when HMA is near or on the outside of the outer bands.
By default the Bollinger Bands uses Simple Moving Average with 21 periodes, and Hull Moving Average use 9 periodes. You can alter the settings in the format dialog.
Please use as pleased, and if you do something clever with it I'll be happy to know :D

All indicators in one!All indicators in one!
Hull MA (2 colors) + Bollinger Bands + 6 EMA + 50 SMA + 200 SMA + Parabolic SAR + SUPER TREND (2 colors) + Doji signals (yellow)
Analyse Technique Dynamique - All In One - v1.0Based upon "ATD" strategy.
This is just a "all in one" indicator
"SAR" code provided by Chris Moody with adaptations
French resources
www.financegalaxie.fr
www.financegalaxie.fr


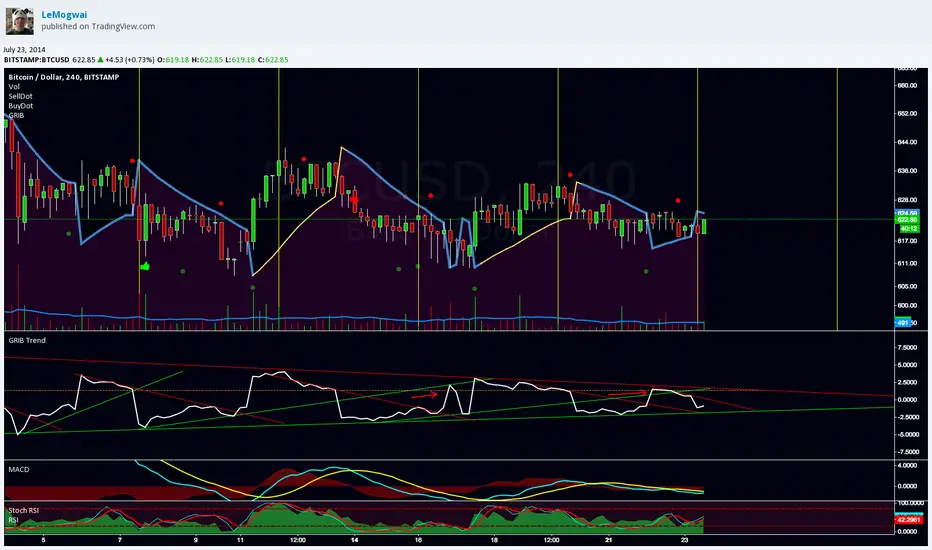
GRIB TrendlineGRIB Trendline show the distance betwen the price and the SAR with the GRIB settings in percentage. It highlight the elasticity of the wave. It's designed to be used with trendlines to spot the bottoms and the tops.
More explanation here :
and here :
note : do not use "selldot" and "buydot", i was testing something and gave up about the idea