Trading Made Easy ATR BandsAs always, this is not financial advice and use at your own risk. Trading is risky and can cost you significant sums of money if you are not careful. Make sure you always have a proper entry and exit plan that includes defining your risk before you enter a trade.
Background:
This is my take on two relatively famous indicators that paint the colour of your candles in order to help identify trend direction and smooth out market noise. The Elder Impulse System was designed by Dr . Alexander Elder in his book Come Into My Trading Room and attempts to identify the change of trends and when these trends speed up and slow down (school.stockcharts.com). The system used a 13 period EMA and a MACD histogram, and compared each of these indicators to the previous period. In short, when both the histogram and the EMA were rising, the trend was accelerating to the upside and when both were falling, accelerating to the downside. Conversely, when the indicators were not in alignment, say the MACD falling but the EMA rising, it signaled a slowing down of momentum. The downside of this indicator is that it be can rather jumpy, focusing on a short period EMA for 50% of its calculation, leaving a trader to potentially sit on the sidelines during opportune pull backs to enter winning positions, or exit early when there is still a lot of gas left in the tank.
A similar concept has been employed by John Carter and his organization, SimplerTrading, with the 10X bars indicator. However, here they use the famous Directional Movement Index (DMI) created by J. Welles Wilder as the basis for their bars (www.simplertrading.com). John Carter states that the use of this indicator can lead to getting in earlier on more, bigger, and faster setups. The downside of this indicator is the reliance on the ADX calculations to keep you out of rangebound trades. Anyone who is familiar with the DMI system understands it has unparalleled ability to identify longer term trends, but it is also quite slow, leaving the trader to miss a good portion of the initial runup due to this ADX portion that is very slow to get moving and also slow to signal exits.
In short, both of these systems are designed with one thing in mind: keeping the trader on the right side of the move --- but both suffer from the same issue but on opposite sides of the spectrum. One is too fast and the other is too slow. Ultimately, leaving profits on the table for the trader when such a situation could be avoided.
Here I present my own take on these and have made the “Trading Made Easy ATR Bands”. I name it this because trading is much easier when you trade with the prevailing trend, and this system identifies these periods quite effectively while doing a better job of handling the speed flux of most markets. The base formula uses the DMI as its main calculation and the relationship between the DMI+ and DMI- lines, respectively, like the 10X bars. While the trader can investigate these on their own to understand these more intimately, essentially the DMI+ and DMI- lines are calculating the highs and lows respectively of each bar compared to a period in the past and smoothed with the true range, a measurement of volatility . What this ultimately presents is a picture of uptrends and downtrends, where price is making consistently more highs or more lows over a period of time. Where I have modified this relative to the 10X bars is I have ignored the ADX calculations. Further, values over 25 have been discussed as “strong” momentum, in my calculations, I have sped this up to 20 to get a trader into the move earlier. Second, I have added an additional calculation based around the 21-period exponential moving average calculated against its previous output. This then, like the Elder Impulse System, has two forms of market momentum as its calculation to smooth out noise, but has the benefit of being less jumpy, like the original 10X bar system. I have added a series of exponential moving averages following the Fibonacci sequence from 8-144 as a system of dynamic support and resistance showing the sentiment of both the shorter and longer term market participants. Last, I have added a series of Keltner Channels , from 1X-4X, that encompass the 21 period EMA as a base line. The 21 EMA is a stable in all of John Carter’s work and I do believe he is correct that the market is mostly structured around this line, since it roughly approximates one month of trading data. It is not uncommon to see price expand and contract back to this line over and over again.
Trade Signals:
Strong Bullish Momentum – The system will generate a green bar when the DMI+ line is over the DMI- line, the DMI+ line is equal or greater than 20 and the 21 EMA has increased relative to its last close.
Weak Bullish Momentum – The system will generate a blue bar in several scenarios. First, when the DMI+ line is over the DMI- line but the DMI+ line is not over 20 and the EMA is equal or less than the previous close. It will also print a blue bar if either the DMI or the EMA are not aligned, such as the DMI+ is over the DMI- but not over 20 but the EMA has risen compared to the last bar. Last, it will also print a blue bar if the DMI- is over the DMI+ but the EMA is rising.
Strong Bearish Momentum – The system will generate a red bar when the DMI- line is over the DMI+ line, the DMI- line is equal or greater than 20, and the 21 EMA has fallen relative to its last close.
Weak Bearish Momentum – The system will generate an orange bar in several scenarios. First when the DMI- line is over the DMI+ line but the DMI- line is not over 20 and the EMA is equal or greater than the last bar. It will also print an orange bar if either the DMI or the EMA are not aligned, such as the DMI- is over the DMI+ but not over 20 but the EMA has fallen. Lastly, it will also print an orange bar if the DMI+ line is over the DMI- and the EMA has fallen relative to the last bar.
Uses:
1) Like the Elder Impulse System and 10X Bar systems, these should be used as trade filters only.. It is in the trader’s best interest to trade with the trends and these bars identify these periods but may not always generate the most opportune time to enter a market. For instance, trying to short a market when the market is in a phase of Strong Bullish Momentum would not be wise, and vice versa with trying to open long positions when the market is exhibiting Strong Bearish Momentum. Use multiple forms of evidence to confirm the signals shown before entering any trade and to not take these signals on their without confluence of ideas. A viable system could use the Elder Triple Screen System (for reference, see this decent write up --- www.dailyforex.com) with the Trading Made Easy Bands as your “Tide” or longer term filter, and a further trading plan to establish an entry on a short time frame pull back.
2) Interim Trend Exhaustion – Keltner channels work as moving standard deviations from the 21 EMA . 3X multipliers will encompass 99.7% of price and 4X will encompass 99.9% of price away from the 21 EMA . During a trend it would be a good idea to lock in partial profits when price reaches these outer extrema as it is very highly probable that a retracement back to the mean is approaching. While not part of the system, and not recommended to be used by this system, a mean reversion trader could in theory look for reversals at these extrema points and trade a mean reversion strategy back to the 21EMA, but is a much riskier trade with lower probability of success. A trend trader should look to enter trades when a signal is given within the 1ATR or 2ATR zone as this is when price has not really started accelerating yet and is likely to see continued momentum in that direction.
Recherche dans les scripts pour "哪吒2票房破25亿"

Dictionary/Object LibraryThis Library is aimed to mitigate the limitation of Pinescript having only one structured data type which is only arrays.
It lacks data types like Dictionaries(in Python) or Object (in JS) that are standard for other languages. Tuples do exist, but it hardly solves any problem.
Working only with Arrays could be overwhelming if your codebase is large. I looked for alternatives to arrays but couldn't find any library.
So I coded it myself and it's been working good for me. So I wanted to share it with you all.
What does it do:
==================
If you are familiar with Python or Javascript, this library tries to immimate Object/Dictonary like structure with Key Value Pairs.
For Example:
object= {name:"John Doe", age: 28 , org: "PineCoders"}
And then it also tries to immitate the Array of Objects (I call it Stack)
like this:
stack= Array({name:"John Doe", age: 28 , org: "PineCoders"},
{name:"Adam Smith", age: 32 , org: "PineCoders"},
{name:"Paragjyoti Deka", age: 25 , org: "PineCoders"})
So there are basically two ideas: Objects and Stacks.
But it looks whole different in Pinescript for obvious reasons.
Limitation:
The major limitation I couldn't overcome was that, for all of the values: both input and return values for properties will be of string type.
This is due to the limiation of Pinecsript that there is no way to return a value on a if-else statement dynamically with different data types.
And as the input data type must be explicitly defined when exporting the library functions, only string inputs are allowed.
Now that doesn't mean you won't be able to use integer, float or boolens, you just need to pass the string value for it using str.tostring() method.
And the output for the getter functions will be in strings as well. But I have added some type conversion methods that you could use from this library itself.
From String to Float, String To Integer and String to Boolean: these three methods are included in this library.
So basically the whole library is based on a manipulatiion of Array of strings under the hood.
///////////////
Usage
///////////////
Import the library using this statement:
import paragjyoti2012/STR_Dict_Lib/4 as DictLib
Objects
First define an object using this method:
for eample:
object1= DictLib.init("name=John,age=26,org=")
This is similar to
object1= {name:"John",age:"26", org:""} in JS or Python
Just like we did here in for "org", you can set initital value to "". But remember to pass string values, even for a numerical properties, like here in "age".
You can use "age="+str.tostring(age). If you find it tedious, you can always add properties later on using .set() method.
So it could also be initiated like this
object= DictLib.init("name=John")
and later on
DictLib.set(object1,"age", str.toString(age))
DictLib.set(object1,"org", "PineCoders")
The getter function looks like this
age= DictLib.get(object1,"age")
name=DictLib.get(object1,"name")
The first argument for all methods .get, .set, and .remove is the pointer (name of the object).
///////////////////////////
Array Of Objects (Stacks)
///////////////////////////
As I mentioned earlier, I call the array of objects as Stack.
Here's how to initialize a Stack.
stack= DictLib.initStack(object1)
The .initStack() method takes an object pointer as argument. It simply converts the array into a string and pushes it into the newly created stack.
Rest of all the methods for Stacks, takes the stack pointer as it's first arument.
For example:
DictLib.pushStack(stack,object2)
The second argument here is the object pointer. It adds the object to it's stack. Although it might feel like a two dimentional array, it's actually an one dimentional array with string values.
Under the hood, it looks like this
////////////////////
Methods
////////////////////
For Objects
-------------------
init() : Initializes the object.
params: (string) e.g
returns: The object ( )
example:
object1=DictLib.init("name=John,age=26,org=")
...................
get() : Returns the value for given property
params: (string object_pointer, string property)
returns: string
example:
age= DictLib.get(object1,"age")
.......................
set() : Adds a new property or updates an existing property
params: (string object_pointer, string property, string value)
returns: void
example:
DictLib.set(object1,"age", str.tostring(29))
........................
remove() : Removes a property from the object
params : (string object_pointer, string property)
returns: void
example:
DictLib.set(object1,"org")
........................
For Array Of Objects (Stacks)
-------------------------------
initStack() : Initializes the stack.
params: (string object_pointer) e.g
returns: The Stack
example:
stack= DictLib.initStack(object1)
...................
pushToStack() : Adds an object at at last index of the stack
params: (string stack_pointer, string object_pointer)
returns: void
example:
DictLib.pushToStack(stack,object2)
.......................
popFromStack() : Removes the last object from the stack
params: (string stack_pointer)
returns: void
example:
DictLib.popFromStack(stack)
.......................
insertToStack() : Adds an object at at the given index of the stack
params: (string stack_pointer, string object_pointer, int index)
returns: void
example:
DictLib.insertToStack(stack,object3,1)
.......................
removeFromStack() : Removes the object from the given index of the stack
params: (string stack_pointer, int index)
returns: void
example:
DictLib.removeFromStack(stack,2)
.......................
getElement () : Returns the value for given property from an object in the stack (index must be given)
params: (string stack_pointer, int index, string property)
returns: string
example:
ageFromObject1= DictLib.getElement(stack,0,"age")
.......................
setElement() : Updates an existing property of an object in the stack (index must be given)
params: (string stack_pointer, int index, string property, string value)
returns: void
example:
DictLib.setElement(stack,0,"age", str.tostring(32))
........................
includesElement() : Checks if any object exists in the stack with the given property-value pair
params : (string stack_pointer, string property, string value)
returns : Boolean
example:
doesExist= DictLib.includesElement(stack,"org","PineCoders")
........................
searchStack() : Search for a property-value pair in the stack and returns it's index
params: (stringp stack_pointer, string property, string value)
returns: int (-1 if doesn't exist)
example:
index= DictLib.searchElement(stack,"org","PineCoders")
///////////////////////
Type Conversion Methods
///////////////////////
strToFloat() : Converts String value to Float
params: (string value)
returns: float
example:
floatVal= DictLib.strToFloat("57.96")
.............................
strToInt() : Converts String value to Integer
params: (string value)
returns: int
example:
intVal= DictLib.strToFloat("45")
.............................
strToBool() : Converts String value to Boolean
params: (string value)
returns: boolean
example:
boolVal= DictLib.strToBool("true")
.............................
Points to remember
...............
1. Always pass string values as arguments.
2. The return values will be of type string, so convert them before to avoid typecasting conflict.
3. Horses can't vomit.
More Informations
====================
Yes, You can store this objects and stacks for persisting through the iterations of a script across successive bars.
You just need to set the variable using "var" keyword. Remember this objects and stacks are just arrays,
so any methods and properties an array have it pinescript, would be applicable for objects and stacks.
It can also be used in security functions without any issues for MTF Analysis.
If you have any suggestions or feedback, please comment on the thread, I would surely be happy to help.

Elevated Leverage index System - ELiSELEVATED LEVERAGE index SYSTEM (ELiS) tries to solve the problem of adjusting meaningful leverage in futures and margin trading.
The biggest problem for traders is adjusting the leverage level manually.
Concerning about the volatilities it's very hard to set a meaningful leverage level.
ELiS includes 4 different volatility component which are:
1- nATR: Normalized Average True Range which is actually ATR/price to stabilize ATR's value differences when price changes are high on long term periods.
2- Standard Deviation
3- Kairi based nATR
4- Bollinger %B
which are scaled from 0 to 100 and takes different averages with different combinations & ratios and combines them as an index.
This index calculates an average volatility to set the true leverage level when trading futures especially in Crypto and FX markets.
There are 5 risk levels of "GEARS" like on automobiles to set the max leverage for risk management.
Gear 1 - CONSERVATIVE: max leverage level can be 20 for swing traders and beginners
Gear 2 - STANDARD: max leverage level can be 25 (default) for day traders
Gear 3 - AVERAGE: max leverage level can be 33 for day traders
Gear 4 - RISKY: max leverage level can be 50 for scalpers
Gear 5 - AGRESSIVE: max leverage level can be 100 for advanced scalpers
default length for ATR, Standard Deviation and %B are all 50
Simply:
When markets aren't volatile: ELiS indicateshigher leverage values to maximize profits.
When markets are volatile enough: ELiS indicates lower values to reduce risk level.
hope you all enjoy ELiS on profitable trades.

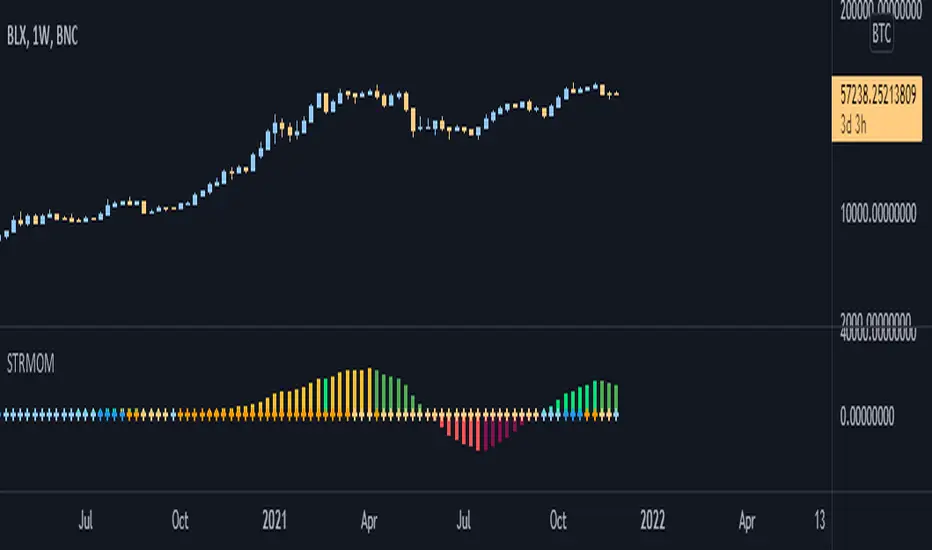
Strength Momentum IndicatorThis indicator is a fork of . It takes it a step further by including RSI and ADX information, which are represented in this indicator as follows:
MOM: The histogram itself is a linear regression curve, by default for the study period the Fibonacci series and exponential moving average were used. You can adjust the settings to your liking.
RSI: Whenever the RSI is outside the normal ranges (which you can adjust in the settings), the bar in the histogram will turn amber to warn you.
ADX: Crosses are drawn along the 0 line to indicate the ADX . Blue means that the ADX is below the trend level (adjustable in the settings), and orange means that it is above that level. Darker colors indicate that the ADX has risen from the previous bar, while lighter colors indicate that it has fallen.
Almost all of the normally adjustable values can be adjusted in the settings for each of the base indicators. Also adjustable:
The RSI alert levels (30 and 70 by default).
The ADX crossover, i.e. the point at which the ADX value is considered to indicate a strong trend (25 by default).
All colors, naturally.
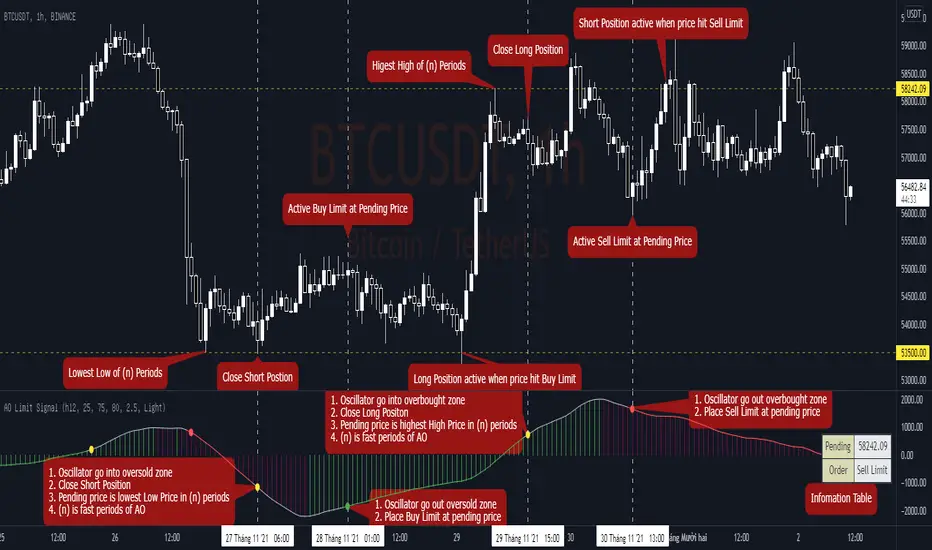
AO Limit Signal===
AO Limit Signal supply Pending Price and Limit Order with detail as bellow
===
A.Buy Limit
1.Get Pending Price
+ Oscillator go into oversold zone
+ Pending price is lowest Low Price in (n) periods
+ (n) is fast periods of AO
2.Active Buy Limit
+ Oscillator go out oversold zone
+ Place Buy Limit at pending price
===
B.Sell Limit
1.Get Pending Price
+ Oscillator go into overbought zone
+ Pending price is highest High Price in (n) periods
+ (n) is fast periods of AO
2.Active Sell Limit
+ Oscillator go out overbought zone
+ Place Sell Limit at pending price
===
C.Oscillator
1.AO default parameter
+ Source: HL2
+ Fast Period: 25 H1
+ Slow Period: 75 H1
2.Overbought - Oversold Zone
+ AO's %b period: 80
+ AO's %b multiplier: 2.5
+ Overbought zone: AO's %b above 0.8
+ Oversold zone: AO's %b below 0.2
3.Color
+ Yellow dot: AO go into Overbought - Oversold Zone
+ Red dot: AO go out Overbought Zone
+ Green dot: AO go out Oversold Zone
===
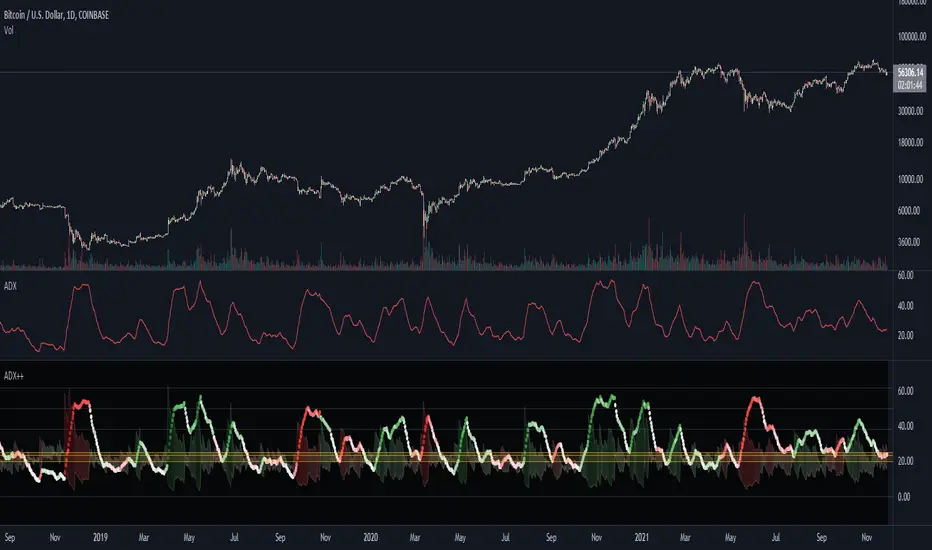
ADX Heatmap & Di's + Fib Referencial by [JohnnySnow]For quicker and easier interpretation, ADX line is displayed in a heatmap style. The more absolute difference between both DIs, the more intense the color.
Because some people use 20 ADX reference and others use 25 ADX reference to confirm the trend, I just add both as reference lines in a 'golden box'
Additionally, reference lines were added with default values set to Fib levels
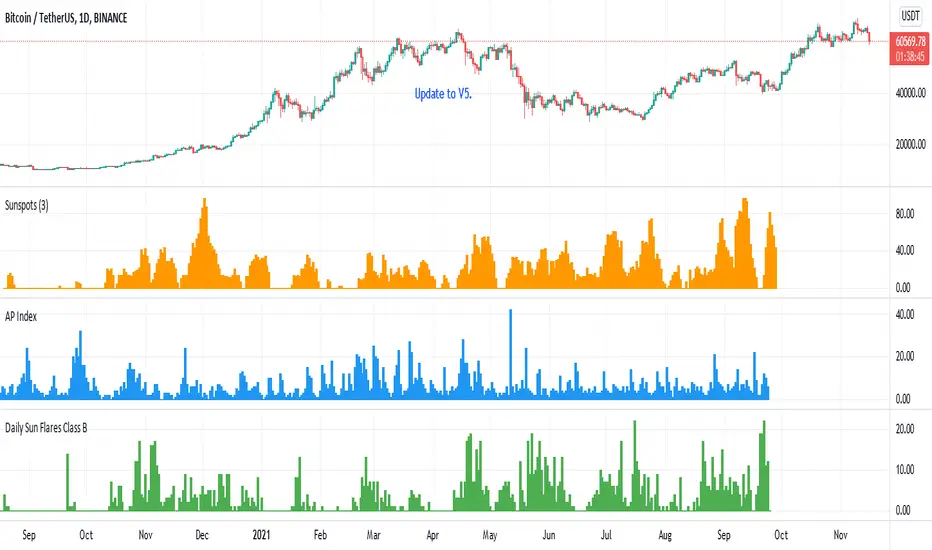
Daily Sun Flares Class AThe classification system for solar flares uses the letters A, B, C, M or X, according to the peak flux as measured at the Earth by the GOES spacecraft.
These are daily Class A sun flares. The data was created by counting daily flares of this class based on the peak time of the flare.
2015-01-01 until 2021-08-25
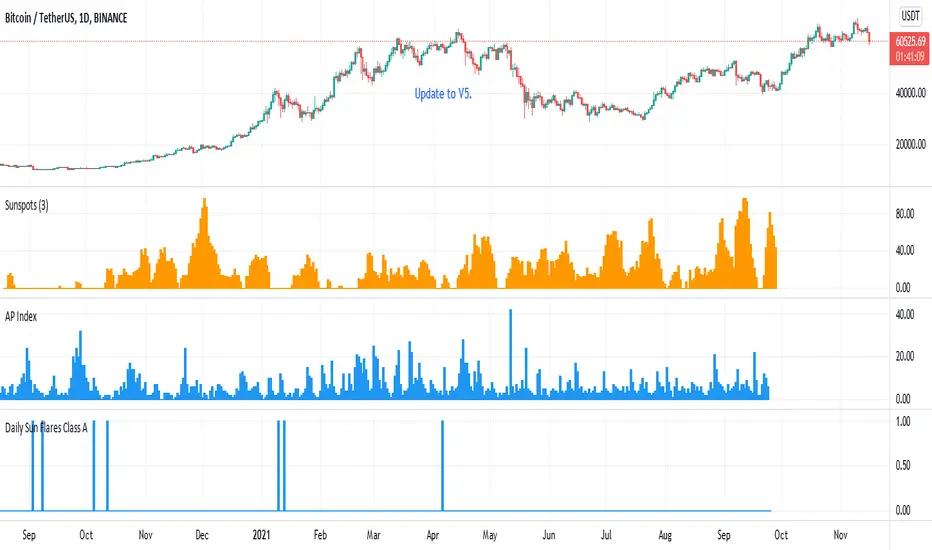
Daily Sun Flares Class BThe classification system for solar flares uses the letters A, B, C, M or X, according to the peak flux as measured at the Earth by the GOES spacecraft.
These are daily Class B sun flares. The data was created by counting daily flares of this class based on the peak time of the flare.
2015-01-01 until 2021-08-25
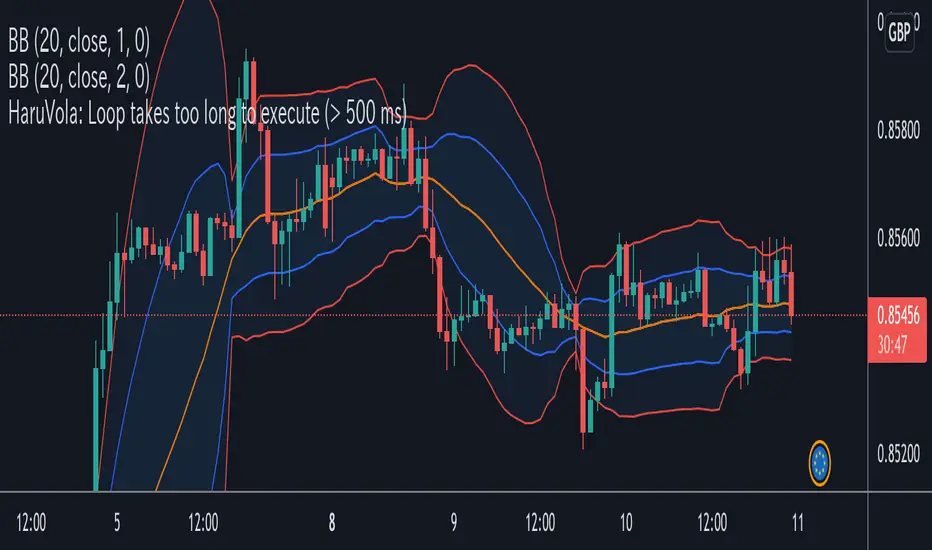
HarunoVolatility市場別のボラティリティを確認することができます。
確認できるボラティリティは東京、ロンドン、ニューヨークの3大市場です。
これら3つの市場の当日と5日、25日、75日の平均ボラティリティを画面へ表示します。
※注意点として、1時間足でないと正常に機能しません!
1時間足のみでご使用下さい。
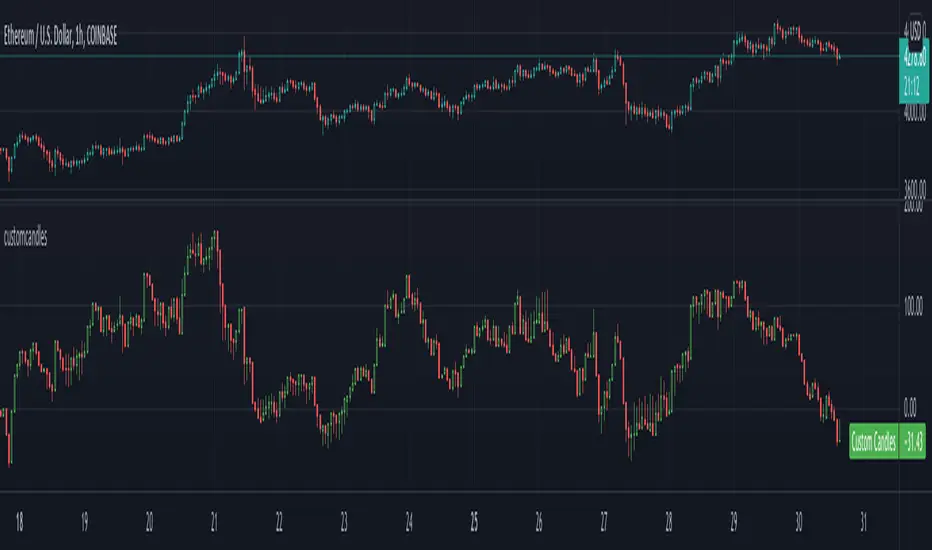
customcandlesLibrary "customcandles"
customcandles: Contains methods which can send custom candlesticks based on the input
macandles(maType, length, o, h, l, c) macandles: Provides OHLC of moving average candles
Parameters:
maType : - Moving average Type. Can be sma, ema, hma, rma, wma, vwma, swma, linreg, median
length : - Defaulted to 20. Can chose custom length
o : - Optional different open source. By default is set to open
h : - Optional different high source. By default is set to high
l : - Optional different low source. By default is set to low
c : - Optional different close source. By default is set to close
Returns: : Custom Moving Average based OHLC values
hacandles() hacandles: Provides Heikin Ashi OHLC values
Returns: : Custom Heikin Ashi OHLC values
ocandles(type, length, shortLength, longLength, method, highlowLength, sticky, percentCandles) macandles: Provides OHLC of moving average candles
Parameters:
type : - Oscillator Type. Can be cci, cmo, cog, mfi, roc, rsi, tsi, mfi
length : - Defaulted to 14. Can chose custom length
shortLength : - Used only for TSI. Default is 13
longLength : - Used only for TSI. Default is 25
method : - Valid values for method are : sma, ema, hma, rma, wma, vwma, swma, highlow, linreg, median
highlowLength : - length on which highlow of the oscillator is calculated
sticky : - overbought, oversold levels won't change unless crossed
percentCandles : - candles are generated based on percent with respect to high/low instead of actual oscillator values
Returns: : Custom Moving Average based OHLC values
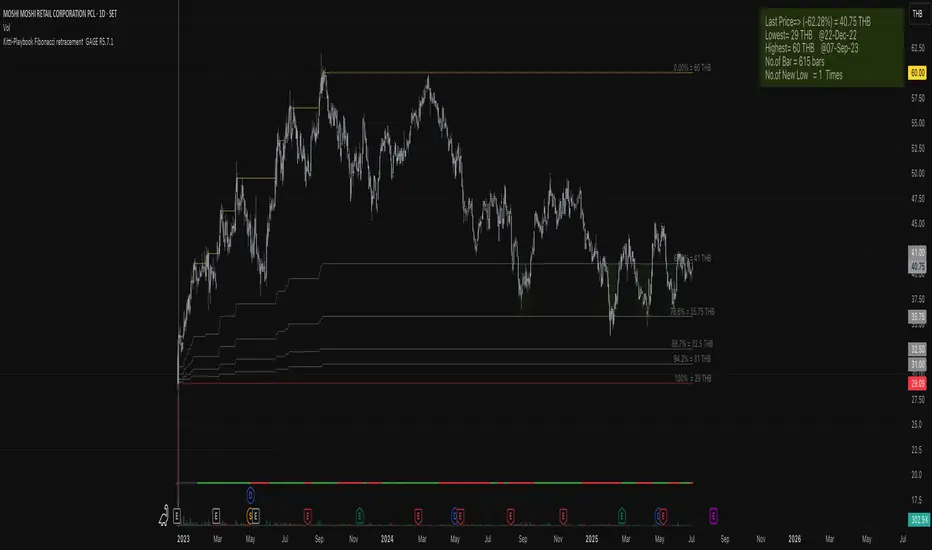
Kitti-Playbook Fibonacci retracement GAGE R0.00
Release Notes: Oct 25 2021
OVERVIEW :Kitti-Playbook Fibonacci retracement GAGE R0.00
Easy for visualize Fibonacci retracement level
CONCEPTS
1)Minimum Line = Lowest level of Source form start
2)Maximum Line = Highest level of Source form New Low
3)Calculation
a) Fibonacci Retracement of 61.8% form Maximum level
b) Fibonacci Retracement of 78.6% form Maximum level
c) Fibonacci Retracement of 88.7% form Maximum level
d) Fibonacci Retracement of 94.2% form Maximum level
4)Information Display
a) Information Bar show Number of New Low , Max level , Min Level , Last Bar No, Current Pricel
b) GAGE Scale Number
c) New Low
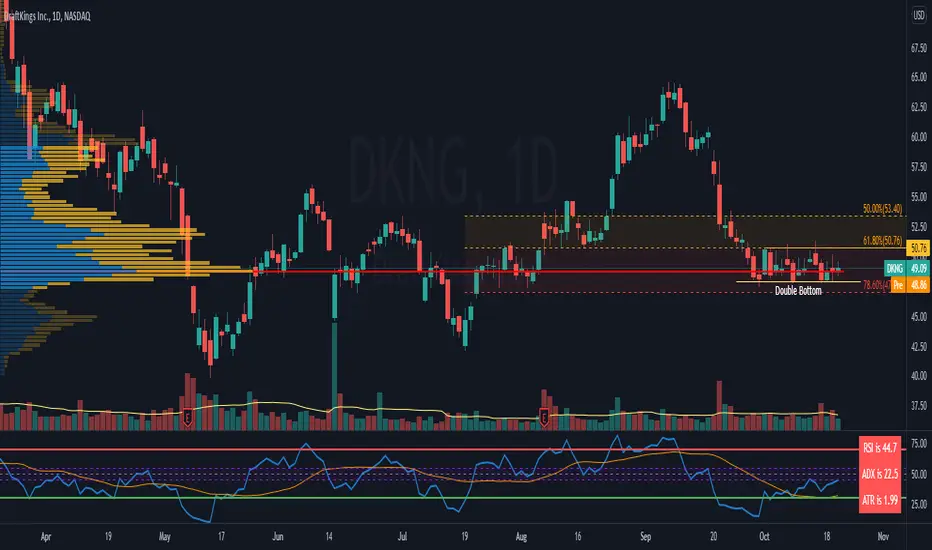
RSI c/w MA, ADX and ATR data I have added 3 items to the RSI indicator which helps me to get more information at the same time.
1) ADX value - when ADX is above 25 we have a strong trend
2) ATR Value - helps me to calculate my daily targets and stop-loss levels at a glance.
3) A simple moving average - This shows me the trend of RSI. If the price breaks a trend line and at the same time RSI crosses above the MA, it shows me a breakout has happened. In longer timeframes, it can show you in advance if you should expect a reversal in the trend.
You can turn on or off the MA as well as the ADX line.
Supertrend + Stoch StrategyA strategy using ema , supertrend and stochastic .
Long entry conditions:
1. EMA 25 > EMA 50 and EMA 100 > EMA 100.
2. Supertrend indicator is green.
3. Stochastic k line cross over d line.
Long stop: the lowest price of the last k

MACD With Crossings and Above Below ZeroMACD with MACD Derivative, Crossings Above and Below Zero, Shading for ADX Smoothing and Overlayed RSI
Primarily a moving average convergence divergence (MACD) momentum indicator. Also includes a MACD Derivative overlay to show when momentum has peaked. Displays triangle symbols when the MACD line crosses the signal line (larger triangle when MACD crosses above/below zero to indicator stronger momentum trend). Includes shading for average directional index (ADX) to futher determine when the price is trending strongly (red when the ADX value is greater than 25, and idicating a strong trend; otherwise blue). Lastly, has a relative strength index (RSI) momentum indicator overlayed to help evaluate periods of overbought or oversold conditions.

Rising ADX strategyI have always been a huge fan of ADX. Its good for finding out good trending moves.
But it has been said that only ADX after 20 or 25 is good for trending market, but few trend gets completed at that level.
So I have come up with a logic to find out the rising ADX. This could be used to determine the trending moves from the start.
Buy signal:
When close is greater than moving average 1 and 2. This moving average can be SMA, EMA, WMA or HMA.
When ADX is greater than the threshold range. I have taken 10 as my minimum range.
Of course important of all ADX should be rising which implies trend is about to start.
Buy exit:
When close is less than moving average 1 and 2. This moving average can be SMA, EMA, WMA or HMA.
When ADX is lesser than the threshold range. I have taken 10 as my minimum range.
ADX falling which implies trend is about to end.
Sell signal:
I don't repeat the above logic again.
Everything similar to buy signal except above moving average. For selling it should be below moving average.
Strategy can be tested for long and short sides.
Note: No Repainting as the logic is very simple.
Using this script we can identify the best timeframe the script trend yields profit.
Test and provide your comments.

Library_All_In_OneLibrary "Library_All_In_One"
fnRSI()
fnTSI()
Discription:
Contains several functions of Pinescript all in one Library. This reduce your coding.
How to use:
import Wilson-IV/Library_All_In_One/1 as _lib
Examples of plotting the RSI and TSI:
plot(_lib.fnRSI(close, 14))
plot(_lib.fnTSI(close, 25, 14))
Markets:
It can be used to all markets.
NOTE:
It will expands with more function during time.

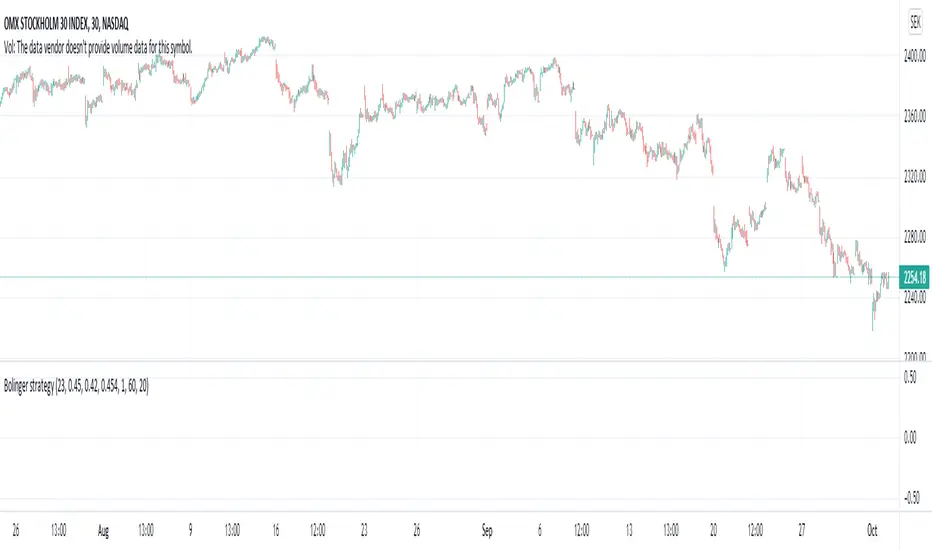
Bolinger strategy v1 openFind lows based on divergence on bollinger bands .
Works great on stocks and index, no success on forex.
Different stock/index requires different values.
Exit is not perfect, often on the safer side.
Example settings: NASDAQ:OMXS30, 30m: 25 0.452 0.42 0.453 2 62 20
Lower bbrower = buys harder dips, too low will cause buy during fall.
Higher bbrhigher = buys on lower dips
One of my first scripts, so code is not pretty
Baekdoo multi OverSold OverBuy colored CandleHi forks,
I'm trader Baekdoosan who trading Equity from South Korea. This Baekdoo multi OverSold OverBuy colored candle will give you the idea of
multiple indicators in one shot with colored candle. Those indicators tell us that oversold or overbuy statistically. For the color, you can freely change
based on your comfort. For me, in Korea white candle has red color and black candle has blue color. So somewhat confusing for you. Anyway you can
easily modify color in the script. Please refer this line.
barcolor(open<close and result_pos == 4 ? color.new(color.red, 0) : open<close and result_pos == 3 ? color.new(color.red, 25) : open<close and result_pos == 2 ? color.new(color.red, 50) : open<close and result_pos == 1? color.new(color.red, 75) : na)
you can see I put different transparency at color.new() function with color code. Let me divide and conquer to explain for up candle
white candle and black candle.
1. White candle
with 4 oversold signal case with white candle tells us it is almost reached real bottom and try to rebound. In this case, I put vivid color (no transparency) on the candle. And all 4 signal case, I put text on "OverSold". It will not happen frequently. Then 2 approaches can be made.
(a) short term approach
You can buy on this time. and you set stop loss with open price. This is mainly aimed for technical rebound.
(b) long term approach
You can accumulate based on your budget with 5 times dividing. At that day might not be the very bottom but those period will most probably real bottom. You can put more weight on latter buy. Let say, 1 : 1.25 : 1.5 : 1.75 : 2.5. So for example, if you have $8,000 to investigate then, buy $1,000 and then $1,250, $1,500, accordingly. If price rebound then don't adding weight on accumulation but with the first amount that you buy(i.e., $1,000 with above example). With this approach, you will not have much stress and you will get profit well. If this is grand bottom case, then you can HODL this long term. What you needs is stick to the plan. :)
with 3 signals the color is less vivid, 2 signals is much less vivid, accordingly.
2. Black candle
The approaches are opposite to above. The signal will tells us for 4 overBuy signals, then vivid blue candle will be shown. Our strategy is distribute to sell. Please do not sell in one shot. As Newton said, "I can calculate the motions of the heavenly bodies, but not the madness of the people". Strong buy phase, we don't know how far will it go. But indicators will tell us it is quite overSold situation. So what I can suggest you is sell it 10% to 20% on resistance price, and put 50% of lower than certain support price. Remember, accumulation and distribution will always better than one shot trading if you want to survive long time on this war field.
Hope this will help your trading on equity as well as crypto. I didn't try it on futures. Best of luck all of you. Gazua~!

Trading Range FinderWhat is it?
This indicator is a visual representation of the ADX indicator that shows where the areas of weak trends are. Anything shaded in a gray background implicates that the chosen market is experiencing a weak trend.
These areas of weak trends are seen typically when ADX drops below 20-25 but this script is customizable to change where you want that threshold.
Why did I make it?
I made this indicator to be used in combination with other trading indicators to eventually be used to identify when a market is range-bound/sideways.
Since momentum-based indicators can be "thrown off" in sideways market conditions, I will be using this visual indicator to identify when it is best to filter out a trade signal in a momentum-based strategy.

MarketGod for Tradingview(strategy)Fully Open Source Tv Market God Strategy. Good Luck
Strategy Description
MarketGod can be applied to any market, with any time-frame associated to it. The signals relay the alert at the close of the period, and the painted alert is then available to users to see on the chart or even set notifications for via tradingview's alert system. We recommend that users implement marketgod on their preferred time frames for trading, which for us is the 1h, 4h, 6h, 1D and above TFs.
MarketGod Versioning
The versions included with this release are the following
MarketGod v1
MarketGod v2
MarketGod v3
MarketGod v4
MarketGod v5
MarketGod v6
MarketGod v7
MarketGod v8
MarketGodx²
Ichimoku God
Suggested Uses
• MarketGod will inevitably produce false positives. We've taken steps to reduce this but we highly suggest you add this as a component of your strategy, not an end all be all
• That said, please do not feel the need to fire a trade based solely on a marketgod signal, or to every signal it fires.
• MarketGod users should backtest their strategy using OHLC candles for best results
• Heikin Ashi candles were recomended in the past, and we have eliminated the need for them, meaning that traditional candlestick inputs will yield the highest results.
• MarketGod will always give stronger alerts on higher TF's. If the 1-Day has fired a given signal and the 30 min or similar fire the opposite signal, know that the overall trend is still likely downward. Same concept applies to all timeframes on this tool.
Adjusting the Filter Settings
This tool has a noise filter for users to adjust.
The filter is a percentage based calculation, between significant points in time. The filter ranges between .5 and 25, with .5 increments
• For lower TFs ( IE Intraday), keep the filter set between .5-5
• Mid-TFs (4H,6H,12H,1D), the recommended range is between 5.5-10
• Higher TFs (3D and Higher), look for approx 11-20 range
Customizations
Customize the indicator by adjusting the colors in the style pane. Additionally, users can change the plots into labels with the price of close added to them, or a few other label text options, listed in the 'inputs' panel, below the filter adjustments. Users can also opt to turn the strategy orders as well, as this version will have them printed.
Strategy Performance Interpretation
Its important to understand the only metric that should be relevant is not the win %, as many may initially think. Alternatively, the only metric that matters in the end is your take home profit... meaning the profit one fees and taxes are accounted for. In our example here, the % brought back since the beginning of our window of 2018 is around 47% for $10,000 initial capital and 10% traded per position. Many are ignorant to the take home profit aspect as they focus solely on the winning %, which is ultimately incorrect approach to trading as a whole. as long as we maintain +30% (our goal minimum), the outcome being in the green, is our goal.

[CP]Pivot Boss Candlestick Scanner - No Repainting This indicator is based on the high probability candlestick patterns described in the ’Secrets of a Pivot Boss’ book.
The indicator does not suffer from repainting.
I have kept this indicator open source, so that you can take this indicator and design a complete trading system around it.
Although the patterns have some statistical edge in the markets, blindly using them as Buy/Sell Indicators will certainly result in a heavy loss.
I like some of these setups more than others, and I have listed them in the order of my likeness.
The first one I like the most, the last one, I like the least.
The patterns are universal and work well in both intraday, daily and even larger timeframes.
Signals in the example charts are manually marked by,
Hammer - profitable short signal
Rocket - profitable long signal
X - unprofitable long or short signal
GENERAL USER INPUTS:
These settings exist as the indicator uses ‘Labels’ to mark the patterns and Pine Script limits a maximum of 500 labels on a chart.
If you want to go back in the past and check how the indicator was doing, set the Start and End dates both and check the ’Use the date range above to mark the Candlestick Setups?’ option.
EXTREME REVERSAL SETUP:
This is by far my favorite setup in the lot. Classic Mean Reversion setup.
The logic, as explained in the book, goes like this,
1. The first bar of the pattern is about two times larger than the average size of the candles in the lookback period.
2. The body of the first bar of the pattern should encompass more than 50 percent of the bar’s total range, but usually not more than 85 percent.
3. The second bar of the pattern opposes the first.
The setup works extremely well in high beta stocks like Vedanta VEDL.
Feel free to play with the settings in order to better align this pattern with your favorite stock.
Check out the examples below,
No indicator is perfect, failed patterns are marked with an X.
OUTSIDE REVERSAL SETUP:
My second favorite setup, it is quite good at catching intraday trends.
Here’s the logic,
1. The engulfing bar of a bullish outside reversal setup has a low that is below the prior bar’s low and a close that is above the prior bar’s high. Reverse the conditions for bearish outside reversal.
2. The engulfing bar is usually 5 to 25 percent larger than the size of the average bar in the lookback period.
Settings for this pattern simply reflect these conditions. Feel free to modify them as you wish.
The pattern is pretty powerful and will sometimes help you catch literally all the highs and lows of the market, as shown in the examples of Vedanta VEDL and RELIANCE stocks below.
As usual, this pattern is not PERFECT either.
DOJI REVERSAL SETUP:
Doji candles signify market indecision and this pattern tries to profit off these market conditions.
Logic:
1. The open and close price of the doji should fall within 10 percent of each other, as measured by the total range of the candlestick.
2. For a bullish doji, the high of the doji candlestick should be below the ten-period simple moving average. Vice-versa for bearish.
3. For a bullish doji setup, one of the two bars following the doji must close above the high of the doji. Vice-versa for bearish.
Feel free to modify the settings and optimize according to the stock you are trading.
Don't optimize too much :)
This pattern works brilliantly well on larger intraday timeframes, like 15m/30m/60m.
This pattern also has a higher propensity to give false indications than the two described above.
Doji reversal typically helps to catch larger trend reversals. Check out the examples below from RELIANCE and NIFTY charts,
Note that the RELIANCE chart below is the same as shown for the Outside Reversal Setup above, notice the confluence of Outside
Reversal and Doji Reversal on the 31st August.
Confluence of patterns usually increases the probability of success.
RELIANCE 15m Chart - Pattern can catch nice trends on higher timeframes
NIFTY 15m Chart
WICK REVERSAL SETUP:
This pattern tries to capture candlesticks with large wick sizes, as they often indicate trend reversal when coupled with significant support and resistance levels.
Logic:
1. The body is used to determine the size of the reversal wick. A wick that is between 2.5 to 3.5 times larger than the size of the body is ideal.
2. For a bullish reversal wick to exist, the close of the bar should fall within the top 35 percent of the overall range of the candle.
3. For a bearish reversal wick to exist, the close of the bar should fall within the bottom 35 percent of the overall range of the candle.
This pattern must always be coupled with important support resistance levels, else there will be a lot of false signals.
The chart below is the same NIFTY chart as above with the Wick Reversal candles marked as well.
You can see that there are a lot of false signals, but the price also indicates ’pausing’ at important levels by printing a wick reversal setup.
You can use this information to your advantage when riding a trend.
FINAL WORDS:
Settings for various patterns simply reflect the logic described.
You will probably need to tweak and optimize the pattern settings for the stock that you are trading.
Higher Beta/Higher Volatility stocks are a great choice for these patterns.
Using these patterns at critical support and resistance levels will result in dramatically high accuracy.
Be creative and try to develop a proper system around this indicator, with rules for position sizing, stop loss etc.
You do not have to trade all the patterns. Even trading just one pattern with a proper system is good enough.
DO NOT USE THIS INDICATOR AS A BUY/SELL SYSTEM, YOU WILL LOSE MONEY.
Feel free to drop any feedback in the comments section below, or if you have any unique candlestick patterns that you would like me to code.

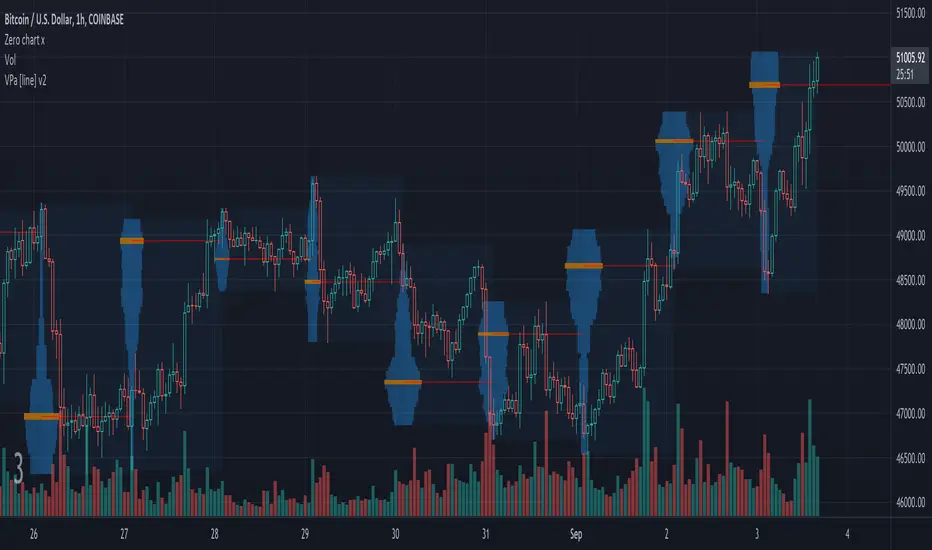
Volume Profile Auto [line]This project is about:
- VPSV
- array.new_line()
- array.new_box()
VPSV (pine) is one of the rare features that draws lines/figures BETWEEN bars
It doesn't run on Pine script, which makes it possible to do such things.
I wanted to have something similar while a restriction of Pine script is the impossibility to draw between bars, the only way I could think of is by using line width
In this script the higher timeframe is started with several lines (left) and a box, this box goes further until the higher timeframe ends.
During the creation of the box, each candle (lower timeframe) in this box (higher timeframe - period) is checked for position and volume, the volume is added to the left line, so when you see a thicker line, this means at that level there is more volume traded.
One of the big differences with other volume profiles is that many look back to a previous period, here when a period starts, the lines collect data - volume until the period ends, it is especially very visible in very low TF's (seconds)
This is my first script with array.new_line() - array.new_box(), which is a very nice Pine feature!
I hope this script can be helpful to see the possibilities
Settings:
'Parts' -> amount of lines (left of box)
5 Parts:
15 Parts:
25 Parts:
50 Parts:
'Max Width' -> Sets the max width of the lines
'Automatic Settings' -> Sets the higher time frame automatically, see the tooltip ⓘ for more info
The yellow line is the max volume line of that period, last period has a red line (POC), also referring the max.
Cheers!
Gap RiderThis Indicator allows you to make statistics on the performance of any underlying on the days in which an opening gap occurs.
Specifically, the indicator was designed for "0 dte" options trades. In fact, it is possible to find parameters that give a good statistical advantage by opening a spread in the direction of the gap, creating a trade that has a risk-return ratio of 1: 1.
The indicator shows flags on the graph (green in case of gap up, red in case of gap down) and colored boxes (green in case the stock closed in the direction of the gap, red in case the stock closed in the opposite direction to the gap, yellow in the event that the stock closed at a distance that did not allow the spread in options to close in maximum loss or maximum profit, and therefore in breakeven)
The statistics panel, on the other hand, contains all the information necessary to search for parameters that give the trader a good statistical advantage.
In the settings you can filter the days of the week, only gap up or only gap down, ATR thresholds (volatility), points or minimum percentage for which a gap is taken into account, measure of the breakeven (which for options traders should represent the half the width of the spread to open), large gaps filter that takes into consideration only gaps that open out of range compared to the previous session. The Lookback parameter of course is used to set how many bars to take into account for the statistics.
Parameters and recommended strategy:
TODAY 31/08/2021 - Lookback 500 bars (2 years)
UNDERLYING: SPX
FILTERS: only Monday and Wednesday, only gap up, only gap> 0.01%
STRATEGY: exactly at opening, cover an ATM spread in the direction of the gap (example: gap up, I open a long call spread) that has the opening price as a break even, with a risk-return ratio of 1: 1 and leave it open until closing session, or set take profit at 90-95%. It is advisable to take into consideration the SPX statistics but to operate on the ES future so as to be able to open the spread a couple of minutes before the opening of the cash session and prevent the trade from "running away" due to too sudden movements of the opening. .
RESULTS:
124 Trade
70% profitable trades
30% losing trades
Max drawdown 3 trades
So assuming a spread on ES 10 points wide, each trade would gain or lose $ 250, applying the described strategy we would have in two years, investing only $ 250, a profit of $ 12500, with a max drawdown of $ 750. We would therefore have a profit of 5000%, or rather 2500% per year on the invested capital, with a drawdown of a much lower proportion of the profit ($ 750 compared to $ 6250 of annual profit).
The strategy is infinitely scalable by increasing the options contracts used and the impact of the commissions is almost zero.
MONEY MANAGEMENT: Example on a 50K account, with a spread that earns or loses $ 500, in two years it earns $ 25,000, therefore about 12500 per year, with a max drawdown of $ 1500, therefore 25% per year on the ENTIRE ACCOUNT with a maximum drawdown of 3%.
Note: the test was performed without a break even parameter, so the actual result will be more moderate, but of the same explosive nature.
** BUG STILL LOOKING FOR SOLUTION **
only in case the filters are set to take into account ONLY the gap down, the drawdown count in the statistics panel shows an incorrect result "
