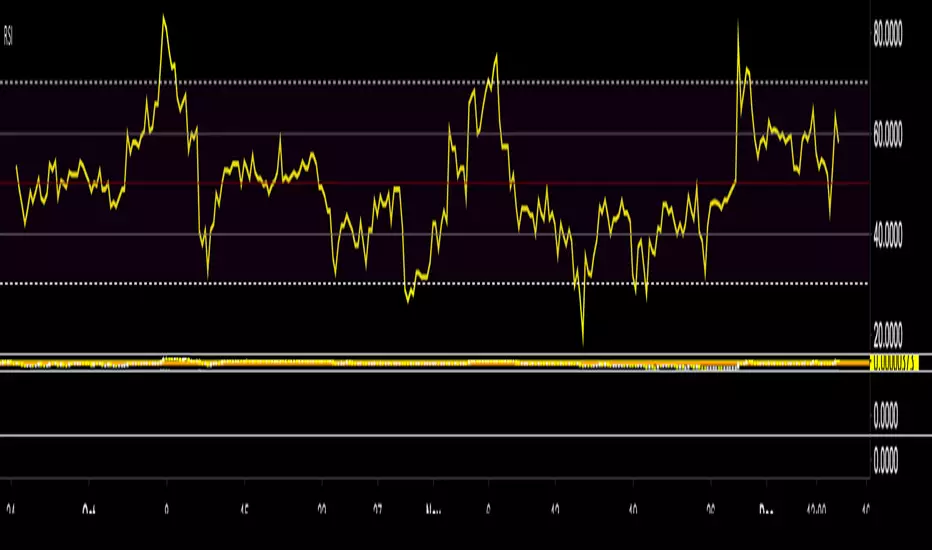
JSE Top 40 Comparative Relative Strength RSI OscillatorThis code is the result of an idea by @MarcoOlivano. The question was that if putting the comparative relative strength as an RSI oscillator would help in understanding the relative strength of the stock to the overall market? As we both trade the JSE I have made the JSE:J200 or Top 40 the basis for comparison. This can be changed in the settings dropdown if you want to compare with the All Share Index (JSE:J201) or other markets such as the S&P.
On the chart above I have included the Comparative Relative Strength as a reference together with the Comparative Relative Strength RSI.
If you use the indicator or adapt it please let me know if it works for you, how you use it and if it has any value.
Recherche dans les scripts pour "当前市场环境下综合估值百分比低于40的股票有哪些?"

JSE Top 40 Comparative Relative StrengthThis code adapts the code by vitvlkv to be appropriate for comparison of JSE stocks with the Top 40 index. It also includes moving averages and Bollinger Bands to identify extreme conditions. You can change the colours and deselect moving averages to make the plot less cluttered. You can also change the selection to compare the stock against to JSE:J201 if you want to compare it to the All Share Index.

Exponential Moving Averages 9 & 40 NKExponential Moving Averages 9 & 40 NK, used in Currency Markets


draw line at bar on condition, up to 40 bars in lengthDraws line at bar on condition, up to 40 bars in length.
Well, that's not a line, but a set of `—` characters. But it looks like a line, so it is line.
Guppy MMA 3, 5, 8, 10, 12, 15 and 30, 35, 40, 45, 50, 60Guppy Multiple Moving Average
Short Term EMA 3, 5, 8, 10, 12, 15
Long Term EMA 30, 35, 40, 45, 50, 60
Use for SFTS Class

40 crypto screener [LUPOWN]// ENGLISH
This indicator shows two tables, with 10 assets each, they can be currencies, stocks or cryptos, the columns can be changed to the information you want to see, among the options are price or change (change in percentage of the candle in the temporality where you are seeing it), TL are buy or sell signals according to the Latin trading strategy (Squeeze momentum combined with ADX) buy if the momentum changes to range or rise and the ADX has a negative slope, sell if the momentum changes to range or fall and The ADX has a negative slope, the signals are not 100% effective, you must support it with price action and market speculation, directionality in the momentum, slope of the ADX, if there is divergence in the momoentum squeeze, lux something and cipher use an indicator of Lazy bear, lux something signals when two wave trends cross and the cipher signals when the wave trend crosses above or below the 0 point.
You can choose between seeing one or two tables, this so that it can be seen on small screens, there is also the option to hide the tables and show the label, which is also an alternative to see it on small screens
i got the main idea from @QuantNomad
//SPANISH
Este indicador muestra dos tablas, con 10 activos cada una, pueden ser divisas, acciones o cryptos, las columnas se pueden cambiar a la información que quieras ver, entre las opciones están precio o cambio (cambio en porcentaje de la vela en la temporalidad donde lo estes viendo), TL son señales de compra o venta según estrategia de trading latino (Squeeze momentum combinado con ADX) compra si el momentum cambia a rango o subida y el ADX tiene pendiente negativa, venta si el momentum cambia a rango o caída y el ADX tiene pendiente negativa, las señales no son 100% efectivas debes apoyarla con la acción del precio y especulación del mercado, direccionalidad en el momentum, pendiente del ADX, si hay divergencia en el squeeze momoentum, lux algo y cipher utilizan un indicador de Lazy bear, lux algo da señal cuando dos wave trend se cruzan y el cipher da señal cuando el wave trend cruza por encima o debajo del punto 0.
Puedes elegir entre ver una o dos tablas, esto para que se pueda ver en pantallas pequeñas, también esta la opción de ocultar las tablas y mostrar el label, que también es una alternativa para verlo en pantallas pequeñas
La idea principal la tome de @QuantNomad

Universal Ratio Trend Matrix [InvestorUnknown]The Universal Ratio Trend Matrix is designed for trend analysis on asset/asset ratios, supporting up to 40 different assets. Its primary purpose is to help identify which assets are outperforming others within a selection, providing a broad overview of market trends through a matrix of ratios. The indicator automatically expands the matrix based on the number of assets chosen, simplifying the process of comparing multiple assets in terms of performance.
Key features include the ability to choose from a narrow selection of indicators to perform the ratio trend analysis, allowing users to apply well-defined metrics to their comparison.
Drawback: Due to the computational intensity involved in calculating ratios across many assets, the indicator has a limitation related to loading speed. TradingView has time limits for calculations, and for users on the basic (free) plan, this could result in frequent errors due to exceeded time limits. To use the indicator effectively, users with any paid plans should run it on timeframes higher than 8h (the lowest timeframe on which it managed to load with 40 assets), as lower timeframes may not reliably load.
Indicators:
RSI_raw: Simple function to calculate the Relative Strength Index (RSI) of a source (asset price).
RSI_sma: Calculates RSI followed by a Simple Moving Average (SMA).
RSI_ema: Calculates RSI followed by an Exponential Moving Average (EMA).
CCI: Calculates the Commodity Channel Index (CCI).
Fisher: Implements the Fisher Transform to normalize prices.
Utility Functions:
f_remove_exchange_name: Strips the exchange name from asset tickers (e.g., "INDEX:BTCUSD" to "BTCUSD").
f_remove_exchange_name(simple string name) =>
string parts = str.split(name, ":")
string result = array.size(parts) > 1 ? array.get(parts, 1) : name
result
f_get_price: Retrieves the closing price of a given asset ticker using request.security().
f_constant_src: Checks if the source data is constant by comparing multiple consecutive values.
Inputs:
General settings allow users to select the number of tickers for analysis (used_assets) and choose the trend indicator (RSI, CCI, Fisher, etc.).
Table settings customize how trend scores are displayed in terms of text size, header visibility, highlighting options, and top-performing asset identification.
The script includes inputs for up to 40 assets, allowing the user to select various cryptocurrencies (e.g., BTCUSD, ETHUSD, SOLUSD) or other assets for trend analysis.
Price Arrays:
Price values for each asset are stored in variables (price_a1 to price_a40) initialized as na. These prices are updated only for the number of assets specified by the user (used_assets).
Trend scores for each asset are stored in separate arrays
// declare price variables as "na"
var float price_a1 = na, var float price_a2 = na, var float price_a3 = na, var float price_a4 = na, var float price_a5 = na
var float price_a6 = na, var float price_a7 = na, var float price_a8 = na, var float price_a9 = na, var float price_a10 = na
var float price_a11 = na, var float price_a12 = na, var float price_a13 = na, var float price_a14 = na, var float price_a15 = na
var float price_a16 = na, var float price_a17 = na, var float price_a18 = na, var float price_a19 = na, var float price_a20 = na
var float price_a21 = na, var float price_a22 = na, var float price_a23 = na, var float price_a24 = na, var float price_a25 = na
var float price_a26 = na, var float price_a27 = na, var float price_a28 = na, var float price_a29 = na, var float price_a30 = na
var float price_a31 = na, var float price_a32 = na, var float price_a33 = na, var float price_a34 = na, var float price_a35 = na
var float price_a36 = na, var float price_a37 = na, var float price_a38 = na, var float price_a39 = na, var float price_a40 = na
// create "empty" arrays to store trend scores
var a1_array = array.new_int(40, 0), var a2_array = array.new_int(40, 0), var a3_array = array.new_int(40, 0), var a4_array = array.new_int(40, 0)
var a5_array = array.new_int(40, 0), var a6_array = array.new_int(40, 0), var a7_array = array.new_int(40, 0), var a8_array = array.new_int(40, 0)
var a9_array = array.new_int(40, 0), var a10_array = array.new_int(40, 0), var a11_array = array.new_int(40, 0), var a12_array = array.new_int(40, 0)
var a13_array = array.new_int(40, 0), var a14_array = array.new_int(40, 0), var a15_array = array.new_int(40, 0), var a16_array = array.new_int(40, 0)
var a17_array = array.new_int(40, 0), var a18_array = array.new_int(40, 0), var a19_array = array.new_int(40, 0), var a20_array = array.new_int(40, 0)
var a21_array = array.new_int(40, 0), var a22_array = array.new_int(40, 0), var a23_array = array.new_int(40, 0), var a24_array = array.new_int(40, 0)
var a25_array = array.new_int(40, 0), var a26_array = array.new_int(40, 0), var a27_array = array.new_int(40, 0), var a28_array = array.new_int(40, 0)
var a29_array = array.new_int(40, 0), var a30_array = array.new_int(40, 0), var a31_array = array.new_int(40, 0), var a32_array = array.new_int(40, 0)
var a33_array = array.new_int(40, 0), var a34_array = array.new_int(40, 0), var a35_array = array.new_int(40, 0), var a36_array = array.new_int(40, 0)
var a37_array = array.new_int(40, 0), var a38_array = array.new_int(40, 0), var a39_array = array.new_int(40, 0), var a40_array = array.new_int(40, 0)
f_get_price(simple string ticker) =>
request.security(ticker, "", close)
// Prices for each USED asset
f_get_asset_price(asset_number, ticker) =>
if (used_assets >= asset_number)
f_get_price(ticker)
else
na
// overwrite empty variables with the prices if "used_assets" is greater or equal to the asset number
if barstate.isconfirmed // use barstate.isconfirmed to avoid "na prices" and calculation errors that result in empty cells in the table
price_a1 := f_get_asset_price(1, asset1), price_a2 := f_get_asset_price(2, asset2), price_a3 := f_get_asset_price(3, asset3), price_a4 := f_get_asset_price(4, asset4)
price_a5 := f_get_asset_price(5, asset5), price_a6 := f_get_asset_price(6, asset6), price_a7 := f_get_asset_price(7, asset7), price_a8 := f_get_asset_price(8, asset8)
price_a9 := f_get_asset_price(9, asset9), price_a10 := f_get_asset_price(10, asset10), price_a11 := f_get_asset_price(11, asset11), price_a12 := f_get_asset_price(12, asset12)
price_a13 := f_get_asset_price(13, asset13), price_a14 := f_get_asset_price(14, asset14), price_a15 := f_get_asset_price(15, asset15), price_a16 := f_get_asset_price(16, asset16)
price_a17 := f_get_asset_price(17, asset17), price_a18 := f_get_asset_price(18, asset18), price_a19 := f_get_asset_price(19, asset19), price_a20 := f_get_asset_price(20, asset20)
price_a21 := f_get_asset_price(21, asset21), price_a22 := f_get_asset_price(22, asset22), price_a23 := f_get_asset_price(23, asset23), price_a24 := f_get_asset_price(24, asset24)
price_a25 := f_get_asset_price(25, asset25), price_a26 := f_get_asset_price(26, asset26), price_a27 := f_get_asset_price(27, asset27), price_a28 := f_get_asset_price(28, asset28)
price_a29 := f_get_asset_price(29, asset29), price_a30 := f_get_asset_price(30, asset30), price_a31 := f_get_asset_price(31, asset31), price_a32 := f_get_asset_price(32, asset32)
price_a33 := f_get_asset_price(33, asset33), price_a34 := f_get_asset_price(34, asset34), price_a35 := f_get_asset_price(35, asset35), price_a36 := f_get_asset_price(36, asset36)
price_a37 := f_get_asset_price(37, asset37), price_a38 := f_get_asset_price(38, asset38), price_a39 := f_get_asset_price(39, asset39), price_a40 := f_get_asset_price(40, asset40)
Universal Indicator Calculation (f_calc_score):
This function allows switching between different trend indicators (RSI, CCI, Fisher) for flexibility.
It uses a switch-case structure to calculate the indicator score, where a positive trend is denoted by 1 and a negative trend by 0. Each indicator has its own logic to determine whether the asset is trending up or down.
// use switch to allow "universality" in indicator selection
f_calc_score(source, trend_indicator, int_1, int_2) =>
int score = na
if (not f_constant_src(source)) and source > 0.0 // Skip if you are using the same assets for ratio (for example BTC/BTC)
x = switch trend_indicator
"RSI (Raw)" => RSI_raw(source, int_1)
"RSI (SMA)" => RSI_sma(source, int_1, int_2)
"RSI (EMA)" => RSI_ema(source, int_1, int_2)
"CCI" => CCI(source, int_1)
"Fisher" => Fisher(source, int_1)
y = switch trend_indicator
"RSI (Raw)" => x > 50 ? 1 : 0
"RSI (SMA)" => x > 50 ? 1 : 0
"RSI (EMA)" => x > 50 ? 1 : 0
"CCI" => x > 0 ? 1 : 0
"Fisher" => x > x ? 1 : 0
score := y
else
score := 0
score
Array Setting Function (f_array_set):
This function populates an array with scores calculated for each asset based on a base price (p_base) divided by the prices of the individual assets.
It processes multiple assets (up to 40), calling the f_calc_score function for each.
// function to set values into the arrays
f_array_set(a_array, p_base) =>
array.set(a_array, 0, f_calc_score(p_base / price_a1, trend_indicator, int_1, int_2))
array.set(a_array, 1, f_calc_score(p_base / price_a2, trend_indicator, int_1, int_2))
array.set(a_array, 2, f_calc_score(p_base / price_a3, trend_indicator, int_1, int_2))
array.set(a_array, 3, f_calc_score(p_base / price_a4, trend_indicator, int_1, int_2))
array.set(a_array, 4, f_calc_score(p_base / price_a5, trend_indicator, int_1, int_2))
array.set(a_array, 5, f_calc_score(p_base / price_a6, trend_indicator, int_1, int_2))
array.set(a_array, 6, f_calc_score(p_base / price_a7, trend_indicator, int_1, int_2))
array.set(a_array, 7, f_calc_score(p_base / price_a8, trend_indicator, int_1, int_2))
array.set(a_array, 8, f_calc_score(p_base / price_a9, trend_indicator, int_1, int_2))
array.set(a_array, 9, f_calc_score(p_base / price_a10, trend_indicator, int_1, int_2))
array.set(a_array, 10, f_calc_score(p_base / price_a11, trend_indicator, int_1, int_2))
array.set(a_array, 11, f_calc_score(p_base / price_a12, trend_indicator, int_1, int_2))
array.set(a_array, 12, f_calc_score(p_base / price_a13, trend_indicator, int_1, int_2))
array.set(a_array, 13, f_calc_score(p_base / price_a14, trend_indicator, int_1, int_2))
array.set(a_array, 14, f_calc_score(p_base / price_a15, trend_indicator, int_1, int_2))
array.set(a_array, 15, f_calc_score(p_base / price_a16, trend_indicator, int_1, int_2))
array.set(a_array, 16, f_calc_score(p_base / price_a17, trend_indicator, int_1, int_2))
array.set(a_array, 17, f_calc_score(p_base / price_a18, trend_indicator, int_1, int_2))
array.set(a_array, 18, f_calc_score(p_base / price_a19, trend_indicator, int_1, int_2))
array.set(a_array, 19, f_calc_score(p_base / price_a20, trend_indicator, int_1, int_2))
array.set(a_array, 20, f_calc_score(p_base / price_a21, trend_indicator, int_1, int_2))
array.set(a_array, 21, f_calc_score(p_base / price_a22, trend_indicator, int_1, int_2))
array.set(a_array, 22, f_calc_score(p_base / price_a23, trend_indicator, int_1, int_2))
array.set(a_array, 23, f_calc_score(p_base / price_a24, trend_indicator, int_1, int_2))
array.set(a_array, 24, f_calc_score(p_base / price_a25, trend_indicator, int_1, int_2))
array.set(a_array, 25, f_calc_score(p_base / price_a26, trend_indicator, int_1, int_2))
array.set(a_array, 26, f_calc_score(p_base / price_a27, trend_indicator, int_1, int_2))
array.set(a_array, 27, f_calc_score(p_base / price_a28, trend_indicator, int_1, int_2))
array.set(a_array, 28, f_calc_score(p_base / price_a29, trend_indicator, int_1, int_2))
array.set(a_array, 29, f_calc_score(p_base / price_a30, trend_indicator, int_1, int_2))
array.set(a_array, 30, f_calc_score(p_base / price_a31, trend_indicator, int_1, int_2))
array.set(a_array, 31, f_calc_score(p_base / price_a32, trend_indicator, int_1, int_2))
array.set(a_array, 32, f_calc_score(p_base / price_a33, trend_indicator, int_1, int_2))
array.set(a_array, 33, f_calc_score(p_base / price_a34, trend_indicator, int_1, int_2))
array.set(a_array, 34, f_calc_score(p_base / price_a35, trend_indicator, int_1, int_2))
array.set(a_array, 35, f_calc_score(p_base / price_a36, trend_indicator, int_1, int_2))
array.set(a_array, 36, f_calc_score(p_base / price_a37, trend_indicator, int_1, int_2))
array.set(a_array, 37, f_calc_score(p_base / price_a38, trend_indicator, int_1, int_2))
array.set(a_array, 38, f_calc_score(p_base / price_a39, trend_indicator, int_1, int_2))
array.set(a_array, 39, f_calc_score(p_base / price_a40, trend_indicator, int_1, int_2))
a_array
Conditional Array Setting (f_arrayset):
This function checks if the number of used assets is greater than or equal to a specified number before populating the arrays.
// only set values into arrays for USED assets
f_arrayset(asset_number, a_array, p_base) =>
if (used_assets >= asset_number)
f_array_set(a_array, p_base)
else
na
Main Logic
The main logic initializes arrays to store scores for each asset. Each array corresponds to one asset's performance score.
Setting Trend Values: The code calls f_arrayset for each asset, populating the respective arrays with calculated scores based on the asset prices.
Combining Arrays: A combined_array is created to hold all the scores from individual asset arrays. This array facilitates further analysis, allowing for an overview of the performance scores of all assets at once.
// create a combined array (work-around since pinescript doesn't support having array of arrays)
var combined_array = array.new_int(40 * 40, 0)
if barstate.islast
for i = 0 to 39
array.set(combined_array, i, array.get(a1_array, i))
array.set(combined_array, i + (40 * 1), array.get(a2_array, i))
array.set(combined_array, i + (40 * 2), array.get(a3_array, i))
array.set(combined_array, i + (40 * 3), array.get(a4_array, i))
array.set(combined_array, i + (40 * 4), array.get(a5_array, i))
array.set(combined_array, i + (40 * 5), array.get(a6_array, i))
array.set(combined_array, i + (40 * 6), array.get(a7_array, i))
array.set(combined_array, i + (40 * 7), array.get(a8_array, i))
array.set(combined_array, i + (40 * 8), array.get(a9_array, i))
array.set(combined_array, i + (40 * 9), array.get(a10_array, i))
array.set(combined_array, i + (40 * 10), array.get(a11_array, i))
array.set(combined_array, i + (40 * 11), array.get(a12_array, i))
array.set(combined_array, i + (40 * 12), array.get(a13_array, i))
array.set(combined_array, i + (40 * 13), array.get(a14_array, i))
array.set(combined_array, i + (40 * 14), array.get(a15_array, i))
array.set(combined_array, i + (40 * 15), array.get(a16_array, i))
array.set(combined_array, i + (40 * 16), array.get(a17_array, i))
array.set(combined_array, i + (40 * 17), array.get(a18_array, i))
array.set(combined_array, i + (40 * 18), array.get(a19_array, i))
array.set(combined_array, i + (40 * 19), array.get(a20_array, i))
array.set(combined_array, i + (40 * 20), array.get(a21_array, i))
array.set(combined_array, i + (40 * 21), array.get(a22_array, i))
array.set(combined_array, i + (40 * 22), array.get(a23_array, i))
array.set(combined_array, i + (40 * 23), array.get(a24_array, i))
array.set(combined_array, i + (40 * 24), array.get(a25_array, i))
array.set(combined_array, i + (40 * 25), array.get(a26_array, i))
array.set(combined_array, i + (40 * 26), array.get(a27_array, i))
array.set(combined_array, i + (40 * 27), array.get(a28_array, i))
array.set(combined_array, i + (40 * 28), array.get(a29_array, i))
array.set(combined_array, i + (40 * 29), array.get(a30_array, i))
array.set(combined_array, i + (40 * 30), array.get(a31_array, i))
array.set(combined_array, i + (40 * 31), array.get(a32_array, i))
array.set(combined_array, i + (40 * 32), array.get(a33_array, i))
array.set(combined_array, i + (40 * 33), array.get(a34_array, i))
array.set(combined_array, i + (40 * 34), array.get(a35_array, i))
array.set(combined_array, i + (40 * 35), array.get(a36_array, i))
array.set(combined_array, i + (40 * 36), array.get(a37_array, i))
array.set(combined_array, i + (40 * 37), array.get(a38_array, i))
array.set(combined_array, i + (40 * 38), array.get(a39_array, i))
array.set(combined_array, i + (40 * 39), array.get(a40_array, i))
Calculating Sums: A separate array_sums is created to store the total score for each asset by summing the values of their respective score arrays. This allows for easy comparison of overall performance.
Ranking Assets: The final part of the code ranks the assets based on their total scores stored in array_sums. It assigns a rank to each asset, where the asset with the highest score receives the highest rank.
// create array for asset RANK based on array.sum
var ranks = array.new_int(used_assets, 0)
// for loop that calculates the rank of each asset
if barstate.islast
for i = 0 to (used_assets - 1)
int rank = 1
for x = 0 to (used_assets - 1)
if i != x
if array.get(array_sums, i) < array.get(array_sums, x)
rank := rank + 1
array.set(ranks, i, rank)
Dynamic Table Creation
Initialization: The table is initialized with a base structure that includes headers for asset names, scores, and ranks. The headers are set to remain constant, ensuring clarity for users as they interpret the displayed data.
Data Population: As scores are calculated for each asset, the corresponding values are dynamically inserted into the table. This is achieved through a loop that iterates over the scores and ranks stored in the combined_array and array_sums, respectively.
Automatic Extending Mechanism
Variable Asset Count: The code checks the number of assets defined by the user. Instead of hardcoding the number of rows in the table, it uses a variable to determine the extent of the data that needs to be displayed. This allows the table to expand or contract based on the number of assets being analyzed.
Dynamic Row Generation: Within the loop that populates the table, the code appends new rows for each asset based on the current asset count. The structure of each row includes the asset name, its score, and its rank, ensuring that the table remains consistent regardless of how many assets are involved.
// Automatically extending table based on the number of used assets
var table table = table.new(position.bottom_center, 50, 50, color.new(color.black, 100), color.white, 3, color.white, 1)
if barstate.islast
if not hide_head
table.cell(table, 0, 0, "Universal Ratio Trend Matrix", text_color = color.white, bgcolor = #010c3b, text_size = fontSize)
table.merge_cells(table, 0, 0, used_assets + 3, 0)
if not hide_inps
table.cell(table, 0, 1,
text = "Inputs: You are using " + str.tostring(trend_indicator) + ", which takes: " + str.tostring(f_get_input(trend_indicator)),
text_color = color.white, text_size = fontSize), table.merge_cells(table, 0, 1, used_assets + 3, 1)
table.cell(table, 0, 2, "Assets", text_color = color.white, text_size = fontSize, bgcolor = #010c3b)
for x = 0 to (used_assets - 1)
table.cell(table, x + 1, 2, text = str.tostring(array.get(assets, x)), text_color = color.white, bgcolor = #010c3b, text_size = fontSize)
table.cell(table, 0, x + 3, text = str.tostring(array.get(assets, x)), text_color = color.white, bgcolor = f_asset_col(array.get(ranks, x)), text_size = fontSize)
for r = 0 to (used_assets - 1)
for c = 0 to (used_assets - 1)
table.cell(table, c + 1, r + 3, text = str.tostring(array.get(combined_array, c + (r * 40))),
text_color = hl_type == "Text" ? f_get_col(array.get(combined_array, c + (r * 40))) : color.white, text_size = fontSize,
bgcolor = hl_type == "Background" ? f_get_col(array.get(combined_array, c + (r * 40))) : na)
for x = 0 to (used_assets - 1)
table.cell(table, x + 1, x + 3, "", bgcolor = #010c3b)
table.cell(table, used_assets + 1, 2, "", bgcolor = #010c3b)
for x = 0 to (used_assets - 1)
table.cell(table, used_assets + 1, x + 3, "==>", text_color = color.white)
table.cell(table, used_assets + 2, 2, "SUM", text_color = color.white, text_size = fontSize, bgcolor = #010c3b)
table.cell(table, used_assets + 3, 2, "RANK", text_color = color.white, text_size = fontSize, bgcolor = #010c3b)
for x = 0 to (used_assets - 1)
table.cell(table, used_assets + 2, x + 3,
text = str.tostring(array.get(array_sums, x)),
text_color = color.white, text_size = fontSize,
bgcolor = f_highlight_sum(array.get(array_sums, x), array.get(ranks, x)))
table.cell(table, used_assets + 3, x + 3,
text = str.tostring(array.get(ranks, x)),
text_color = color.white, text_size = fontSize,
bgcolor = f_highlight_rank(array.get(ranks, x)))

A_Traders_Edge__LibraryLibrary "A_Traders_Edge__Library"
- A Trader's Edge (ATE)_Library was created to assist in constructing Market Overview Scanners (MOS)
LabelLocation(_firstLocation)
This function is used when there's a desire to print an assets ALERT LABELS at a set location on the scale that will
NOT change throughout the progression of the script. This is created so that if a lot of alerts are triggered, they
will stay relatively visible and not overlap each other. Ex. If you set your '_firstLocation' parameter as 1, since
there are a max of 40 assets that can be scanned, the 1st asset's location is assigned the value in the '_firstLocation' parameter,
the 2nd asset's location is the (1st asset's location+1)...and so on. If your first location is set to 81 then
the 1st asset is 81 and 2nd is 82 and so on until the 40th location = 120(in this particular example).
Parameters:
_firstLocation (simple int) : (simple int)
Optional(starts at 1 if no parameter added).
Location that you want the first asset to print its label if is triggered to do so.
ie. loc2=loc1+1, loc3=loc2+1, etc.
Returns: Returns 40 output variables each being a different location to print the labels so that an asset is asssigned to
a particular location on the scale. Regardless of if you have the maximum amount of assets being screened (40 max), this
function will output 40 locations… So there needs to be 40 variables assigned in the tuple in this function. What I
mean by that is you need to have 40 output location variables within your tuple (ie. between the ' ') regarless of
if your scanning 40 assets or not. If you only have 20 assets in your scripts input settings, then only the first 20
variables within the ' ' Will be assigned to a value location and the other 20 will be assigned 'NA', but their
variables still need to be present in the tuple.
SeparateTickerids(_string)
You must form this single tickerID input string exactly as described in the scripts info panel (little gray 'i' that
is circled at the end of the settings in the settings/input panel that you can hover your cursor over this 'i' to read the
details of that particular input). IF the string is formed correctly then it will break up this single string parameter into
a total of 40 separate strings which will be all of the tickerIDs that the script is using in your MO scanner.
Parameters:
_string (simple string) : (string)
A maximum of 40 Tickers (ALL joined as 1 string for the input parameter) that is formulated EXACTLY as described
within the tooltips of the TickerID inputs in my MOS Scanner scripts:
assets = input.text_area(tIDset1, title="TickerID (MUST READ TOOLTIP)", tooltip="Accepts 40 TICKERID's for each
copy of the script on the chart. TEXT FORMATTING RULES FOR TICKERID'S:
(1) To exclude the EXCHANGE NAME in the Labels, de-select the next input option.
(2) MUST have a space (' ') AFTER each TickerID.
(3) Capitalization in the Labels will match cap of these TickerID's.
(4) If your asset has a BaseCurrency & QuoteCurrency (ie. ADAUSDT ) BUT you ONLY want Labels
to show BaseCurrency(ie.'ADA'), include a FORWARD SLASH ('/') between the Base & Quote (ie.'ADA/USDT')", display=display.none)
Returns: Returns 40 output variables of the different strings of TickerID's (ie. you need to output 40 variables within the
tuple ' ' regardless of if you were scanning using all possible (40) assets or not.
If your scanning for less than 40 assets, then once the variables are assigned to all of the tickerIDs, the rest
of the 40 variables in the tuple will be assigned "NA".
TickeridForLabelsAndSecurity(_includeExchange, _ticker)
This function accepts the TickerID Name as its parameter and produces a single string that will be used in all of your labels.
Parameters:
_includeExchange (simple bool) : (bool)
Optional(if parameter not included in function it defaults to false ).
Used to determine if the Exchange name will be included in all labels/triggers/alerts.
_ticker (simple string) : (string)
For this parameter, input the varible named '_coin' from your 'f_main()' function for this parameter. It is the raw
Ticker ID name that will be processed.
Returns: ( )
Returns 2 output variables:
1st ('_securityTickerid') is to be used in the 'request.security()' function as this string will contain everything
TV needs to pull the correct assets data.
2nd ('lblTicker') is to be used in all of the labels in your MOS as it will only contain what you want your labels
to show as determined by how the tickerID is formulated in the MOS's input.
InvalidTID(_tablePosition, _stackVertical, _close, _securityTickerid, _invalidArray)
This is to add a table in the middle right of your chart that prints all the TickerID's that were either not formulated
correctly in the '_source' input or that is not a valid symbol and should be changed.
Parameters:
_tablePosition (simple string) : (string)
Optional(if parameter not included, it defaults to position.middle_right). Location on the chart you want the table printed.
Possible strings include: position.top_center, position.top_left, position.top_right, position.middle_center,
position.middle_left, position.middle_right, position.bottom_center, position.bottom_left, position.bottom_right.
_stackVertical (simple bool) : (bool)
Optional(if parameter not included, it defaults to true). All of the assets that are counted as INVALID will be
created in a list. If you want this list to be prited as a column then input 'true' here.
_close (float) : (float)
If you want them printed as a single row then input 'false' here.
This should be the closing value of each of the assets being tested to determine in the TickerID is valid or not.
_securityTickerid (string) : (string)
Throughout the entire charts updates, if a '_close' value is never regestered then the logic counts the asset as INVALID.
This will be the 1st TickerID varible (named _securityTickerid) outputted from the tuple of the TickeridForLabels()
function above this one.
_invalidArray (string ) : (array string)
Input the array from the original script that houses all of the invalidArray strings.
Returns: (na)
Returns a table with the screened assets Invalid TickerID's. Table draws automatically if any are Invalid, thus,
no output variable to deal with.
LabelSizes(_barCnt, _lblSzRfrnce)
This function sizes your Alert Trigger Labels according to the amount of Printed Bars the chart has printed within
a set time period, while also keeping in mind the smallest relative reference size you input in the 'lblSzRfrnceInput'
parameter of this function. A HIGHER % of Printed Bars(aka...more trades occurring for that asset on the exchange),
the LARGER the Name Label will print, potentially showing you the better opportunities on the exchange to avoid
exchange manipulation liquidations.
*** SHOULD NOT be used as size of labels that are your asset Name Labels next to each asset's Line Plot...
if your MOS includes these as you want these to be the same size for every asset so the larger ones dont cover the
smaller ones if the plots are all close to each other ***
Parameters:
_barCnt (float) : (float)
Get the 1st variable('barCnt') from the 'PrintedBarCount' function's tuple and input it as this functions 1st input
parameter which will directly affect the size of the 2nd output variable ('alertTrigLabel') outputted by this function.
_lblSzRfrnce (string) : (string)
Optional(if parameter not included, it defaults to size.small). This will be the size of the 1st variable outputted
by this function ('assetNameLabel') BUT also affects the 2nd variable outputted by this function.
Returns: ( )
Returns 2 variables:
1st output variable ('AssetNameLabel') is assigned to the size of the 'lblSzRfrnceInput' parameter.
2nd output variable('alertTrigLabel') can be of variying sizes depending on the 'barCnt' parameter...BUT the smallest
size possible for the 2nd output variable ('alertTrigLabel') will be the size set in the 'lblSzRfrnceInput' parameter.
AssetColor()
This function is used to assign 40 different colors to 40 variables to be used for the different labels/plots.
Returns: Returns 40 output variables each with a different color assigned to them to be used in your plots & labels.
Regardless of if you have the maximum amount of assets your scanning(40 max) or less,
this function will assign 40 colors to 40 variables that you have between the ' '.
PrintedBarCount(_time, _barCntLength, _barCntPercentMin)
The Printed BarCount Filter looks back a User Defined amount of minutes and calculates the % of bars that have printed
out of the TOTAL amount of bars that COULD HAVE been printed within the same amount of time.
Parameters:
_time (int) : (int)
The time associated with the chart of the particular asset that is being screened at that point.
_barCntLength (int) : (int)
The amount of time (IN MINUTES) that you want the logic to look back at to calculate the % of bars that have actually
printed in the span of time you input into this parameter.
_barCntPercentMin (int) : (int)
The minimum % of Printed Bars of the asset being screened has to be GREATER than the value set in this parameter
for the output variable 'bc_gtg' to be true.
Returns: ( )
Returns 2 outputs:
1st is the % of Printed Bars that have printed within the within the span of time you input in the '_barCntLength' parameter.
2nd is true/false according to if the Printed BarCount % is above the threshold that you input into the '_barCntPercentMin' parameter.
RCI(_rciLength, _source, _interval)
You will see me using this a lot. DEFINITELY my favorite oscillator to utilize for SO many different things from
timing entries/exits to determining trends.Calculation of this indicator based on Spearmans Correlation.
Parameters:
_rciLength (int) : (int)
Amount of bars back to use in RCI calculations.
_source (float) : (float)
Source to use in RCI calculations (can use ANY source series. Ie, open,close,high,low,etc).
_interval (int) : (int)
Optional(if parameter not included, it defaults to 3). RCI calculation groups bars by this amount and then will.
rank these groups of bars.
Returns: (float)
Returns a single RCI value that will oscillates between -100 and +100.
RCIAVG(firstLength, _amtBtLengths, _rciSMAlen, _source, _interval)
20 RCI's are averaged together to get this RCI Avg (Rank Correlation Index Average). Each RCI (of the 20 total RCI)
has a progressively LARGER Lookback Length. Though the RCI Lengths are not individually adjustable,
there are 2 factors that ARE:
(1) the Lookback Length of the 1st RCI and
(2) the amount of values between one RCI's Lookback Length and the next.
*** If you set 'firstLength' to it's default of 200 and '_amtBtLengths' to it's default of 120 (aka AMOUNT BETWEEN LENGTHS=120)...
then RCI_2 Length=320, RCI_3 Length=440, RCI_4 Length=560, and so on.
Parameters:
firstLength (int) : (int)
Optional(if parameter is not included when the function is called, then it defaults to 200).
This parameter is the Lookback Length for the 1st RCI used in the RCI Avg.
_amtBtLengths (int) : (int)
Optional(if parameter not included when the function is called, then it defaults to 120).
This parameter is the value amount between each of the progressively larger lengths used for the 20 RCI's that
are averaged in the RCI Avg.
***** BEWARE ***** Too large of a value here will cause the calc to look back too far, causing an error(thus the value must be lowered)
_rciSMAlen (int) : (int)
Unlike the Single RCI Function, this function smooths out the end result using an SMA with a length value that is this parameter.
_source (float) : (float)
Source to use in RCI calculations (can use ANY source series. Ie, open,close,high,low,etc).
_interval (int) : (int)
Optional(if parameter not included, it defaults to 3). Within the RCI calculation, bars next to each other are grouped together
and then these groups are Ranked against each other. This parameter is the number of adjacent bars that are grouped together.
Returns: (float)
Returns a single RCI value that is the Avg of many RCI values that will oscillate between -100 and +100.
PercentChange(_startingValue, _endingValue)
This is a quick function to calculate how much % change has occurred between the '_startingValue' and the '_endingValue'
that you input into the function.
Parameters:
_startingValue (float) : (float)
The source value to START the % change calculation from.
_endingValue (float) : (float)
The source value to END the % change caluclation from.
Returns: Returns a single output being the % value between 0-100 (with trailing numbers behind a decimal). If you want only
a certain amount of numbers behind the decimal, this function needs to be put within a formatting function to do so.
Rescale(_source, _oldMin, _oldMax, _newMin, _newMax)
Rescales series with a known '_oldMin' & '_oldMax'. Use this when the scale of the '_source' to
rescale is known (bounded).
Parameters:
_source (float) : (float)
Source to be normalized.
_oldMin (int) : (float)
The known minimum of the '_source'.
_oldMax (int) : (float)
The known maximum of the '_source'.
_newMin (int) : (float)
What you want the NEW minimum of the '_source' to be.
_newMax (int) : (float)
What you want the NEW maximum of the '_source' to be.
Returns: Outputs your previously bounded '_source', but now the value will only move between the '_newMin' and '_newMax'
values you set in the variables.
Normalize_Historical(_source, _minimumLvl, _maximumLvl)
Normalizes '_source' that has a previously unknown min/max(unbounded) determining the max & min of the '_source'
FROM THE ENTIRE CHARTS HISTORY. ]
Parameters:
_source (float) : (float)
Source to be normalized.
_minimumLvl (int) : (float)
The Lower Boundary Level.
_maximumLvl (int) : (float)
The Upper Boundary Level.
Returns: Returns your same '_source', but now the value will MOSTLY stay between the minimum and maximum values you set in the
'_minimumLvl' and '_maximumLvl' variables (ie. if the source you input is an RSI...the output is the same RSI value but
instead of moving between 0-100 it will move between the maxand min you set).
Normailize_Local(_source, _length, _minimumLvl, _maximumLvl)
Normalizes series with previously unknown min/max(unbounded). Much like the Normalize_Historical function above this one,
but rather than using the Highest/Lowest Values within the ENTIRE charts history, this on looks for the Highest/Lowest
values of '_source' within the last ___ bars (set by user as/in the '_length' parameter. ]
Parameters:
_source (float) : (float)
Source to be normalized.
_length (int) : (float)
The amount of bars to look back to determine the highest/lowest '_source' value.
_minimumLvl (int) : (float)
The Lower Boundary Level.
_maximumLvl (int) : (float)
The Upper Boundary Level.
Returns: Returns a single output variable being the previously unbounded '_source' that is now normalized and bound between
the values used for '_minimumLvl'/'_maximumLvl' of the '_source' within the user defined lookback period.
RSI mura visionOverview
The Enhanced RSI with Custom 40/60 Zones is a Pine Script™ v6 open-source indicator that builds on the classic Relative Strength Index by adding two additional horizontal levels at 40 and 60, alongside the standard 30/70. These extra zones help you identify early momentum shifts and distinguish trending markets from ranging ones with greater precision.
Key Features & Originality
* Custom Mid-Zones (40/60): Standard RSI signals can be noisy around the 50 midpoint. By marking 40 as a “weak momentum” threshold and 60 as a “strong momentum” confirmation, you get clearer entry and exit cues.
* Color-Coded Zones: The RSI line changes color when crossing 40, 50, 60, 70, and 30, letting you visually spot momentum acceleration or deceleration.
* Configurable Alerts: Built-in alert conditions fire when RSI crosses 40 or 60 in either direction, so you never miss a potential trend onset or exhaustion.
* Lightweight & Clean: No external dependencies, no look-ahead bias, and minimal repainting—ideal for both novice and professional traders.
How It Works
1. Momentum Decomposition: The standard 14-period RSI measures overbought/oversold extremes. Adding 40/60 lets you see when momentum shifts from neutral to bullish (crossing above 60) or bearish (dropping below 40) earlier than the classic 70/30 thresholds.
2. Trend Confirmation vs. Pullbacks: Readings between 40–60 often correspond to healthy pullbacks within a trend. A bounce off 40 suggests continuation; a rejection at 60 warns of a deeper pullback or reversal.
Usage & Inputs
* RSI Length (default 14): Period for calculating RSI.
* Level Inputs: Customize levels for overbought (70), support (60), neutral (50), weak (40), and oversold (30).
* Alert Toggles: Enable/disable alerts on each cross.
Why This Adds Value
* Early Signals: Capture trend beginnings before the market reaches extreme overbought/oversold levels.
* Noise Reduction: Filter sideways chop by watching the 40–60 corridor.
* Flexibility: Works on any timeframe or ticker.
Pine Script™ Version: v6
Open-Source License: MPL-2.0
Feel free to fork, modify, and share.

A_Taders_Edge_LIBRARYLibrary "A_Taders_Edge_LIBRARY"
RCI(_rciLength, _close, _interval, _outerMostRangeOfOscillator)
- You will see me using this a lot. DEFINITELY my favorite oscillator to utilize for SO many different things from timing entries/exits to determining trends.
Parameters:
_rciLength (int)
_close (float)
_interval (int)
_outerMostRangeOfOscillator (int)
Returns: - Outputs a single RCI value that will between (-)_outerMostRangeOfOscillator to (+)_outerMostRangeOfOscillator
InvalidTID(_close, _showInvalidAssets, _securityTickerid, _invalidArray)
- This is to add a table on the right of your chart that prints all the TickerID's that were either not formulated correctly in the scripts input or that is not a valid symbol and should be changed.
Parameters:
_close (float)
_showInvalidAssets (simple bool)
_securityTickerid (string)
_invalidArray (string )
Returns: - Does NOT return a value but rather the table with the invalid TickerID's from the scripts input that need to be changed.
LabelLocation(_firstLocation)
- This is ONLY for when you are wanting to print ALERT LABELS with the assets name for when an alert trigger occurs for that asset. There are a total of 40 assets that can be used in each copy of the script. You don't want labels from different assets printing on top of each other because you will not be able to read the asset name that the label is for. Ex. If you put your _firstLocation in the input settings as 1 and have 40 assets on this copy of the scanner then the first asset in the list is assigned to the location value 1 on the scale, and the 2nd in the list is assigned to location value 2...and so on. If your first location is set to 81 then the 1st asset is 81 and 2nd is 82 and so on.
Parameters:
_firstLocation (simple int)
Returns: - regardless of if you have the maximum amount of assets being screened (40 max), this export function will output 40 locations… So there needs to be 40 variables assigned to the tuple in this export function. What I mean by that is there needs to be 40 variables between the ' '. If you only have 20 assets in your scripts input settings, then only the first 20 variables within the ' ' Will be assigned to a value location and the other 20 will be assigned 'NA'.
SeparateTickerids(_string)
- You must form this single tickerID input string exactly as laid out in the water (a little gray circle at the end of the setting, that you hover your cursor over to read the details of). IF the string is formed correctly then it will break up. All of the tip rate is within the string into a total of 40 separate strings which will be all of the tickerIDs that the script is using in your MO scanner.
Parameters:
_string (simple string)
Returns: - this will output, 40 different security assets within the tuple output (ie. 40 variable within the ' ') regardless of if you were including 40 assets, to be screened in the MO Screener or not. if you have less than 40 assets, then once the variables are assigned to all of the tickerIDs, the rest of the variables will be assigned "NA".
TickeridForLabelsAndSecurity(_includeExchange, _ticker)
- this export function is used to output 2 tickerID strings. One is formulated to properly work in the request.security() function while the other is how it will appear on the asset name labels depending on how you form your assets string in the MO scanners input settings. Review the tooltip next to the setting, to learn how to form the string so that the asset name labels will appear how you want in the labels at the end of the line plots & the alert labels that would be triggered if the MO Scanner is set up to include Alert Trigger Labels.
Parameters:
_includeExchange (simple bool)
_ticker (simple string)
Returns: - this export function is used to output 2 tickerID strings. One is formulated to properly work in the request.security() function while the other is how it will appear on the asset name labels depending on how you form your assets string in the MO scanners input settings. Review the tooltip next to the setting, to learn how to form the string so that the asset name labels will appear how you want in the labels at the end of the line plots & the alert labels that would be triggered if the MO Scanner is set up to include Alert Trigger Labels.
PercentChange(_startingValue, _endingValue)
- this is a quick export function to calculate how much % change has occurred between the _startingValue and the _endingValue that you input into the export function.
Parameters:
_startingValue (float)
_endingValue (float)
Returns: - it will output a single percentage value between 0-100 with trailing numbers behind a decimal. If you want, only a certain amount of numbers behind the decimal, this export function needs to be put within a formatting function to do so. Explained in the MO Scanner INTRO VIDEO.
PrintedBarCount(_time, _barCntLength, _bcPmin)
- This export function will outfit the percentage of printed bars (that occurred within _barCntLength amount of time) out of the MAX amount of bars that potentially COULD HAVE been printed. Iexplanation in the MO Scanner INTRO VIDEO.
Parameters:
_time (int)
_barCntLength (int)
_bcPmin (int)
Returns: - Gives 2 outputs. The first is the total % of Printed Bars within the user set time period and second is true/false according to if the Printed BarCount % is above the _bcPmin threshold that you input into this export function.

ADX mura visionOverview
The Enhanced ADX with Custom 40/60 Levels is a Pine Script™ v6 open-source indicator that builds on the classic Average Directional Index by adding two critical thresholds at 40 and 60. These extra levels give you early warning of trend exhaustion and precise exit signals when paired with the mura indicator.
Key Features & Originality
Custom Thresholds (40/60): Beyond the standard ADX levels (25/50), levels at 40 and 60 mark advanced trend strength phases and highlight when momentum is beginning to fade.
Trend Weakness Alerts: Configurable alerts trigger when ADX dips below 60 or 40, signaling ideal exit opportunities before a full reversal.
Color-Coded ADX Line: The ADX line dynamically changes color upon crossing 40 and 60, making trend strength transitions instantly visible.
mura Indicator Synergy: Specially designed to complement the mura indicator—when mura signals an exit and ADX falls below your chosen threshold, you get a high-confidence cue to close your position.
How It Works
Advanced Trend Phases: ADX above 25 confirms a trend, above 40 indicates strong momentum, and above 60 signals extreme strength. A drop below 60 or 40 warns of weakening momentum.
Exit Confirmation: Combine a mura exit signal (e.g., dot flip or reversal) with an ADX cross below 40/60 to capture optimal exit points.
Usage & Inputs
ADX Length (default 14): Period for ADX calculation.
Level Inputs: Customize your threshold levels (default: 25, 40, 50, 60).
Alert Toggles: Enable alerts on crosses above or below each level.
Style Settings: Adjust line colors and widths for ADX and threshold lines.
Why This Adds Value
Early Exit Signals: Identify momentum loss before major reversals, protecting profits.
Cleaner Trade Management: Visual cues reduce guesswork when exiting trades.
Modular Design: Use standalone or integrate with mura for robust entry/exit workflows.
Pine Script™ Version: v6
Open-Source License: MPL-2.0

Strategy Template - V2This is an educational script created to demonstrate few basic building blocks of a trend based strategy and how to achieve different entry and exit types. My initial intention was to create a comprehensive strategy template which covers all the aspects of strategy. But, ended up creating fully fledged strategy based on trend following.
This is an enhancement on Strategy-Template But this script is comparitively more complex. Hence I decided to create new version instead of updating the existing one.
Lets dive deep.
SIMPLE COMPONENTS OF TREND FOLLOWING STRATEGY
TREND BIAS - This defines the direction of trend. Idea is not to trade against the trend direction. If the bias is bullish, look for long opportunities and if bias is bearish, look for short opportunities. Stay out of the market when the bias is neutral.
Often, trend bias is determined based on longer timeframe conditions. Example - 200 Moving Average, Higher timeframe moving averages, Higher timeframe high-lows etc. can be used for determining the trend bias.
In this script, I am using Weekly donchian channels combined with daily donchian channels to define trend bias.
Long Bias - 40 Day donchian channel sits completely in upper portion of 40 Week dochnial channel.
Short Bias - 40 Day donchian channel sits completely in lower portion of 40 Week donchian channel.
ENTRY CONDITION - Entry signals are generated only in the direction of bias. Hence, when in LongBias, we only get Long signals and when in short bias, we only get short signals.
In our case, when in Long Bias - if price hits 40 day high for the first time, this creates our long entry signal. Similarly when in Short Bias , price hitting 40 day low will create signal for going short. Since we do not take trades opposite to trend, no entry conditions are formed when price hits 40 day high in Short Bias or 40 day low in Long Bias.
EXIT CONDITION - Exit conditions are formed when we get signals of trend failure.
In our case, when in long trade, price hitting 40 day low creates exit signal. Similarly when in short trade price hitting 40 day high creates exit signal for short trade.
DIFFERENT TYPES OF ENTRY AND EXIT
In this script, I have tried to demonstrate different entry and exit types.
Entry types
Market - Enter immediately when entry signal is received. That is, in this case when price crossover over high in long bias and crosses under low in short bias
Stop - This method includes estimating at what level new highs are made and creating a stop buy order at that level. This way, we do not miss if the break out is stronger. But, susciptible to fail during fakeouts.
Limit - This method includes executing a limit order to buy at lower price or sell at higher price. In trend following methods, downside of limit order is when there is genuine breakout, these limit orders may not hit and during trend failures the limit orders are likely to hit and go straight to stop.
Stop-Limit - this is same as stop order but will also place a limit condition to avoid buying on overextended breakout or with lots of slippage.
Exit types
Market - whether to keep the existing trade running or whether to close it is determined after close of each bar and exit orders are executed manually upon receiving exit signal.
Stop - We place stop loss orders beforehand when there is a trade in place. This can help in avoiding big movements against trade within bar. But, this may also stop on false signals or fakeouts.
Take profit
Stop - No take profits are configured.
Target - 30% of the positions are closed when take profit levels are hit. Take profit levels are defined by risk reward.
USING THE CODE AS TEMPLATE
As mentioned earlier, I intended to create a fully fledged strategy template. But, ended up creating a fully fledged stratgy. However, you can take some part of this code and use it to start your own strategy. Will explain what all things can be adopted without worrying about the strategy implementation within
Strategy definition : This can be copied as is and just change the title of strategy. This defines some of the commonly used parameters of strategy which can help with close to realistic backtesting results for your coded strategy and comparison with buy and hold.
Generic Strategy Parameters : The parameter which defines controlling alllowed trade direction and trading window are present here. This again can be copied as is and variable inDateRange can be directly used in entry conditions.
Generic Methods : f_getMovingAverage and f_secureSecurity are handy and can be used as is. atr method provideded by pine gives you ATR based on RMA. If you want SMA or any other moving average based ATR, you can use the method f_getCustomAtr
Trade Statements : This section has all types of trading instructions which includes market/stop/limit/stop-limit type of entries and exits and take profit statements. You can adopt the type of entry you are interested in and change when condition to suit your strategy.
Trade conditions and levels : This section is required. But, cannot be copied. All the trade logic goes here which also sets parameters which are used in when of Trade Statements.
Hope this helps.

Constance Brown RSI with Composite IndexConstance Brown RSI with Composite Index
Overview
This indicator combines Constance Brown's RSI interpretation methodology with a Composite Index and ATR Distance to VWAP measurement to provide a comprehensive trading tool. It helps identify trends, momentum shifts, overbought/oversold conditions, and potential reversal points.
Key Features
Color-coded RSI zones for immediate trend identification
Composite Index for momentum analysis and divergence detection
ATR Distance to VWAP for identifying extreme price deviations
Automatic divergence detection for early reversal warnings
Pre-configured alerts for key trading signals
How to Use This Indicator
Trend Identification
The RSI line changes color based on its position:
Blue zone (RSI > 50): Bullish trend - look for buying opportunities
Purple zone (RSI < 50): Bearish trend - look for selling opportunities
Gray zone (RSI 40-60): Neutral/transitional market - prepare for potential breakout
The 40-50 area (light blue fill) acts as support during uptrends, while the 50-60 area (light purple fill) acts as resistance during downtrends.
// From the code:
upTrendZone = rsiValue > 50 and rsiValue <= 90
downTrendZone = rsiValue < 50 and rsiValue >= 10
neutralZone = rsiValue > 40 and rsiValue < 60
rsiColor = neutralZone ? neutralRSI : upTrendZone ? upTrendRSI : downTrendRSI
Momentum Analysis
The Composite Index (fuchsia line) provides momentum confirmation:
Values above 50 indicate positive momentum
Values below 40 indicate negative momentum
Crossing above/below these thresholds signals potential momentum shifts
// From the code:
compositeIndexRaw = rsiChange / ta.stdev(rsiValue, rsiLength)
compositeIndex = ta.sma(compositeIndexRaw, compositeSmoothing)
compositeScaled = compositeIndex * 10 + 50 // Scaled to fit 0-100 range
Overbought/Oversold Detection
The ATR Distance to VWAP table in the top-right corner shows how far price has moved from VWAP in terms of ATR units:
Extreme positive values (orange/red): Potentially overbought
Extreme negative values (purple/red): Potentially oversold
Near zero (gray): Price near average value
// From the code:
priceDistance = (close - vwapValue) / ta.atr(atrPeriod)
// Color coding based on distance value
Divergence Trading
The indicator automatically detects divergences between the Composite Index and price:
Bullish divergence: Price makes lower low but Composite Index makes higher low
Bearish divergence: Price makes higher high but Composite Index makes lower high
// From the code:
divergenceBullish = ta.lowest(compositeIndex, rsiLength) > ta.lowest(close, rsiLength)
divergenceBearish = ta.highest(compositeIndex, rsiLength) < ta.highest(close, rsiLength)
Trading Strategies
Trend Following
1. Identify the trend using RSI color:
Blue = Uptrend, Purple = Downtrend
2. Wait for pullbacks to support/resistance zones:
In uptrends: Buy when RSI pulls back to 40-50 zone and bounces
In downtrends: Sell when RSI rallies to 50-60 zone and rejects
3. Confirm with Composite Index:
Uptrends: Composite Index stays above 50 or quickly returns above it
Downtrends: Composite Index stays below 50 or quickly returns below it
4. Manage risk using ATR Distance:
Take profits when ATR Distance reaches extreme values
Place stops beyond recent swing points
Reversal Trading
1. Look for divergences
Bullish: Price makes lower low but Composite Index makes higher low
Bearish: Price makes higher high but Composite Index makes lower high
2. Confirm with ATR Distance:
Extreme readings suggest potential reversals
3. Wait for RSI zone transition:
Bullish: RSI crosses above 40 (purple to neutral/blue)
Bearish: RSI crosses below 60 (blue to neutral/purple)
4. Enter after confirmation:
Use candlestick patterns for precise entry
Place stops beyond the divergence point
Four pre-configured alerts are available:
Momentum High: Composite Index above 50
Momentum Low: Composite Index below 40
Bullish Divergence: Composite Index higher low
Bearish Divergence: Composite Index lower high
Customization
Adjust these parameters to optimize for your trading style:
RSI Length: Default 14, lower for more sensitivity, higher for fewer signals
Composite Index Smoothing: Default 10, lower for quicker signals, higher for less noise
ATR Period: Default 14, affects the ATR Distance to VWAP calculation
This indicator works well across various markets and timeframes, though the default settings are optimized for daily charts. Adjust parameters for shorter or longer timeframes as needed.
Happy trading!

Regime Filter IndicatorRegime Filter – Crypto Market Trend Indicator
📊 Overview
The Regime Filter is a powerful market analysis indicator designed specifically for crypto trading. It helps traders identify whether the market is in a bullish or bearish phase by analyzing key assets in the cryptocurrency market, including Bitcoin (BTC), Bitcoin Dominance (BTC.D), and the Altcoin Market (TOTAL3). The indicator compares these assets against their respective Simple Moving Averages (SMA) to determine the overall market regime, allowing traders to make more informed decisions.
🔍 How It Works
The Regime Filter evaluates three main components to determine the market's sentiment:
1. BTC Dominance (BTC.D) vs. 40 SMA (Medium Timeframe)
The Bitcoin Dominance (BTC.D) is compared to its 40-period SMA on a mid-timeframe (e.g.,
1-hour). If BTC.D is below the 40 SMA, it indicates that altcoins are performing well relative
to Bitcoin, suggesting a bullish altcoin market. If BTC.D is above the 40 SMA, Bitcoin is
gaining dominance, indicating a potential bearish phase for altcoins.
2. TOTAL3 Market Cap vs. 100 SMA (Medium Timeframe)
The TOTAL3 index, which tracks the total market capitalization of all cryptocurrencies except
Bitcoin and Ethereum, is compared to its 100-period SMA. A bullish signal occurs when TOTAL3
is above the 100 SMA, indicating strength in altcoins, while a bearish signal occurs when
TOTAL3 is below the 100 SMA, signaling a potential weakness in the altcoin market.
3. BTC Price vs. 200 SMA (Higher Timeframe)
The current Bitcoin price is compared to its 200-period Simple Moving Average (SMA) on a
higher timeframe (e.g., 4-hour). A bullish signal is given when the BTC price is above the 200
SMA, and a bearish signal when it's below.
🟢 Bullish Market Conditions
The market is considered bullish when:
- BTC Dominance (BTC.D) is below the 40 SMA, suggesting altcoins are gaining momentum.
- TOTAL3 Market Cap is above the 100 SMA, signaling strength in the altcoin market.
- BTC price is above the 200 SMA, indicating an uptrend in Bitcoin.
In these conditions, the background turns green 🟢, and a "Bullish" label is displayed on the chart.
🔴 Bearish Market Conditions
The market is considered bearish when:
- BTC Dominance (BTC.D) is above the 40 SMA, indicating Bitcoin is outperforming altcoins.
- TOTAL3 Market Cap is below the 100 SMA, signaling weakness in altcoins.
- BTC price is below the 200 SMA, indicating a downtrend in Bitcoin.
In these conditions, the background turns red 🔴, and a "Bearish" label appears on the chart.
⚙ Customization Options
- The Regime Filter offers flexibility for traders:
- Enable or Disable Specific SMAs: Customize the indicator by enabling or disabling the 200 SMA for Bitcoin, the 40 SMA for BTC Dominance, and the 100 SMA for TOTAL3.
- Adjust Timeframes: Choose the timeframes for each of the moving averages to suit your preferred trading strategy.
- Real-Time Data Adjustments: The indicator updates in real-time to reflect current market conditions, ensuring timely analysis.
📈 Best Use Cases
- Trend Confirmation: The Regime Filter is ideal for confirming the market's overall trend,
helping traders to align their positions with the dominant market sentiment.
- Trade Entry/Exit Signals: Use the indicator to identify favorable entry or exit points based on
whether the market is in a bullish or bearish phase.
- Market Overview: Gain a quick understanding of the broader crypto market, with a focus on
Bitcoin and altcoins, to make more strategic decisions.
⚠️ Important Notes
Trend-Following Indicator: The Regime Filter is a trend-following tool, meaning it works best in strong trending markets. It may not perform well in choppy, sideways markets.
Risk Management: This indicator is designed to assist in identifying market trends, but it does not guarantee profits. Always apply sound risk management strategies and use additional indicators when making trading decisions.
Not a Profit Guarantee: While this indicator can help identify potential market trends, no trading tool or strategy guarantees profits. Please trade responsibly and ensure that your decisions are based on comprehensive analysis and risk tolerance.

IPO Lifecycle Sell Strategy [JARUTIR]IPO Lifecycle Sell Strategy with Dynamic Buy Date and Multiple Sell Rules
This custom TradingView script is designed for traders looking to capitalize on dynamic strategies for IPOs and growth stocks, by implementing several sell rules based on price action and technical indicators. It provides a set of sell rules that are applied dynamically depending on the stock's lifecycle and price action, allowing users to lock in profits and minimize drawdowns based on key technical thresholds.
The four sell strategies incorporated into this script are inspired by the book "The Lifecycle Trade", a resource that focuses on capturing profits while managing risk in different phases of a stock's lifecycle, from IPO to high-growth stages.
Key Features:
Buy Price and Buy Date: You can either manually input your buy price and date or let the script automatically detect the buy date based on the specified buy price.
Multiple Sell Strategies: Choose from 4 predefined sell strategies:
Ascender Rule : Captures strong momentum from IPO stocks by selling portions at specific price levels or technical conditions.
Midterm Rule : Focuses on holding for longer periods, with defensive sell signals triggered when the stock deviates significantly from peak price or key moving averages.
40 Week Rule : Designed for long-term holds, this rule triggers a sell when the stock closes below the 40-week moving average.
Everest Rule : Aggressive strategy for selling into strength based on parabolic moves or gap downs, ideal for high momentum stocks.
Interactive Features:
Horizontal Green Line showing the buy price level from the buy date.
Visual Sell Signals appear only after the buy date to ensure that your analysis is relevant to the stock lifecycle.
Customizable settings, allowing you to choose your preferred sell rule strategy and automate buy date detection.
This script is perfect for traders using a strategic, systematic approach to IPOs and high-growth stocks, whether you're looking for quick exits during momentum phases or holding for longer-term growth.
Usage:
Input your Buy Price and Buy Date, or allow the script to automate the buy date detection.
Select a Sell Rule strategy based on your risk profile and trading style.
View visual signals for selling when specific conditions are met.
Frequently Asked Questions (FAQs):
Q1: How do I input my Buy Price and Buy Date?
The script allows you to either manually input the Buy Price and Buy Date or use the automated detection. If you choose automated detection, the script will automatically assign the buy date when the price crosses above your set Buy Price.
Q2: What is the purpose of the "Sell Rules"?
The script offers four sell strategies to help manage different types of stocks in varying phases of their lifecycle:
Ascender Rule: Targets IPO stocks showing positive momentum.
Midterm Rule: A defensive strategy for stocks in a steady uptrend.
40 Week Rule: Long-term hold strategy designed to ride stocks through extended growth.
Everest Rule: Aggressive strategy to capture profits during parabolic price moves.
Q3: What is the significance of the Green Line at Buy Price?
The Green Line represents your entry point (Buy Price) on the chart. It will appear from the buy date onwards, helping you track the performance of your stock relative to your entry.
Q4: Can I customize the Sell Strategy?
Yes! You can choose from the available Sell Rules (Ascender Rule, Midterm Rule, 40 Week Rule, Everest Rule) via an input option in the script. Each strategy has its own unique triggers based on price action, moving averages, and time-based conditions.
Q5: Does this script work for stocks and crypto?
Yes, this script is designed for both stocks and cryptocurrencies. It works on any asset where price data and timeframes are available.
Q6: How do the Weekly Moving Averages (WSMA) work in this strategy?
The script uses weekly moving averages (WSMA) to track longer-term trends. These are essential for some of the sell rules, such as the Midterm Rule and 40 Week Rule, which rely on the stock's movement relative to the 40-week moving average.
Q7: Will the script plot a Sell Signal immediately after the Buy Date?
No, sell signals will only be plotted after the Buy Date. This ensures that the sell strategy is relevant to your actual holding period and avoids premature triggers.
Q8: How do I interpret the Sell Signal?
The script will plot a Red Sell Signal above the bar when the sell conditions are met, based on the selected strategy. This indicates that it may be a good time to exit the position according to your chosen rule.
Q9: Can I use this strategy on different timeframes?
Yes, you can apply the script to any timeframe. However, some sell strategies, like the Midterm Rule and 40 Week Rule, are designed to work best with weekly data, so it's recommended to use these strategies with longer timeframes.
Q10: Does this script have any alerts?
Yes! The script supports alert conditions that will notify you when the sell conditions are met according to your selected rule. You can set up alerts to stay informed without needing to watch the chart constantly.
Q11: What if I want to disable some of the sell rules?
You can select your preferred sell rule using the "Select Sell Rule" dropdown. If you don’t want to use a particular rule, simply choose a different strategy or leave it inactive.
------------------------------
Disclaimer:
This strategy is intended for educational purposes only. It should not be considered financial advice. Always perform your own research and consult with a professional before making any trading decisions. Trading involves significant risk, and you should never trade with money you cannot afford to lose.

COMET_Scanner_Library_FINALLibrary "COMET_Scanner_Library"
- A Trader's Edge (ATE)_Library was created to assist in constructing COM Scanners
TickerIDs(_string)
TickerIDs: You must form this single tickerID input string exactly as described in the scripts info panel (little gray 'i' that
is circled at the end of the settings in the settings/input panel that you can hover your cursor over this 'i' to read the
details of that particular input). IF the string is formed correctly then it will break up this single string parameter into
a total of 40 separate strings which will be all of the tickerIDs that the script is using in your COM Scanner.
Parameters:
_string (simple string) : (string)
A maximum of 40 Tickers (ALL joined as 1 string for the input parameter) that is formulated EXACTLY as described
within the tooltips of the TickerID inputs in my COM Scanner scripts:
assets = input.text_area(tIDs, title="TickerIDs (MUST READ TOOLTIP)", group=g2, tooltip="Accepts 40 TICKERID's
for each copy of the script on the chart. \n\n*** MUST FORMAT THIS WAY ***\n\n Each FULL tickerID
(ie 'Exchange:ticker') must be separated by A SINGLE BLANK SPACE for correct formatting. The blank space tells
the script where to break off the ticker to assign it to a variable to be used later in the script. So this input
will be a single string constructed from up to 40 tickerID's with a space between each tickerID
(ie. 'BINANCE:BTCUSDT BINANCE:SXPUSDT BINANCE:XRPUSDT').", display=display.none)
Returns: Returns 40 output variables in the tuple (ie. between the ' ') with the separated TickerIDs,
Locations(_firstLocation)
Locations: This function is used when there's a desire to print an assets ALERT LABELS. A set Location on the scale is assigned to each asset.
This is created so that if a lot of alerts are triggered, they will stay relatively visible and not overlap each other.
If you set your '_firstLocation' parameter as 1, since there are a max of 40 assets that can be scanned, the 1st asset's location
is assigned the value in the '_firstLocation' parameter, the 2nd asset's location is the (1st asset's location+1)...and so on.
Parameters:
_firstLocation (simple int) : (simple int)
Optional (starts at 1 if no parameter added).
Location that you want the first asset to print its label if is triggered to do so.
ie. loc2=loc1+1, loc3=loc2+1, etc.
Returns: Returns 40 variables for the locations for alert labels
LabelSize(_barCnt, _lblSzRfrnce)
INVALID TICKERIDs: This is to add a table in the middle right of your chart that prints all the TickerID's that were either not formulated
correctly in the '_source' input or that is not a valid symbol and should be changed.
LABEL SIZES: This function sizes your Alert Trigger Labels according to the amount of Printed Bars the chart has printed within
a set time period, while also keeping in mind the smallest relative reference size you input in the 'lblSzRfrnceInput'
parameter of this function. A HIGHER % of Printed Bars(aka...more trades occurring for that asset on the exchange),
the LARGER the Name Label will print, potentially showing you the better opportunities on the exchange to avoid
exchange manipulation liquidations.
*** SHOULD NOT be used as size of labels that are your asset Name Labels next to each asset's Line Plot...
if your COM Scanner includes these as you want these to be the same size for every asset so the larger ones dont cover the
smaller ones if the plots are all close to each other ***
Parameters:
_barCnt (float) : (float)
Get the 1st variable('barCnt') from the Security function's tuple and input it as this functions 1st input
parameter which will directly affect the size of the 2nd output variable ('alertTrigLabel') that is also outputted by this function.
_lblSzRfrnce (string) : (string)
Optional (if parameter not included, it defaults to size.small). This will be the size of the variable outputted
by this function named 'assetNameLabel' BUT also affects the size of the output variable 'alertTrigLabel' as it uses this parameter's size
as the smallest size for 'alertTrigLabel' then uses the '_barCnt' parameter to determine the next sizes up depending on the "_barCnt" value.
Returns: ( )
Returns 2 variables:
1st output variable ('AssetNameLabel') is assigned to the size of the 'lblSzRfrnceInput' parameter.
2nd output variable('alertTrigLabel') can be of variying sizes depending on the 'barCnt' parameter...BUT the smallest
size possible for the 2nd output variable ('alertTrigLabel') will be the size set in the 'lblSzRfrnceInput' parameter.
InvalidTickerIDs(_close, _securityTickerid, _invalidArray, _tablePosition, _stackVertical)
Parameters:
_close (float)
_securityTickerid (string)
_invalidArray (array)
_tablePosition (simple string)
_stackVertical (simple bool)
PrintedBarCount(_time, _barCntLength, _barCntPercentMin)
The Printed BarCount Filter looks back a User Defined amount of minutes and calculates the % of bars that have printed
out of the TOTAL amount of bars that COULD HAVE been printed within the same amount of time.
Parameters:
_time (int) : (int)
The time associated with the chart of the particular asset that is being screened at that point.
_barCntLength (int) : (int)
The amount of time (IN MINUTES) that you want the logic to look back at to calculate the % of bars that have actually
printed in the span of time you input into this parameter.
_barCntPercentMin (int) : (int)
The minimum % of Printed Bars of the asset being screened has to be GREATER than the value set in this parameter
for the output variable 'bc_gtg' to be true.
Returns: ( )
Returns 2 outputs:
1st is the % of Printed Bars that have printed within the within the span of time you input in the '_barCntLength' parameter.
2nd is true/false according to if the Printed BarCount % is above the threshold that you input into the '_barCntPercentMin' parameter.

COM_Scanner_LibraryLibrary "COM_Scanner_Library"
- A Trader's Edge (ATE)_Library was created to assist in constructing COM Scanners
TickerIDs(_string)
TickerIDs: You must form this single tickerID input string exactly as described in the scripts info panel (little gray 'i' that
is circled at the end of the settings in the settings/input panel that you can hover your cursor over this 'i' to read the
details of that particular input). IF the string is formed correctly then it will break up this single string parameter into
a total of 40 separate strings which will be all of the tickerIDs that the script is using in your COM Scanner.
Parameters:
_string (simple string) : (string)
A maximum of 40 Tickers (ALL joined as 1 string for the input parameter) that is formulated EXACTLY as described
within the tooltips of the TickerID inputs in my COM Scanner scripts:
assets = input.text_area(tIDs, title="TickerIDs (MUST READ TOOLTIP)", group=g2, tooltip="Accepts 40 TICKERID's
for each copy of the script on the chart. \n\n*** MUST FORMAT THIS WAY ***\n\n Each FULL tickerID
(ie 'Exchange:ticker') must be separated by A SINGLE BLANK SPACE for correct formatting. The blank space tells
the script where to break off the ticker to assign it to a variable to be used later in the script. So this input
will be a single string constructed from up to 40 tickerID's with a space between each tickerID
(ie. 'BINANCE:BTCUSDT BINANCE:SXPUSDT BINANCE:XRPUSDT').", display=display.none)
Returns: Returns 40 output variables in the tuple (ie. between the ' ') with the separated TickerIDs,
Locations(_firstLocation)
Locations: This function is used when there's a desire to print an assets ALERT LABELS. A set Location on the scale is assigned to each asset.
This is created so that if a lot of alerts are triggered, they will stay relatively visible and not overlap each other.
If you set your '_firstLocation' parameter as 1, since there are a max of 40 assets that can be scanned, the 1st asset's location
is assigned the value in the '_firstLocation' parameter, the 2nd asset's location is the (1st asset's location+1)...and so on.
Parameters:
_firstLocation (simple int) : (simple int)
Optional (starts at 1 if no parameter added).
Location that you want the first asset to print its label if is triggered to do so.
ie. loc2=loc1+1, loc3=loc2+1, etc.
Returns: Returns 40 variables for the locations for alert labels
LabelSize(_barCnt, _lblSzRfrnce)
INVALID TICKERIDs: This is to add a table in the middle right of your chart that prints all the TickerID's that were either not formulated
correctly in the '_source' input or that is not a valid symbol and should be changed.
LABEL SIZES: This function sizes your Alert Trigger Labels according to the amount of Printed Bars the chart has printed within
a set time period, while also keeping in mind the smallest relative reference size you input in the 'lblSzRfrnceInput'
parameter of this function. A HIGHER % of Printed Bars(aka...more trades occurring for that asset on the exchange),
the LARGER the Name Label will print, potentially showing you the better opportunities on the exchange to avoid
exchange manipulation liquidations.
*** SHOULD NOT be used as size of labels that are your asset Name Labels next to each asset's Line Plot...
if your COM Scanner includes these as you want these to be the same size for every asset so the larger ones dont cover the
smaller ones if the plots are all close to each other ***
Parameters:
_barCnt (float) : (float)
Get the 1st variable('barCnt') from the Security function's tuple and input it as this functions 1st input
parameter which will directly affect the size of the 2nd output variable ('alertTrigLabel') that is also outputted by this function.
_lblSzRfrnce (string) : (string)
Optional (if parameter not included, it defaults to size.small). This will be the size of the variable outputted
by this function named 'assetNameLabel' BUT also affects the size of the output variable 'alertTrigLabel' as it uses this parameter's size
as the smallest size for 'alertTrigLabel' then uses the '_barCnt' parameter to determine the next sizes up depending on the "_barCnt" value.
Returns: ( )
Returns 2 variables:
1st output variable ('AssetNameLabel') is assigned to the size of the 'lblSzRfrnceInput' parameter.
2nd output variable('alertTrigLabel') can be of variying sizes depending on the 'barCnt' parameter...BUT the smallest
size possible for the 2nd output variable ('alertTrigLabel') will be the size set in the 'lblSzRfrnceInput' parameter.
InvalidTickerIDs(_close, _securityTickerid, _invalidArray, _tablePosition, _stackVertical)
Parameters:
_close (float)
_securityTickerid (string)
_invalidArray (array)
_tablePosition (simple string)
_stackVertical (simple bool)
PrintedBarCount(_time, _barCntLength, _barCntPercentMin)
The Printed BarCount Filter looks back a User Defined amount of minutes and calculates the % of bars that have printed
out of the TOTAL amount of bars that COULD HAVE been printed within the same amount of time.
Parameters:
_time (int) : (int)
The time associated with the chart of the particular asset that is being screened at that point.
_barCntLength (int) : (int)
The amount of time (IN MINUTES) that you want the logic to look back at to calculate the % of bars that have actually
printed in the span of time you input into this parameter.
_barCntPercentMin (int) : (int)
The minimum % of Printed Bars of the asset being screened has to be GREATER than the value set in this parameter
for the output variable 'bc_gtg' to be true.
Returns: ( )
Returns 2 outputs:
1st is the % of Printed Bars that have printed within the within the span of time you input in the '_barCntLength' parameter.
2nd is true/false according to if the Printed BarCount % is above the threshold that you input into the '_barCntPercentMin' parameter.
CCOMET_Scanner_LibraryLibrary "CCOMET_Scanner_Library"
- A Trader's Edge (ATE)_Library was created to assist in constructing CCOMET Scanners
Loc_tIDs_Col(_string, _firstLocation)
TickerIDs: You must form this single tickerID input string exactly as described in the scripts info panel (little gray 'i' that
is circled at the end of the settings in the settings/input panel that you can hover your cursor over this 'i' to read the
details of that particular input). IF the string is formed correctly then it will break up this single string parameter into
a total of 40 separate strings which will be all of the tickerIDs that the script is using in your CCOMET Scanner.
Locations: This function is used when there's a desire to print an assets ALERT LABELS. A set Location on the scale is assigned to each asset.
This is created so that if a lot of alerts are triggered, they will stay relatively visible and not overlap each other.
If you set your '_firstLocation' parameter as 1, since there are a max of 40 assets that can be scanned, the 1st asset's location
is assigned the value in the '_firstLocation' parameter, the 2nd asset's location is the (1st asset's location+1)...and so on.
Parameters:
_string (simple string) : (string)
A maximum of 40 Tickers (ALL joined as 1 string for the input parameter) that is formulated EXACTLY as described
within the tooltips of the TickerID inputs in my CCOMET Scanner scripts:
assets = input.text_area(tIDset1, title="TickerID (MUST READ TOOLTIP)", tooltip="Accepts 40 TICKERID's for each
copy of the script on the chart. TEXT FORMATTING RULES FOR TICKERID'S:
(1) To exclude the EXCHANGE NAME in the Labels, de-select the next input option.
(2) MUST have a space (' ') AFTER each TickerID.
(3) Capitalization in the Labels will match cap of these TickerID's.
(4) If your asset has a BaseCurrency & QuoteCurrency (ie. ADAUSDT ) BUT you ONLY want Labels
to show BaseCurrency(ie.'ADA'), include a FORWARD SLASH ('/') between the Base & Quote (ie.'ADA/USDT')", display=display.none)
_firstLocation (simple int) : (simple int)
Optional (starts at 1 if no parameter added).
Location that you want the first asset to print its label if is triggered to do so.
ie. loc2=loc1+1, loc3=loc2+1, etc.
Returns: Returns 40 output variables in the tuple (ie. between the ' ') with the TickerIDs, 40 variables for the locations for alert labels, and 40 Colors for labels/plots
TickeridForLabelsAndSecurity(_ticker, _includeExchange)
This function accepts the TickerID Name as its parameter and produces a single string that will be used in all of your labels.
Parameters:
_ticker (simple string) : (string)
For this parameter, input the varible named '_coin' from your 'f_main()' function for this parameter. It is the raw
Ticker ID name that will be processed.
_includeExchange (simple bool) : (bool)
Optional (if parameter not included in function it defaults to false ).
Used to determine if the Exchange name will be included in all labels/triggers/alerts.
Returns: ( )
Returns 2 output variables:
1st ('_securityTickerid') is to be used in the 'request.security()' function as this string will contain everything
TV needs to pull the correct assets data.
2nd ('lblTicker') is to be used in all of the labels in your CCOMET Scanner as it will only contain what you want your labels
to show as determined by how the tickerID is formulated in the CCOMET Scanner's input.
InvalID_LblSz(_barCnt, _close, _securityTickerid, _invalidArray, _tablePosition, _stackVertical, _lblSzRfrnce)
INVALID TICKERIDs: This is to add a table in the middle right of your chart that prints all the TickerID's that were either not formulated
correctly in the '_source' input or that is not a valid symbol and should be changed.
LABEL SIZES: This function sizes your Alert Trigger Labels according to the amount of Printed Bars the chart has printed within
a set time period, while also keeping in mind the smallest relative reference size you input in the 'lblSzRfrnceInput'
parameter of this function. A HIGHER % of Printed Bars(aka...more trades occurring for that asset on the exchange),
the LARGER the Name Label will print, potentially showing you the better opportunities on the exchange to avoid
exchange manipulation liquidations.
*** SHOULD NOT be used as size of labels that are your asset Name Labels next to each asset's Line Plot...
if your CCOMET Scanner includes these as you want these to be the same size for every asset so the larger ones dont cover the
smaller ones if the plots are all close to each other ***
Parameters:
_barCnt (float) : (float)
Get the 1st variable('barCnt') from the Security function's tuple and input it as this functions 1st input
parameter which will directly affect the size of the 2nd output variable ('alertTrigLabel') that is also outputted by this function.
_close (float) : (float)
Put your 'close' variable named '_close' from the security function here.
_securityTickerid (string) : (string)
Throughout the entire charts updates, if a '_close' value is never registered then the logic counts the asset as INVALID.
This will be the 1st TickerID variable (named _securityTickerid) outputted from the tuple of the TickeridForLabels()
function above this one.
_invalidArray (array) : (array string)
Input the array from the original script that houses all of the invalidArray strings.
_tablePosition (simple string) : (string)
Optional (if parameter not included, it defaults to position.middle_right). Location on the chart you want the table printed.
Possible strings include: position.top_center, position.top_left, position.top_right, position.middle_center,
position.middle_left, position.middle_right, position.bottom_center, position.bottom_left, position.bottom_right.
_stackVertical (simple bool) : (bool)
Optional (if parameter not included, it defaults to true). All of the assets that are counted as INVALID will be
created in a list. If you want this list to be prited as a column then input 'true' here, otherwise they will all be in a row.
_lblSzRfrnce (string) : (string)
Optional (if parameter not included, it defaults to size.small). This will be the size of the variable outputted
by this function named 'assetNameLabel' BUT also affects the size of the output variable 'alertTrigLabel' as it uses this parameter's size
as the smallest size for 'alertTrigLabel' then uses the '_barCnt' parameter to determine the next sizes up depending on the "_barCnt" value.
Returns: ( )
Returns 2 variables:
1st output variable ('AssetNameLabel') is assigned to the size of the 'lblSzRfrnceInput' parameter.
2nd output variable('alertTrigLabel') can be of variying sizes depending on the 'barCnt' parameter...BUT the smallest
size possible for the 2nd output variable ('alertTrigLabel') will be the size set in the 'lblSzRfrnceInput' parameter.
PrintedBarCount(_time, _barCntLength, _barCntPercentMin)
The Printed BarCount Filter looks back a User Defined amount of minutes and calculates the % of bars that have printed
out of the TOTAL amount of bars that COULD HAVE been printed within the same amount of time.
Parameters:
_time (int) : (int)
The time associated with the chart of the particular asset that is being screened at that point.
_barCntLength (int) : (int)
The amount of time (IN MINUTES) that you want the logic to look back at to calculate the % of bars that have actually
printed in the span of time you input into this parameter.
_barCntPercentMin (int) : (int)
The minimum % of Printed Bars of the asset being screened has to be GREATER than the value set in this parameter
for the output variable 'bc_gtg' to be true.
Returns: ( )
Returns 2 outputs:
1st is the % of Printed Bars that have printed within the within the span of time you input in the '_barCntLength' parameter.
2nd is true/false according to if the Printed BarCount % is above the threshold that you input into the '_barCntPercentMin' parameter.

Breadth-Driven Swing StrategyWhat it does
This script trades the S&P 500 purely on market breadth extremes:
• Data source : INDEX:S5TH = % of S&P 500 stocks above their own 200-day SMA (range 0–100).
• Buy when breadth is washed-out.
• Sell when breadth is overheated.
It is long-only by design; shorting and ATR trailing stops have been removed to keep the logic minimal and transparent.
⸻
Signals in plain English
1. Long entry
A. A 200-EMA trough in breadth is printed and the trough value is ≤ 40 %.
or
B. A 5-EMA trough appears, its prominence passes the user threshold, and the lowest breadth reading in the last 20 bars is ≤ 20 %.
(Toggle this secondary trigger on/off with “ Enter also on 5-EMA trough ”.)
2. Exit (close long)
First 200-EMA peak whose breadth value is ≥ 70 %.
3. Risk control
A fixed stop-loss (% of entry price, default 8 %) is attached to every long trade.
⸻
Key parameters (defaults shown)
• Long EMA length 200 • Short EMA length 5
• Peak prominence 0.5 pct-pts • Trough prominence 3 pct-pts
• Peak level 70 % • Trough level 40 % • 5-EMA trough level 20 %
• Fixed stop-loss 8 %
• “Enter also on 5-EMA trough” = true (allows additional entries on extreme momentum reversals)
Feel free to tighten or relax any of these thresholds to match your risk profile or account for different market regimes.
⸻
How to use it
1. Load the script on a daily SPX / SPY chart.
(The price chart drives order execution; the breadth series is pulled internally and does not need to be on the chart.)
2. Verify the breadth feed.
INDEX:S5TH is updated after each session; your broker must provide it.
3. Back-test across several cycles.
Two decades of daily data is recommended to see how the rules behave in bear markets, range markets, and bull trends.
4. Adjust position sizing in the Properties tab.
The default is “100 % of equity”; change it if you prefer smaller allocations or pyramiding caps.
⸻
Why it can help
• Breadth signals often lead price, allowing entries before index-level momentum turns.
• Simple, rule-based exits prevent “waiting for confirmation” paralysis.
• Only one input series—easy to audit, no black-box math.
Trade-offs
• Relies on a single breadth metric; other internals (advance/decline, equal-weight returns, etc.) are ignored.
• May sit in cash during shallow pullbacks that never push breadth ≤ 40 %.
• Signals arrive at the end of the session (breadth is EoD data).
⸻
Disclaimer
This script is provided for educational purposes only and is not financial advice. Markets are risky; test thoroughly and use your own judgment before trading real money.
ストラテジー概要
本スクリプトは S&P500 のマーケットブレッド(内部需給) だけを手がかりに、指数をスイングトレードします。
• ブレッドデータ : INDEX:S5TH
(S&P500 採用銘柄のうち、それぞれの 200 日移動平均線を上回っている銘柄比率。0–100 %)
• 買い : ブレッドが極端に売られたタイミング。
• 売り : ブレッドが過熱状態に達したタイミング。
余計な機能を削り、ロングオンリー & 固定ストップ のシンプル設計にしています。
⸻
シグナルの流れ
1. ロングエントリー
• 条件 A : 200-EMA がトラフを付け、その値が 40 % 以下
• 条件 B : 5-EMA がトラフを付け、
・プロミネンス条件を満たし
・直近 20 本のブレッドス最小値が 20 % 以下
• B 条件は「5-EMA トラフでもエントリー」を ON にすると有効
2. ロング決済
最初に出現した 200-EMA ピーク で、かつ値が 70 % 以上 のバーで手仕舞い。
3. リスク管理
各トレードに 固定ストップ(初期価格から 8 %)を設定。
⸻
主なパラメータ(デフォルト値)
• 長期 EMA 長さ : 200 • 短期 EMA 長さ : 5
• ピーク判定プロミネンス : 0.5 %pt • トラフ判定プロミネンス : 3 %pt
• ピーク水準 : 70 % • トラフ水準 : 40 % • 5-EMA トラフ水準 : 20 %
• 固定ストップ : 8 %
• 「5-EMA トラフでもエントリー」 : ON
相場環境やリスク許容度に合わせて閾値を調整してください。
⸻
使い方
1. 日足の SPX / SPY チャート にスクリプトを適用。
2. ブレッドデータの供給 (INDEX:S5TH) がブローカーで利用可能か確認。
3. 20 年以上の期間でバックテスト し、強気相場・弱気相場・レンジ局面での挙動を確認。
4. 資金配分 は プロパティ → 戦略実行 で調整可能(初期値は「資金の 100 %」)。
⸻
強み
• ブレッドは 価格より先行 することが多く、天底を早期に捉えやすい。
• ルールベースの出口で「もう少し待とう」と迷わずに済む。
• 入力 series は 1 本のみ、ブラックボックス要素なし。
注意点・弱み
• 単一指標に依存。他の内部需給(A/D ライン等)は考慮しない。
• 40 % を割らない浅い押し目では機会損失が起こる。
• ブレッドは終値ベースの更新。ザラ場中の変化は捉えられない。
⸻
免責事項
本スクリプトは 学習目的 で提供しています。投資助言ではありません。
実取引の前に必ず自己責任で十分な検証とリスク管理を行ってください。

EMA Crossover with RSI and DistanceEMA Crossover with RSI and Distance Strategy
This strategy combines Exponential Moving Averages (EMA) with Relative Strength Index (RSI) and distance-based conditions to generate buy, sell, and neutral signals. It is designed to help traders identify entry and exit points based on multiple technical indicators.
Key Components:
Exponential Moving Averages (EMA):
The strategy uses four EMAs: EMA 5, EMA 13, EMA 40, and EMA 55.
A buy signal (long) is triggered when EMA 5 crosses above EMA 13 and EMA 40 crosses above EMA 55.
A sell signal (short) is generated when EMA 55 crosses above EMA 40.
The distance between EMAs (5 and 13) is also important. If the current distance between EMA 5 and EMA 13 is smaller than the average distance over the last 5 candles, a neutral condition is triggered, preventing a signal even if all other conditions are met.
Relative Strength Index (RSI):
The 14-period RSI is used to determine market strength and direction.
The strategy requires RSI to be above 50 and greater than the average RSI (over the past 14 periods) for a buy signal.
If the RSI is above 60, a green signal is given, indicating a strong bullish condition, even if the EMA conditions are not fully met.
If the RSI is below 40, a red signal is given, indicating a strong bearish condition, regardless of the EMA crossover.
Distance Conditions:
The strategy calculates the distance between EMA 5 and EMA 13 on each candle and compares it to the average distance of the last 5 candles.
If the current distance between EMA 5 and EMA 13 is lower than the average of the last 5 candles, a neutral signal is triggered. This helps avoid entering a trade when the market is losing momentum.
Additionally, if the distance between EMA 40 and EMA 13 is greater than the previous distance, the previous signal is kept intact, ensuring that the trend is still strong enough for the signal to remain valid.
Signal Persistence:
Once a buy (green) or sell (red) signal is triggered, it remains intact as long as the price is closing above EMA 5 for long trades or below EMA 55 for short trades.
If the price moves below EMA 5 for long trades or above EMA 55 for short trades, the signal is recalculated based on the most recent conditions.
Signal Display:
Green Signals: Represent a strong buy signal and are shown below the candle when the RSI is above 60.
Red Signals: Represent a strong sell signal and are shown above the candle when the RSI is below 40.
Neutral Signals: Displayed when the conditions for entry are not met, specifically when the EMA distance condition is violated.
Long and Short Signals: Additional signals are shown based on the EMA crossovers and RSI conditions. These signals are plotted below the candle for long positions and above the candle for short positions.
Trade Logic:
Long Entry: Enter a long trade when EMA 5 crosses above EMA 13, EMA 40 crosses above EMA 55, and the RSI is above 50 and greater than the average RSI. Additionally, the current distance between EMA 5 and EMA 13 should be larger than the average distance of the last 5 candles.
Short Entry: Enter a short trade when EMA 55 crosses above EMA 40 and the RSI is below 40.
Neutral Condition: If the distance between EMA 5 and EMA 13 is smaller than the average distance over the last 5 candles, the strategy will not trigger a signal, even if other conditions are met.
