Multiple MAs Signals with RSI MA Filter & Signal About the Script
The "Multiple Moving Averages Signals with RSI MA Filter and Golden Signals" script is a comprehensive trading tool designed to provide traders with detailed insights and actionable signals based on multiple moving averages and RSI (Relative Strength Index). This script combines traditional moving average crossovers with RSI filtering to enhance the accuracy of trading signals and includes "golden" signals to highlight significant long-term trend changes.
This script integrates several technical indicators and concepts to create a robust and versatile trading tool. Here's why this combination is both original and useful:
1. Multiple Moving Averages:
- Why Use Multiple MAs: Different types of moving averages (SMA, EMA, SMMA, WMA, VWMA, Hull) offer unique perspectives on price trends and volatility. Combining them allows traders to capture a more comprehensive view of the market.
- Purpose: Using multiple moving averages helps identify trend direction, support/resistance levels, and potential reversal points.
2. RSI MA Filter:
- Why Use RSI: RSI is a momentum oscillator that measures the speed and change of price movements. It is used to identify overbought or oversold conditions in a market.
- Purpose: Filtering signals with RSI moving averages ensures that trades are taken in line with the prevailing momentum, reducing the likelihood of false signals.
3. Golden Signals:
- Why Use Golden Crosses: A golden cross (50-period MA crossing above the 200-period MA) is a well-known bullish signal, while a death cross (50-period MA crossing below the 200-period MA) is bearish. These signals are widely followed by traders and institutions.
- Purpose: Highlighting these significant long-term signals helps traders identify major buy or sell opportunities and align with broader market trends.
How the Script Works
1. Moving Average Calculations:
- The script calculates multiple moving averages (MA1 to MA5) based on user-selected types (SMA, EMA, SMMA, WMA, VWMA, Hull) and periods (9, 21, 50, 100, 200).
- Golden Moving Averages: Separately calculates 50-period and 200-period moving averages for generating golden signals.
2. RSI and RSI MA Filter:
- RSI Calculation: Computes the RSI for the given period.
- RSI MA: Calculates a moving average of the RSI to smooth out the RSI values and reduce noise.
- RSI MA Filter: Traders can enable/disable RSI filtering and set custom thresholds to refine long and short signals based on RSI momentum.
3. Long & Short Signal Generation:
- Long Signal: Generated when the short-term moving average crosses above both the mid-term and long-term moving averages, and the RSI MA is below the specified threshold (if enabled).
- Short Signal: Generated when the short-term moving average crosses below both the mid-term and long-term moving averages, and the RSI MA is above the specified threshold (if enabled).
4. Golden Signals:
- Golden Long Signal: Triggered when the 50-period golden moving average crosses above the 200-period golden moving average.
- Golden Short Signal: Triggered when the 50-period golden moving average crosses below the 200-period golden moving average.
How to Use the Script
1. Customize Inputs:
- Moving Averages: Choose the type of moving averages and set the periods for up to five different moving averages.
- RSI Settings: Adjust the RSI period and its moving average period. Enable or disable RSI filtering and set custom thresholds for long and short signals.
- Signal Colors: Customize the colors for long, short, and golden signals.
- Enable/Disable Signals: Toggle the visibility of long, short, and golden signals.
2. Observe Plots and Signals:
- The script plots the selected moving averages on the chart.
- Long and short signals are marked with labels on the chart, with customizable colors for easy identification.
- Golden signals are highlighted with specific labels to indicate significant long-term trend changes.
3. Analyze and Trade:
- Use the generated signals as part of your trading strategy. The script provides visual cues to help you make informed decisions about entering or exiting trades based on multiple technical indicators.
Unique Features
1. Integration of Multiple Moving Averages: Combines various moving average types to provide a holistic view of market trends.
2. RSI MA Filtering: Enhances signal accuracy by incorporating RSI momentum, reducing the likelihood of false signals.
3. Golden Signals: Highlights significant long-term trend changes, aligning with broader market movements.
4. Customizability: Offers extensive customization options, allowing traders to tailor the script to their specific trading strategies and preferences.
feel free to comments.
Recherche dans les scripts pour "情绪指数板块+约200只股票+选股规则"

Daniels Script v2 EMA 4h y DTitle:
"EMA 200 Dynamic Projection on 4H and Daily Charts"
Description:
"This script is designed to provide traders with a comprehensive view of market trends by displaying the 200-period Exponential Moving Average (EMA) on both 4-hour and daily charts simultaneously. Unlike typical EMA representations, this script enhances user decision-making by projecting the potential future path of these EMAs using a dynamic slope calculation.
The dynamic projection feature calculates the slope based on recent changes in the EMA, allowing traders to visualize potential future trends more accurately. This innovative approach helps in identifying potential areas of support and resistance before they are fully formed, offering traders a strategic advantage in planning their entries and exits.
Key Features:
Dual Time Frame Analysis: View 200-period EMAs for both 4-hour and daily charts on a single graph.
Dynamic EMA Projections: Projected using a calculated slope from recent EMA changes, presented as dotted lines for clear distinction.
Enhanced Trend Visualization: Helps in recognizing trend continuations or reversals early, aiding in risk management and decision-making processes.
Usage:
Simply add the script to your chart, and the EMAs along with their projections will automatically be displayed. The 4-hour EMA is shown in green, while the daily EMA is in red. Projections extend from the last known data point, providing a visual guide to potential future movements.
This script is unique in its approach to combining real-time EMA analysis with predictive modeling, making it a valuable tool for traders looking to enhance their technical analysis capabilities."
## SPANISH
Título del Script:
"Proyección Dinámica de la EMA 200 en Gráficos de 4H y Diarios"
Descripción del Script:
"Este script está diseñado para proporcionar a los traders una visión integral de las tendencias del mercado al mostrar la Media Móvil Exponencial (EMA) de 200 periodos tanto en los gráficos de 4 horas como diarios simultáneamente. A diferencia de las representaciones típicas de la EMA, este script mejora la toma de decisiones del usuario al proyectar el posible camino futuro de estas EMAs utilizando un cálculo de pendiente dinámico.
La función de proyección dinámica calcula la pendiente basada en cambios recientes en la EMA, permitiendo a los traders visualizar tendencias futuras potenciales con mayor precisión. Este enfoque innovador ayuda a identificar áreas potenciales de soporte y resistencia antes de que se formen completamente, ofreciendo a los traders una ventaja estratégica en la planificación de sus entradas y salidas.
Características Clave:
Análisis de Doble Marco Temporal: Visualiza las EMAs de 200 periodos para los gráficos de 4 horas y diarios en un solo gráfico.
Proyecciones Dinámicas de la EMA: Proyectadas utilizando una pendiente calculada a partir de cambios recientes en la EMA, presentadas como líneas punteadas para una clara distinción.
Visualización Mejorada de Tendencias: Ayuda en el reconocimiento temprano de continuaciones o reversos de tendencias, asistiendo en la gestión de riesgos y en los procesos de toma de decisiones.
Uso:
Simplemente añade el script a tu gráfico, y las EMAs junto con sus proyecciones se mostrarán automáticamente. La EMA de 4 horas se muestra en verde, mientras que la EMA diaria está en rojo. Las proyecciones se extienden desde el último punto de datos conocido, proporcionando una guía visual hacia movimientos futuros potenciales.
Este script es único en su enfoque de combinar análisis de EMA en tiempo real con modelado predictivo, convirtiéndolo en una herramienta valiosa para traders que buscan mejorar sus capacidades de análisis técnico."

Market Smith IndicatorsMarket Smith has a collection of tools that are useful for identifying stocks. On their charts they have a 21/50/200 day moving averages, high and low pivot points, a relative strength line, and a relative strength rating. This script contains indicators for the following:
21/50/200 Day Moving Averages
High and Low pivot points
A Relative Strength line
A Relative Strength rating
21/50/200 Day Moving Averages
The 21/50/200 Day moving averages are simple moving averages. They are visible in any chart increment but to use them properly you need to set you charts to be by day. Labels will appear on the right of the lines to show that they are representative of 21/50/200 day moving averages.
High and Low pivot points
The High and Low pivot points are green for high pivot points and red for low points. They are show in the Market Smith style with the numbers simply above the pivot points.
Relative Strength line
The Relative Strength line is a line that shows the strength of the stock compared to the S&P 500. In this case we utilize the SPX ticker to compare the stock to. This line is almost identical to the Market Smith tool and is an excellent tool to determine how a stock is doing compared to the market. When movements in the stock and shown with sideways trending of the RS line that means that the stock is following the market. When a stock is outperforming the market the RS line will follow.
Relative Strength rating
Thank you to ©Fred6724 for the RS Rating inspiration. They wrote excellent open source code for a RS Rating comparable to Market Smith. As the RS Rating in Market Smith is not open source it is difficult to know exactly how it is being calculated. After simplifying Fred's code and building upon a few ideas I had I compared the RS Rating to multiple Market Smith Ratings. The rating is close but often off by multiple points. If there is anyone who has a better idea on how to get this rating or how to improve on the code please send me a PM or fork this project. This rating is a good indicator to see how a certain stock compares to other stocks in the market. In Market Smith they are able to utilize their database to compare it to all other stocks. Since we do not have access to the same tools we are only able to compare it to the percentage of stocks above the 200, 150, 100, 50, and 20 day moving average.
Using these tools together are a small fraction what make people like Bill O'neill and Jim Roppel so successful. I plan on updating the RS Rating as I continue to work on this project so if there is anyone who has ideas then please send me a PM. Ultimately the goal of this project is to have a solution that is identical to Market Smith.

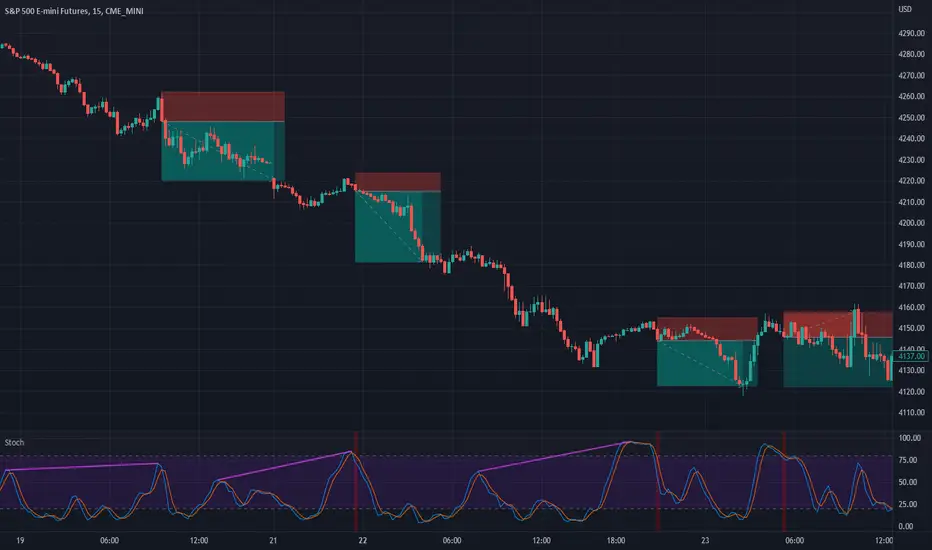
Stochastic with DivergencesReuploading as there was an issue with the description.
This indicator uses the popular Stochastic indicator as its base. I have included the ability to draw divergences on the indicator as they occur live. By default it will be off, select the settings for the indicator and about halfway down there will be a dropdown menu that says "Off". Select it and then select which divergences you want to draw: Regular, Hidden, or Both. I like to draw both. I find that hidden divergence is really nice during a trending market and the regular divergence is works great in a range market. I also feel that the regular divergence is great during a trending market if you are given the signal but then wait for the next price movement for a double top/bottom to occur. The Stochastic indicator itself is often used in a ranging market by selling when it is overbought and buying once it indicates oversold (much like the RSI indicator). I find that it can work in trending markets if you only take overbought in a down trend and oversold in an up trend. In the above picture you can see that I had used it to trade this downtrend using both the Hidden Divergence and Sell Signals to catch the trend continuation until it failed on the fourth trade. From here I would usually start using the Stochastic as simply an oscillating indicator and buy/sell based on overbought/oversold. I've also added an option to enable the Stochastic RSI if you'd rather use that, as well as a fill option which simply colors in the space between the Stochastic and Signal lines. The Signals option will put on highlights of when to buy or sell based on overbought/oversold areas that agree with the long term trend (based on the 200 EMA).
Divergence is a short way of saying there was a higher or lower movement compared to normal but the price did not represent that movement, indicating strength or weakness in a specific direction.
Regular divergence is an indication of a trend reversal. Regular bullish divergence occurs when the price chart shows a lower low while the stochastic shows a higher low. Regular bearish divergence occurs when the price chart shows a higher high while the stochastic shows a lower high.
Hidden divergence is an indication of a trend continuation. Hidden bullish divergence occurs when the price chart shows a higher low while the stochastic shows a lower low. Hidden bearish divergence occurs when the price chart shows a lower high while the stochastic shows a higher high.
The "Only Trending Divergences" option, if enabled, will only show bearish divergences during a down trend (price is below 200 EMA) and only show bullish divergences during an uptrend (price is above 200 EMA). I like to use this option and have set it to ON by default.
The "Middle Filter" option, if enabled, ensures that Highs on the stochastic indicator will not be counted as Highs unless they are above the middle value of the oscillator (which is 50), same goes for lows: they will not be counted as Lows unless they are below the middle value of the oscillator.
I also include buy/sell signals that coincide with the trend (based on the 200 EMA). If price is currently below the 200 EMA and the stochastic indicator is overbought (over 80), you can get a sell signal when it the blue line crosses down below 80. This sell signal shows that you are in a down trend and the price just was overbought but is now likely to continue pushing downwards. The opposite works for buy signals: Above 200 EMA, stochastic goes below 20, when it crosses above 20 it will show a green highlight to indicate price is likely to push upwards.
I think the default options are likely the best to use. The only one I tend to change on occasion is the "Pivots to look back" which I adjust usually to either 1 or 3.
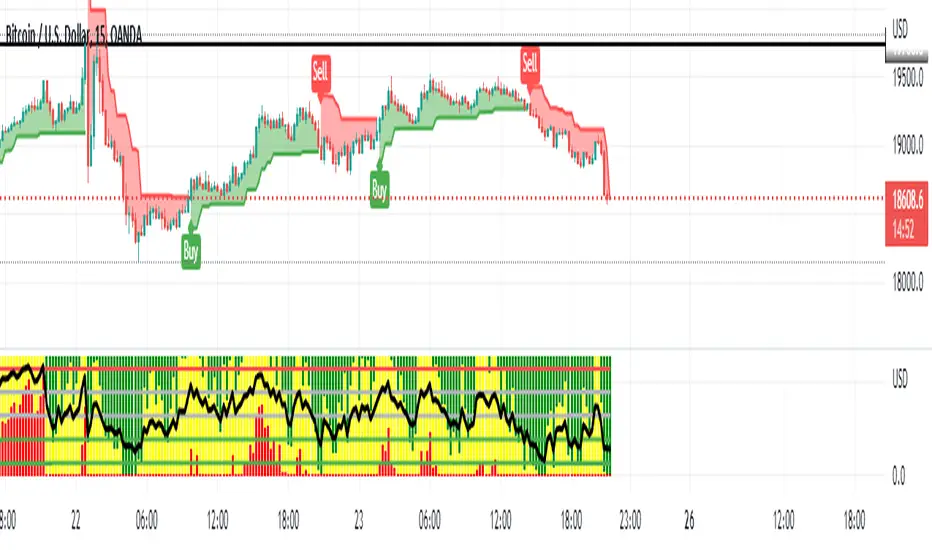
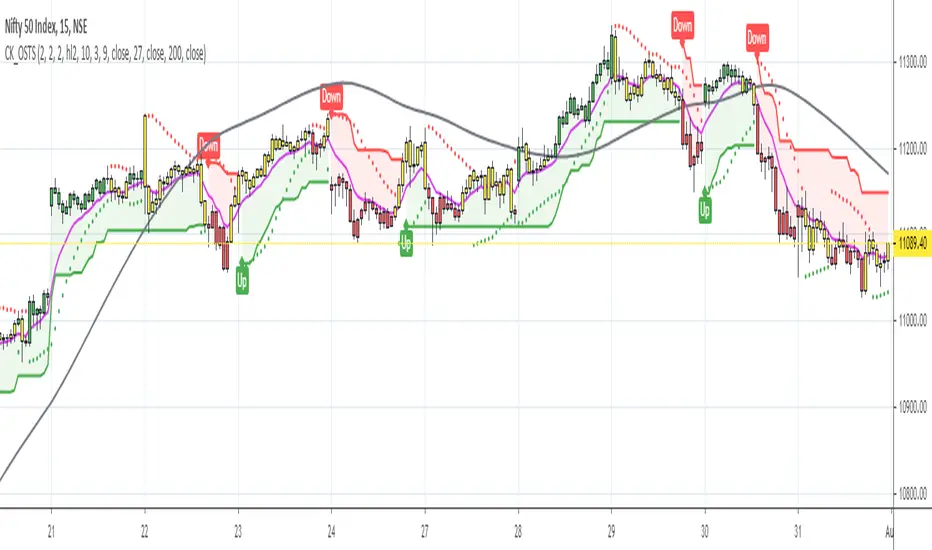
Seth_Signal
This script designed to identify up, down, and sideways trends. 200 HMA , 9 EMA , PSAR, and ATR are used to identify the strength of any instrument.
Candle Colors - Simpler approach to follow:
Green color indicates for up side trade signals
Red color indicates for down side trade signals
Yellow color can be interpreted for stop, sideways, and counter trade trade signals
Multiple Trade Setups:
Green Zone - Trading green candles within green zone has better odds of long trades
Red Zone - Trading red candles within red zone has better odds of short trades
200 HMA - Candles above 200 HMA mostly for long trades. Candles below 200 HMA usually for short trades. But the zone also very important to consider
9 EMA - Cross over above 200 HMA in Green zone, look for long trades. Cross over below 200 HMA in red zone, look for short trades
PSAR - This can be used as potential initial warning sign. Also can be used to exit partial or wait for it goes to opposite side for taking trade decisions
Candle Above all - If Green candle and above all the indicators, then very good sign of long side. If red candle and below all indicators, then very good sign of short side.
Multiple Time Frame:
This works very well with any instrument and on any time frame. Always its better to do analysis on multi time frame before entry, exit, and trade execution. Back test it with this setup and also observe it on live market. That will give edge in taking trade decisions. All the best and happy trading.
Bogdan Ciocoiu - Pager► Description
This script creates the possibility for users to set up alerts on different timeframes when close prices crossover or cross under certain essential exponential moving averages such as 20, 50 or 200. The script shows the fundamental levels where one can set notifications.
The current levels are:
15min timeframe: when Close < EMA 200
15min timeframe: when close > EMA 200
5min timeframe: when close < EMA 200
5min timeframe: when close > EMA 200
60min timeframe: when close < EMA 200
60min timeframe: when close > EMA 200
► Originality and usefulness
This tool is helpful because it enables users to use the notification system when specific trends form without actively monitoring price action.
► Open-source reuse
The script only leverages TradingView native functionality.

EBB & Flow: a multi-EMA-based BB cloudIntro
This is an idea evolved out of the market maker method and EMA convergence, divergence, and mean reversion.
The market maker method informs us that the 5, 13, 50 and 200 EMAs are important to regulating price. Those EMA lengths are multiples of the 50 and 200 on lower major timeframes -- the 1 minute, 5, 15, 1H, 4H, 1D. I include the 21 because it is also a multiple and in crypto very often respected.
When market makers are testing price, they set their range and spike in the direction they test for liquidity. This can get chaotic. For instance, in a shorter time frame consolidation inside a bigger timeframe uptrend, it can be too easy to forget where you are in the many trends playing out.
When the EMAs are dragged over each other during normal price movement, you get these crisscrossing tracks of price, and the individual breaks can be hard to trace.
The range is what matters, ultimately, and the range is dynamic. In that case, the Bollinger Band is a great tool for detecting outliers in this case.
The Answer
So the answer this indicator seeks to give, is to look for outliers. This gives you a scalping strategy built on Traders Reality thinking and best put together with the PVSRA indicator, which I may include in this indicator just for the sake of concision, but they can work alongside each other or separately.
The key thing is the different EMA clouds, which are bollinger bands. Tight bands mean imminent breaks, favouring the trend. Vector candles out of a zone, pins to the low/high, etc. are all very relevant alongside this indicator.
You can also use it on its own and scalp the breaks of a cloud.
How it works
Each cloud is a standard deviation from their respective EMA, all in the same colour. The deviation multiple is 1.618 by default. Yes, fibonacci sequences are usually nonsense, but it works better with the BB than 2, 2.5 or 3.
Using just the clouds, you can see where each EMA is headed and how it behaves within the deviation of the others.
But that on its own isn't enough.
The indicator will also print snowflakes above and below the candle for notable outliers. It will be in the colour of the cloud it breaks, but only if that break is also breaking the smaller EMA clouds too.
The most snowflakes will be yellow because that's the 13 EMA. That one is dependent on nothing else and every break will print a snowflake. The 21 will be dependent on the 13. The 50 dependent on the 13 and 21 breaks. The 200 the most important.
For example, if the 200 EMA-BB or EBB is broken at the upper band, deviating by more than 162% of price over a 200 period EMA, and that break is not above the 50 EMA cloud, there will be no snowflake. However, if it exceeds the 13, 21, 50, and 200 clouds, then a purple snowflake will appear above the bar.
Any snowflake is an extreme in price. The purple is an especially good point of entry. That doesn't mean it is a perfect entry. You can build position from it, though, and be relatively certain of a price correction in the near future, because not only was this major EMA cloud violated, but all of the smaller ones too.
Reminder
You still need your PVSRA and candlesticks. This indicator on its own may have a nice hit rate for scalping and building position, as an alternative to the TDI or alongside it, but it is not enough on its own, just like the TDI.
Enjoy!

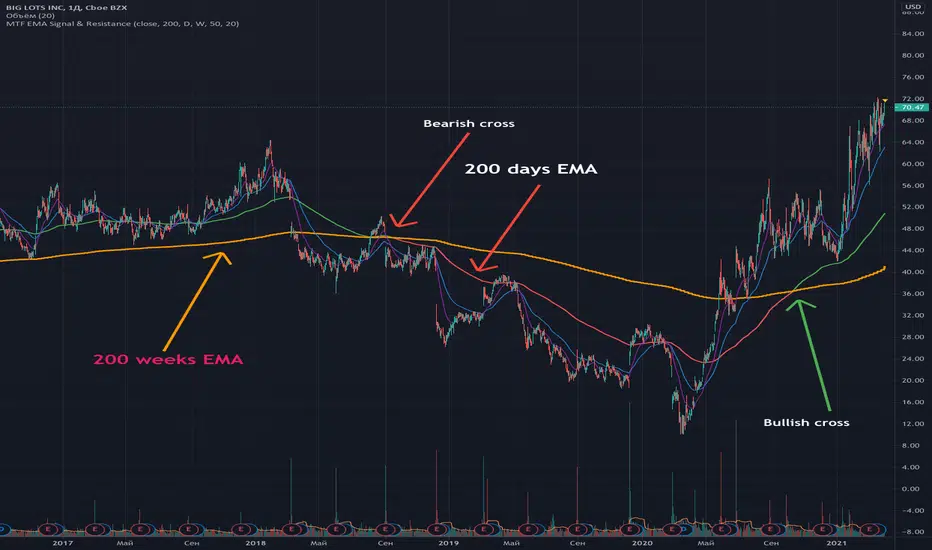
Multi Time Frame EMA Signal & ResistanceFull code and description: github.com/samgozman/MTF-EMA-Signal-and-Resistance
The idea of this script is quite simple. Imagine that you have a 200-day EMA and its support or resistance line is the 200-week EMA.
Then if EMA 200 1D > EMA 200 1W then the trend is bullish.
That is, EMA 200 1D is the signal line, and EMA 200 1W is the resistance.
Of course, you can independently set the time interval for the signal line and resistance, as well as the number of periods.
In addition to setting time intervals and period lengths, you can optionally enable the display of additional class EMAs.
You can also set the timeframe for the signal line equal to the current time period.
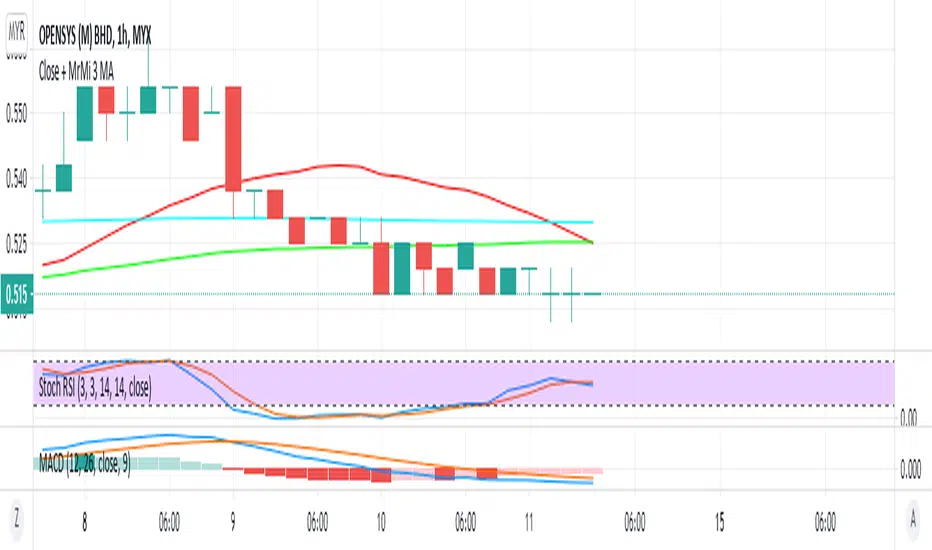
MrMi 3 in 1 MAThis 3 in 1 moving average script can help all of you to save your indicator use especially for free user. this script icluded 20 MA, 50 MA, and 200 MA which is important to all trader. I hope this script can assist all of you to maximize the important indicators in your trading plan.
Skrip purata bergerak 3 dalam 1 ini dapat membantu anda semua untuk menjimatkan penggunaan penunjuk anda terutama untuk pengguna percuma. skrip ini merangkumi 20 MA, 50 MA, dan 200 MA yang penting bagi semua peniaga. Saya harap skrip ini dapat membantu anda semua untuk memaksimumkan petunjuk penting dalam rancangan perdagangan anda.
يمكن أن يساعدك هذا البرنامج النصي 3 في 1 في المتوسط المتحرك جميعًا على حفظ استخدام المؤشر الخاص بك بشكل خاص للمستخدم المجاني. يتضمن هذا البرنامج النصي 20 MA و 50 MA و 200 MA وهو أمر مهم لجميع المتداولين. آمل أن يساعدك هذا البرنامج النصي جميعًا على تعظيم المؤشرات المهمة في خطة التداول الخاصة بك.
这种三合一移动平均值脚本可以帮助所有人节省指标使用量,尤其是对于免费用户而言。该脚本包括20 MA,50 MA和200 MA,这对所有交易者都很重要。我希望该脚本可以帮助大家最大化您的交易计划中的重要指标。
यह 3 इन 1 मूविंग एवरेज स्क्रिप्ट विशेष रूप से मुफ्त उपयोगकर्ता के लिए आपके संकेतक उपयोग को बचाने में आप सभी की मदद कर सकती है। इस स्क्रिप्ट में 20 एमए, 50 एमए और 200 एमए शामिल हैं जो सभी व्यापारी के लिए महत्वपूर्ण है। मुझे उम्मीद है कि यह स्क्रिप्ट आपकी ट्रेडिंग योजना में महत्वपूर्ण संकेतकों को अधिकतम करने के लिए आप सभी की सहायता कर सकती है।
이 3 in 1 이동 평균 스크립트는 특히 무료 사용자를 위해 지표 사용을 절약하는 데 도움이 될 수 있습니다. 이 스크립트에는 모든 상인에게 중요한 20 MA, 50 MA 및 200 MA가 포함되었습니다. 이 스크립트가 거래 계획의 중요한 지표를 극대화하는 데 도움이되기를 바랍니다.
この3in 1移動平均スクリプトは、特に無料ユーザーの場合、インジケーターの使用を節約するのに役立ちます。このスクリプトには、すべてのトレーダーにとって重要な20 MA、50 MA、および200MAが含まれていました。このスクリプトが、取引計画の重要な指標を最大化するのに役立つことを願っています。
One-Stop Trading SetupOne-Stop Trading Setup:
This script designed to identify up, down, and sideways trends. 200 HMA, 9 EMA, PSAR, and ATR are used to identify the strength of any instrument.
Candle Colors - Simpler approach to follow:
Green color indicates for up side trade signals
Red color indicates for down side trade signals
Yellow color can be interpreted for stop, sideways, and counter trade trade signals
Multiple Trade Setups:
Green Zone - Trading green candles within green zone has better odds of long trades
Red Zone - Trading red candles within red zone has better odds of short trades
200 HMA - Candles above 200 HMA mostly for long trades. Candles below 200 HMA usually for short trades. But the zone also very important to consider
9 EMA - Cross over above 200 HMA in Green zone, look for long trades. Cross over below 200 HMA in red zone, look for short trades
PSAR - This can be used as potential initial warning sign. Also can be used to exit partial or wait for it goes to opposite side for taking trade decisions
Candle Above all - If Green candle and above all the indicators, then very good sign of long side. If red candle and below all indicators, then very good sign of short side.
Multiple Time Frame:
This works very well with any instrument and on any time frame. Always its better to do analysis on multi time frame before entry, exit, and trade execution. Back test it with this setup and also observe it on live market. That will give edge in taking trade decisions. All the best and happy trading.
Disclaimer:
This script and setup is written with the sole purpose of identifying the strength of any instrument. Interpretation, trade decisions, and changing inputs are up to each individual users/trades.
MACD/EMA/SMA/Ichimoku Confluence StrategyThis strategy uses a number of chart indicators to provide a Bullish/Bearish signal. Using a combination of the 200 SMA, the 20 EMA, the MACD and the Ichimoku cloud, the strategy logic will adjust the amount of confluence required between the indicators depending on how bullish or bearish the chart is looking. The logic looks for the following:
- Are we above or below the 200 SMA?
- Are we above or below the 20 EMA?
- Have we had a bullish MACD cross?
- Where are we in relation to the Ichimoku cloud?
If the coin is below the 200 SMA, then the strategy will only give a buy signal if the coin closes a candle above the 20 EMA AND the MACD is bullish and either the Ichimoku cloud is green, or the coin is above the Ichimoku cloud (regardless of colour).
If the coin is above the 200 SMA, Then the strategy will give a buy signal if the coin closes a candle above the 20 EMA AND the MACD is bullish and the coin is either IN the cloud (not necessarily above it) or the cloud is green.
The reverse is true for a sell signal, i.e. when the coin is above the 200 SMA it must close a candle below the Ichimoku cloud and be bearish in relation to the 20 EMA and MACD. If it is below the 200 SMA, then the strategy will give a sell signal if the the EMA/MACD conditions are true and the coin enters the cloud.
This strategy gives a fairly conservative signal for entry and exit points, but is fairly successful across a number of time frames, both short term and long term. As with all my strategies, I only include LONG entries and closes, not SHORT entries (as I find they make for inaccurate backtesting).
Please feel free to like, share, critique and suggest any improvements to this strategy. All feedback, positive and negative, is appreciated.

Multi SMA EMA WMA HMA BB (5x8 MAs Bollinger Bands) MAX MTF - RRBMulti SMA EMA WMA HMA 4x7 Moving Averages with Bollinger Bands MAX MTF by RagingRocketBull 2019
Version 1.0
All available MAX MTF versions are listed below (They are very similar and I don't want to publish them as separate indicators):
ver 1.0: 4x7 = 28 MTF MAs + 28 Levels + 3 BB = 59 < 64
ver 2.0: 5x6 = 30 MTF MAs + 30 Levels + 3 BB = 63 < 64
ver 3.0: 3x10 = 30 MTF MAs + 30 Levels + 3 BB = 63 < 64
ver 4.0: 5(4+1)x8 = 8 CurTF MAs + 32 MTF MAs + 20 Levels + 3 BB = 63 < 64
ver 5.0: 6(5+1)x6 = 6 CurTF MAs + 30 MTF MAs + 24 Levels + 3 BB = 63 < 64
ver 6.0: 4(3+1)x10 = 10 CurTF MAs + 30 MTF MAs + 20 Levels + 3 BB = 63 < 64
Fib numbers: 8, 13, 21, 34, 55, 89, 144, 233, 377
This indicator shows multiple MAs of any type SMA EMA WMA HMA etc with BB and MTF support, can show MAs as dynamically moving levels.
There are 4 MA groups + 1 BB group, a total of 4 TFs * 7 MAs = 28 MAs. You can assign any type/timeframe combo to a group, for example:
- EMAs 9,12,26,50,100,200,400 x H1, H4, D1, W1 (4 TFs x 7 MAs x 1 type)
- EMAs 8,13,21,30,34,50,55,89,100,144,200,233,377,400 x M15, H1 (2 TFs x 14 MAs x 1 type)
- D1 EMAs and SMAs 8,13,21,30,34,50,55,89,100,144,200,233,377,400 (1 TF x 14 MAs x 2 types)
- H1 WMAs 13,21,34,55,89,144,233; H4 HMAs 9,12,26,50,100,200,400; D1 EMAs 12,26,89,144,169,233,377; W1 SMAs 9,12,26,50,100,200,400 (4 TFs x 7 MAs x 4 types)
- +1 extra MA type/timeframe for BB
There are several versions: Simple, MTF, Pro MTF, Advanced MTF, MAX MTF and Ultimate MTF. This is the MAX MTF version. The Differences are listed below. All versions have BB
- Simple: you have 2 groups of MAs that can be assigned any type (5+5)
- MTF: +2 custom Timeframes for each group (2x5 MTF) +1 TF for BB, TF XY smoothing
- Pro MTF: 4 custom Timeframes for each group (4x3 MTF), 1 TF for BB, MA levels and show max bars back options
- Advanced MTF: +4 extra MAs/group (4x7 MTF), custom Ticker/Symbols, Timeframe <>= filter, Remove Duplicates Option
- MAX MTF: +2 subtypes/group, packed to the limit with max possible MAs/TFs: 4x7, 5x6, 3x10, 4(3+1)x10, 5(4+1)x8, 6(5+1)x6
- Ultimate MTF: +individual settings for each MA, custom Ticker/Symbols
MAX MTF version tests the limits of Pinescript trying to squeeze as many MAs/TFs as possible into a single indicator.
It's basically a maxed out Advanced version with subtypes allowing for mixed types within a group (i.e. both emas and smas in a single group/TF)
Pinescript has the following limits:
- max 40 security calls (6 calls are reserved for dupe checks and smoothing, 2 are used for BB, so only 32 calls are available)
- max 64 plot outputs (BB uses 3 outputs, so only 61 plot outputs are available)
- max 50000 (50kb) size of the compiled code
Based on those limits, you can only have the following MAs/TFs combos in a single script:
1. 4x7, 5x6, 3x10 - total number of MTF MAs must always be <= 32, and you can still have BB and Num Levels = total MAs, without any compromises
2. 5(4+1)x8, 6(5+1)x6, 4(3+1)x10 - you can use the Current Symbol/Timeframe as an extra (+1) fixed TF with the same number of MTF MAs
- you don't need to call security to display MAs on the Current Symbol/Timeframe, so the total number of MTF MAs remains the same and is still <= 32
- to fit that many MAs into the max 64 plot outputs limit you need to reduce the number of levels (not every MA Group will have corresponding levels)
Features:
- 4x7 = 28 MAs of any type
- 4x MTF groups with XY step line smoothing
- +1 extra TF/type for BB MAs
- 2 MA subtypes within each group/TF
- 4x7 = 28 MA levels with adjustable group offsets, indents and shift
- supports any existing type of MA: SMA, EMA, WMA, Hull Moving Average (HMA)
- custom tickers/symbols for each group
- show max bars back option
- show/hide both groups of MAs/levels/BB and individual MAs
- timeframe filter: show only MAs/Levels with TFs <>= Current TF
- hide MAs/Levels with duplicate TFs
- support for custom TFs that are not available in free accounts: 2D, 3D etc
- support for timeframes in H: H, 2H, 4H etc
Notes:
- Uses timeframe textbox instead of input resolution dropdown to allow for 240 120 and other custom TFs
- Uses symbol textbox instead of input symbol to avoid establishing multiple dummy security connections to the current ticker - otherwise empty symbols will prevent script from running
- Possible reasons for missing MAs on a chart:
- there may not be enough bars in history to start plotting it. For example, W1 EMA200 needs at least 200 bars on a weekly chart.
- for charts with low/fractional prices i.e. 0.00002 << 0.001 (default Y smoothing step) decrease Y smoothing as needed (set Y = 0.0000001) or disable it completely (set X,Y to 0,0)
- for charts with high price values i.e. 20000 >> 0.001 increase Y smoothing as needed (set Y = 10-20). Higher values exceeding MAs point density will cause it to disappear as there will be no points to plot. Different TFs may require diff adjustments
- TradingView Replay Mode UI and Pinescript security calls are limited to TFs >= D (D,2D,W,MN...) for free accounts
- attempting to plot any TF < D1 in Replay Mode will only result in straight lines, but all TFs will work properly in history and real-time modes. This is not a bug.
- Max Bars Back (num_bars) is limited to 5000 for free accounts (10000 for paid), will show error when exceeded. To plot on all available history set to 0 (default)
- Slow load/redraw times. This indicator becomes slower, its UI less responsive when:
- Pinescript Node.js graphics library is too slow and inefficient at plotting bars/objects in a browser window. Code optimization doesn't help much - the graphics engine is the main reason for general slowness.
- the chart has a long history (10000+ bars) in a browser's cache (you have scrolled back a couple of screens in a max zoom mode).
- Reload the page/Load a fresh chart and then apply the indicator or
- Switch to another Timeframe (old TF history will still remain in cache and that TF will be slow)
- in max possible zoom mode around 4500 bars can fit on 1 screen - this also slows down responsiveness. Reset Zoom level
- initial load and redraw times after a param change in UI also depend on TF. For example: D1/W1 - 2 sec, H1/H4 - 5-6 sec, M30 - 10 sec, M15/M5 - 4 sec, M1 - 5 sec. M30 usually has the longest history (up to 16000 bars) and W1 - the shortest (1000 bars).
- when indicator uses more MAs (plots) and timeframes it will redraw slower. Seems that up to 5 Timeframes is acceptable, but 6+ Timeframes can become very slow.
- show_last=last_bars plot limit doesn't affect load/redraw times, so it was removed from MA plot
- Max Bars Back (num_bars) default/custom set UI value doesn't seem to affect load/redraw times
- In max zoom mode all dynamic levels disappear (they behave like text)
- Dupe check includes symbol: symbol, tf, both subtypes - all must match for a duplicate group
- For the dupe check to work correctly a custom symbol must always include an exchange prefix. BB is not checked for dupes
Good Luck! Feel free to learn from/reuse the code to build your own indicators.

Multi SMA EMA WMA HMA BB (4x5 MAs Bollinger Bands) Adv MTF - RRBMulti SMA EMA WMA HMA 4x5 Moving Averages with Bollinger Bands Advanced MTF by RagingRocketBull 2019
Version 1.0
This indicator shows multiple MAs of any type SMA EMA WMA HMA etc with BB and MTF support, can show MAs as dynamically moving levels.
There are 4 MA groups + 1 BB group, a total of 4 TFs * 5 MAs = 20 MAs. You can assign any type/timeframe combo to a group, for example:
- EMAs 12,26,50,100,200 x H1, H4, D1, W1 (4 TFs x 5 MAs x 1 type)
- EMAs 8,10,13,21,30,50,55,100,200,400 x M15, H1 (2 TFs x 10 MAs x 1 type)
- D1 EMAs and SMAs 8,10,12,26,30,50,55,100,200,400 (1 TF x 10 MAs x 2 types)
- H1 WMAs 7,77,89,167,231; H4 HMAs 12,26,50,100,200; D1 EMAs 89,144,169,233,377; W1 SMAs 12,26,50,100,200 (4 TFs x 5 MAs x 4 types)
- +1 extra MA type/timeframe for BB
There are several versions: Simple, MTF, Pro MTF, Advanced MTF and Ultimate MTF. This is the Advanced MTF version. The Differences are listed below. All versions have BB
- Simple: you have 2 groups of MAs that can be assigned any type (5+5)
- MTF: +2 custom Timeframes for each group (2x5 MTF) +1 TF for BB, TF XY smoothing
- Pro MTF: 4 custom Timeframes for each group (4x3 MTF), 1 TF for BB, MA levels and show max bars back options
- Advanced MTF: +2 extra MAs/group (4x5 MTF), custom Ticker/Symbols, Timeframe <>= filter, Remove Duplicates Option
- Ultimate MTF: +individual settings for each MA, custom Ticker/Symbols
Features:
- 4x5 = 20 MAs of any type
- 4x MTF groups with XY step line smoothing
- +1 extra TF/type for BB MAs
- 4x5 = 20 MA levels with adjustable group offsets, indents and shift
- supports any existing type of MA: SMA, EMA, WMA, Hull Moving Average (HMA)
- custom tickers/symbols for each group - you can compare MAs of the same symbol across exchanges
- show max bars back option
- show/hide both groups of MAs/levels/BB and individual MAs
- timeframe filter: show only MAs/Levels with TFs <>= Current TF
- hide MAs/Levels with duplicate TFs
- support for custom TFs that are not available in free accounts: 2D, 3D etc
- support for timeframes in H: H, 2H, 4H etc
Notes:
- Uses timeframe textbox instead of input resolution dropdown to allow for 240 120 and other custom TFs
- Uses symbol textbox instead of input symbol to avoid establishing multiple dummy security connections to the current ticker - otherwise empty symbols will prevent script from running
- Possible reasons for missing MAs on a chart:
- there may not be enough bars in history to start plotting it. For example, W1 EMA200 needs at least 200 bars on a weekly chart.
- price << default Y smoothing step 5. For charts with low/fractional prices (i.e. 0.00002 << 5) adjust X Y smoothing as needed (set Y = 0.0000001) or disable it completely (set X,Y to 0,0)
- TradingView Replay Mode UI and Pinescript security calls are limited to TFs >= D (D,2D,W,MN...) for free accounts
- attempting to plot any TF < D1 in Replay Mode will only result in straight lines, but all TFs will work properly in history and real-time modes. This is not a bug.
- Max Bars Back (num_bars) is limited to 5000 for free accounts (10000 for paid), will show error when exceeded. To plot on all available history set to 0 (default)
- Slow load/redraw times. This indicator becomes slower, its UI less responsive when:
- Pinescript Node.js graphics library is too slow and inefficient at plotting bars/objects in a browser window. Code optimization doesn't help much - the graphics engine is the main reason for general slowness.
- the chart has a long history (10000+ bars) in a browser's cache (you have scrolled back a couple of screens in a max zoom mode).
- Reload the page/Load a fresh chart and then apply the indicator or
- Switch to another Timeframe (old TF history will still remain in cache and that TF will be slow)
- in max possible zoom mode around 4500 bars can fit on 1 screen - this also slows down responsiveness. Reset Zoom level
- initial load and redraw times after a param change in UI also depend on TF. For example:
D1/W1 - 2 sec, H1/H4 - 5-6 sec, M30 - 10 sec, M15/M5 - 4 sec, M1 - 5 sec.
M30 usually has the longest history (up to 16000 bars) and W1 - the shortest (1000 bars).
- when indicator uses more MAs (plots) and timeframes it will redraw slower. Seems that up to 5 Timeframes is acceptable, but 6+ Timeframes can become very slow.
- show_last=last_bars plot limit doesn't affect load/redraw times, so it was removed from MA plot
- Max Bars Back (num_bars) default/custom set UI value doesn't seem to affect load/redraw times
- In max zoom mode all dynamic levels disappear (they behave like text)
1. based on 3EmaBB, uses plot*, barssince and security functions
2. you can't set certain constants from input due to Pinescript limitations - change the code as needed, recompile and use as a private version
3. Levels = trackprice implementation
4. Show Max Bars Back = show_last implementation
5. swma has a fixed length = 4, alma and linreg have additional offset and smoothing params
6. Smoothing is applied by default for visual aesthetics on MTF. To use exact ma mtf values (lines with stair stepping) - disable it
Good Luck! You can explore, modify/reuse the code to build your own indicators.

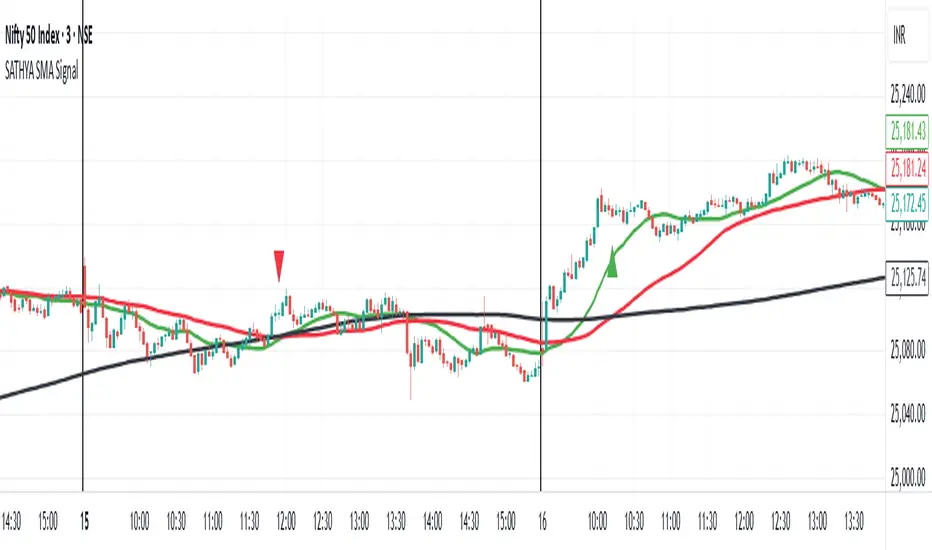
SATHYA SMA SignalThis indicator overlays 20, 50, and 200 Simple Moving Averages (SMAs) on the chart. It generates bullish signals when the 20 SMA crosses above the 200 SMA before the 50 SMA, with both above 200 SMA. Bearish signals occur when the 20 SMA crosses below the 200 SMA before the 50 SMA, with both below 200 SMA. Signals appear as distinct triangles on the chart, helping traders identify trend reversals based on systematic SMA crossovers and order of crossing.

SATHYA SMA Signal)This indicator overlays 20, 50, and 200 Simple Moving Averages (SMAs) on the chart. It generates bullish signals when the 20 SMA crosses above the 200 SMA before the 50 SMA, with both above 200 SMA. Bearish signals occur when the 20 SMA crosses below the 200 SMA before the 50 SMA, with both below 200 SMA. Signals appear as distinct triangles on the chart, helping traders identify trend reversals based on systematic SMA crossovers and order of crossing.
Stocks Multi-Indicator Alerts (cryptodaddy)//@version=6
// Multi-Indicator Alerts
// --------------------------------------------
// This script combines technical indicators and basic analyst data
// to produce composite buy and sell signals. Each block is heavily
// commented so future modifications are straightforward.
indicator("Multi-Indicator Alerts", overlay=true, max_labels_count=500)
//// === Daily momentum indicators ===
// Relative Strength Index measures price momentum.
rsiLength = input.int(14, "RSI Length")
rsi = ta.rsi(close, rsiLength)
// Money Flow Index incorporates volume to track capital movement.
// In Pine Script v6 the function only requires a price source and length;
// volume is taken from the built-in `volume` series automatically.
mfLength = input.int(14, "Money Flow Length")
mf = ta.mfi(hlc3, mfLength)
// `mfUp`/`mfDown` flag a turn in money flow over the last two bars.
mfUp = ta.rising(mf, 2)
mfDown = ta.falling(mf, 2)
//// === WaveTrend oscillator ===
// A simplified WaveTrend model produces "dots" indicating potential
// exhaustion points. Values beyond +/-53 are treated as oversold/overbought.
n1 = input.int(10, "WT Channel Length")
n2 = input.int(21, "WT Average Length")
ap = hlc3 // typical price
esa = ta.ema(ap, n1) // smoothed price
d = ta.ema(math.abs(ap - esa), n1) // smoothed deviation
ci = (ap - esa) / (0.015 * d) // channel index
tci = ta.ema(ci, n2) // trend channel index
wt1 = tci // main line
wt2 = ta.sma(wt1, 4) // signal line
greenDot = ta.crossover(wt1, wt2) and wt1 < -53
redDot = ta.crossunder(wt1, wt2) and wt1 > 53
plotshape(greenDot, title="Green Dot", style=shape.circle, color=color.green, location=location.belowbar, size=size.tiny)
plotshape(redDot, title="Red Dot", style=shape.circle, color=color.red, location=location.abovebar, size=size.tiny)
//// === Analyst fundamentals ===
// Fundamental values from TradingView's database. If a ticker lacks data
// these will return `na` and the related conditions simply evaluate false.
rating = request.financial(syminfo.tickerid, "rating", period="FY")
targetHigh = request.financial(syminfo.tickerid, "target_high_price", period="FY")
targetLow = request.financial(syminfo.tickerid, "target_low_price", period="FY")
upsidePct = (targetHigh - close) / close * 100
downsidePct = (close - targetLow) / close * 100
// `rating` comes back as a numeric value (1 strong sell -> 5 strong buy). Use
// thresholds instead of string comparisons so the script compiles even when
// the broker only supplies numeric ratings.
ratingBuy = rating >= 4 // buy or strong buy
ratingNeutralOrBuy = rating >= 3 // neutral or better
upsideCondition = upsidePct >= 2 * downsidePct // upside at least twice downside
downsideCondition = downsidePct >= upsidePct // downside greater or equal
//// === Daily moving-average context ===
// 50 EMA represents short-term trend; 200 EMA long-term bias.
ema50 = ta.ema(close, 50)
ema200 = ta.ema(close, 200)
longBias = close > ema200 // price above 200-day = long bias
momentumFavorable = close > ema50 // price above 50-day = positive momentum
//// === Weekly trend filter ===
// Higher timeframe confirmation to reduce noise.
weeklyClose = request.security(syminfo.tickerid, "W", close)
weeklyEMA20 = request.security(syminfo.tickerid, "W", ta.ema(close, 20))
weeklyRSI = request.security(syminfo.tickerid, "W", ta.rsi(close, rsiLength))
// Weekly Money Flow uses the same two-argument `ta.mfi()` inside `request.security`.
weeklyMF = request.security(syminfo.tickerid, "W", ta.mfi(hlc3, mfLength))
weeklyFilter = weeklyClose > weeklyEMA20
//// === Buy evaluation ===
// Each true condition contributes one point to `buyScore`.
c1_buy = rsi < 50 // RSI below midpoint
c2_buy = mfUp // Money Flow turning up
c3_buy = greenDot // WaveTrend oversold bounce
c4_buy = ratingBuy // Analyst rating Buy/Strong Buy
c5_buy = upsideCondition // Forecast upside twice downside
buyScore = (c1_buy?1:0) + (c2_buy?1:0) + (c3_buy?1:0) + (c4_buy?1:0) + (c5_buy?1:0)
// Require all five conditions plus trend filters and persistence for two bars.
buyCond = c1_buy and c2_buy and c3_buy and c4_buy and c5_buy and longBias and momentumFavorable and weeklyFilter and weeklyRSI > 50 and weeklyMF > 50
buySignal = buyCond and buyCond
//// === Sell evaluation ===
// Similar logic as buy side but inverted.
c1_sell = rsi > 70 // RSI above overbought threshold
c2_sell = mfDown // Money Flow turning down
c3_sell = redDot // WaveTrend overbought reversal
c4_sell = ratingNeutralOrBuy // Analysts neutral or still buy
c5_sell = downsideCondition // Downside at least equal to upside
sellScore = (c1_sell?1:0) + (c2_sell?1:0) + (c3_sell?1:0) + (c4_sell?1:0) + (c5_sell?1:0)
// For exits require weekly filters to fail or long bias lost.
sellCond = c1_sell and c2_sell and c3_sell and c4_sell and c5_sell and (not longBias or not weeklyFilter or weeklyRSI < 50)
sellSignal = sellCond and sellCond
// Plot composite scores for quick reference.
plot(buyScore, "Buy Score", color=color.green)
plot(sellScore, "Sell Score", color=color.red)
//// === Confidence table ===
// Shows which of the five buy/sell checks are currently met.
var table status = table.new(position.top_right, 5, 2, border_width=1)
if barstate.islast
table.cell(status, 0, 0, "RSI", bgcolor=c1_buy?color.new(color.green,0):color.new(color.red,0))
table.cell(status, 1, 0, "MF", bgcolor=c2_buy?color.new(color.green,0):color.new(color.red,0))
table.cell(status, 2, 0, "Dot", bgcolor=c3_buy?color.new(color.green,0):color.new(color.red,0))
table.cell(status, 3, 0, "Rating", bgcolor=c4_buy?color.new(color.green,0):color.new(color.red,0))
table.cell(status, 4, 0, "Target", bgcolor=c5_buy?color.new(color.green,0):color.new(color.red,0))
table.cell(status, 0, 1, "RSI>70", bgcolor=c1_sell?color.new(color.red,0):color.new(color.green,0))
table.cell(status, 1, 1, "MF down",bgcolor=c2_sell?color.new(color.red,0):color.new(color.green,0))
table.cell(status, 2, 1, "Red dot", bgcolor=c3_sell?color.new(color.red,0):color.new(color.green,0))
table.cell(status, 3, 1, "Rating", bgcolor=c4_sell?color.new(color.red,0):color.new(color.green,0))
table.cell(status, 4, 1, "Target", bgcolor=c5_sell?color.new(color.red,0):color.new(color.green,0))
//// === Alert text ===
// Include key metrics in alerts so the chart doesn't need to be opened.
buyMsg = "BUY: RSI " + str.tostring(rsi, "#.##") +
", MF " + str.tostring(mf, "#.##") +
", Upside " + str.tostring(upsidePct, "#.##") + "%" +
", Downside " + str.tostring(downsidePct, "#.##") + "%" +
", Rating " + str.tostring(rating, "#.##")
sellMsg = "SELL: RSI " + str.tostring(rsi, "#.##") +
", MF " + str.tostring(mf, "#.##") +
", Upside " + str.tostring(upsidePct, "#.##") + "%" +
", Downside " + str.tostring(downsidePct, "#.##") + "%" +
", Rating " + str.tostring(rating, "#.##")
// Alert conditions use static messages; dynamic data is sent via `alert()`
alertcondition(buySignal, title="Buy Signal", message="Buy conditions met")
alertcondition(sellSignal, title="Sell Signal", message="Sell conditions met")
if buySignal
alert(buyMsg, alert.freq_once_per_bar_close)
if sellSignal
alert(sellMsg, alert.freq_once_per_bar_close)
//// === Watch-out flags ===
// Gentle warnings when trends weaken but before full sell signals.
warnRSI = rsi > 65 and rsi <= 65
warnAnalyst = upsidePct < 2 * downsidePct and upsidePct > downsidePct
alertcondition(warnRSI, title="RSI Watch", message="RSI creeping above 65")
alertcondition(warnAnalyst, title="Analyst Watch", message="Analyst upside shrinking")
if warnRSI
alert("RSI creeping above 65: " + str.tostring(rsi, "#.##"), alert.freq_once_per_bar_close)
if warnAnalyst
alert("Analyst upside shrinking: up " + str.tostring(upsidePct, "#.##") + "% vs down " + str.tostring(downsidePct, "#.##") + "%", alert.freq_once_per_bar_close)
//// === Plot bias moving averages ===
plot(ema50, color=color.orange, title="EMA50")
plot(ema200, color=color.blue, title="EMA200")
//// === Cross alerts for context ===
goldenCross = ta.crossover(ema50, ema200)
deathCross = ta.crossunder(ema50, ema200)
alertcondition(goldenCross, title="Golden Cross", message="50 EMA crossed above 200 EMA")
alertcondition(deathCross, title="Death Cross", message="50 EMA crossed below 200 EMA")
Kootch EMA MapKootch EMA overlays the 200 EMA from M1, M5, M15, M30, H1, H4, and D1 on any chart so you always see where higher and lower-timeframe trend gravity actually is. It also builds an optional Fib channel between the most extreme MTF 200 EMAs (min/max), giving you clean intrachannel targets and confluence zones.
What it does
• Plots seven 200 EMAs (M1 → D1) simultaneously via MTF pulls
• Color/weight hierarchy: thicker lines = higher timeframe (clear priority)
• Right-edge TF tags (M1, M5, … D1) so you know exactly what you’re looking at
• Optional Fib levels between min/max MTF 200 EMAs (0 → 1 band) for entries, adds, and take-profit scaling
Why traders use it
• Immediate read on trend alignment vs. chop across timeframes
• Mean-reversion & continuation cues when price stretches from/returns to key EMAs
• Level stacking: use M30/H1/H4/D1 as bias, trade entries around lower-TF reactions
Inputs
• EMA Length (default 200)
• Label offset (push tags off the last bar)
• Show Fib channel toggle + color control
How I use it
• Bias from D1/H4/H1; execution from M5/M15.
• Fade or follow at Fib 0.382 / 0.618 inside the EMA envelope; scale out near Fib 1.0 into HTF EMAs.
• Skip trades when EMAs are braided and distances are compressed.
Notes
• Works on any symbol/timeframe; all TF EMAs are requested explicitly.
• This is a map, not a crystal ball: combine with your playbook (structure breaks, FVGs, liquidity, volume).

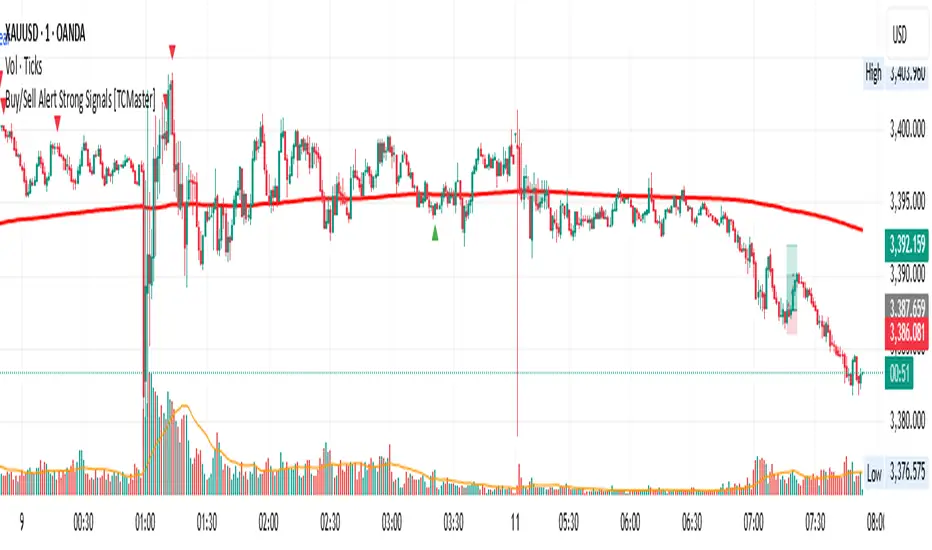
Buy/Sell Alert Strong Signals [TCMaster]This indicator combines Smoothed Moving Averages (SMMA), Stochastic Oscillator, and popular candlestick patterns (Engulfing, 3 Line Strike) to highlight potential trend reversal zones.
Main features:
4 SMMA lines (21, 50, 100, 200) for short-, medium-, and long-term trend analysis.
Trend Fill: Background shading when EMA(2) and SMMA(200) are aligned, visually confirming trend direction.
Stochastic Filter: Filters signals based on overbought/oversold conditions to help reduce noise.
Candlestick pattern recognition:
Bullish/Bearish Engulfing
Bullish/Bearish 3 Line Strike
Alerts for each pattern when Stochastic conditions are met.
⚠️ Note: This is a technical analysis tool. It does not guarantee accuracy and is not financial advice. Always combine with other analysis methods and practice proper risk management.
🛠 How to Use:
1. SMMA Settings
21 SMMA & 50 SMMA: Short- and medium-term trend tracking.
100 SMMA: Optional mid/long-term filter (toggle on/off).
200 SMMA: Major trend direction reference.
2. Trend Fill
EMA(2) > SMMA(200): Background shaded green (uptrend bias).
EMA(2) < SMMA(200): Background shaded red (downtrend bias).
Can be enabled/disabled in settings.
3. Stochastic Filter
K Length, D Smoothing, Smooth K: Adjust sensitivity.
Overbought & Oversold: Default 80 / 20 thresholds.
Buy signals only valid if Stochastic is oversold.
Sell signals only valid if Stochastic is overbought.
4. Candlestick Patterns
3 Line Strike:
Bullish: Three consecutive bullish candles followed by one bearish candle closing below the previous, with potential reversal.
Bearish: Three consecutive bearish candles followed by one bullish candle closing above the previous, with potential reversal.
Engulfing:
Bullish: Green candle fully engulfs the prior red candle body.
Bearish: Red candle fully engulfs the prior green candle body.
5. Alerts
Alerts available for each pattern when Stochastic conditions are met.
Example: "Bullish Engulfing + Stochastic confirm".
📌 Important Notes
Do not use this indicator as the sole basis for trading decisions.
Test on a demo account before applying to live trades.
Combine with multi-timeframe analysis, volume, and proper position sizing.
Koala Trend HackWhat this indicator is
A minimal, “ tweet‑faithful ” trend read with just two visuals:
1. H4 EMA200 (white): the macro/regime line pulled onto any timeframe.
2. Trend Line (colored): the average of EMA‑8 and EMA‑21; its color shows the current state.
How it works (state → color)
Priority is macro first, then short‑term momentum—so it’s simple but still reactive above H4:
Below H4 200 → Red (Be Bearish).
Above H4 200 with wick into it → Yellow (Be Bullish & Pray / Watch the retest).
Above H4 200 and above both 8 & 21 → Green (Be Bullish).
Above H4 200 but below both 8 & 21 → Orange (Be Cautious).
If none of the above applies, it falls back to the 8/21 cluster (above both = green, below both = orange) or stays Yellow (Neutral/Watch).
How it aligns with the tweet’s 5 rules
1. Reclaim EMAs = Long → close > 8 & 21 → Green.
2. Close below EMAs = Be cautious* → close < 8 & 21 → Orange.
3. Retest of H4 EMA200 = Be bullish and pray → close > H4 and low ≤ H4 → Yellow.
4. Lose H4 EMA200 = Be bearish* → close < H4 → Red.
5. Reclaim H4 EMA200 = Be bullish again* → back above H4 (and ideally > 8/21) → Green.
How to use
Green favors longs; Orange means lighten up or wait; Yellow says “watch the level” after a retest; Red warns against longs until H4 200 is reclaimed.
Notes:
The H4 EMA200 is a higher‑timeframe value fetched with request.security; on sub‑H4 charts it updates during the current 4‑hour candle (responsive but can shift slightly until that candle closes).
EMAs 8 & 21 are used internally to color the line; they’re not plotted, keeping the chart clean.
What would make this better? Modify it and show me what you built!
THF Crossover and Trend Signals Golden & Death Cross with VolumeScript Overview:
This Pine Script is designed to assist traders in identifying key buy/sell signals and major trend changes on the chart using Exponential Moving Averages (EMA) and Simple Moving Averages (SMA), as well as visualizing Golden Cross and Death Cross events. The script also includes a volume indicator to highlight the volume trading activity in relation to the price movements.
Key Features:
1. Moving Averages:
EMA 21: Exponential Moving Average over a 21-period, shown in green.
EMA 50: Exponential Moving Average over a 50-period, shown in yellow.
SMA 50: Simple Moving Average over a 50-period, shown in red.
SMA 200: Simple Moving Average over a 200-period, shown in blue.
2. Signals:
Buy Signal: Generated when EMA 21 crosses above SMA 50, indicating a potential upward trend. Displayed with a green label below the price bar.
Sell Signal: Generated when EMA 21 crosses below SMA 50, indicating a potential downward trend. Displayed with a red label above the price bar.
3. Golden Cross (Bullish Trend):
A Golden Cross occurs when EMA 50 crosses above SMA 200, which often signals the start of a long-term upward trend. The signal is displayed with a yellow label below the price bar.
4. Death Cross (Bearish Trend):
A Death Cross occurs when EMA 50 crosses below SMA 200, which often signals the start of a long-term downward trend. The signal is displayed with a blue label above the price bar.
5. Volume Indicator:
The volume is plotted as colored columns. Green indicates higher volume than the 20-period moving average, and red indicates lower volume.
A Volume Moving Average (SMA 20) is also plotted to compare volume changes over time.
How the Script Works:
1. The EMA and SMA lines are plotted on the chart, providing a visual representation of the short- and long-term trends.
2. Buy/Sell signals are triggered based on the crossover between EMA 21 and SMA 50, helping to identify potential entry and exit points.
3. The Golden Cross and Death Cross indicators highlight major trend reversals based on the crossover between EMA 50 and SMA 200, providing clear visual cues for long-term trend changes.
4. Volume is displayed alongside price movements, offering insight into the strength or weakness of a trend.
Key Customizations:
Moving Average Periods: Users can modify the lengths of the EMAs and SMAs for customized analysis.
Volume Moving Average Period: The script allows for adjustment of the volume moving average period to suit different market conditions.
Signal Visibility: The size and color of the buy, sell, Golden Cross, and Death Cross signals can be easily customized to make them more prominent on the chart.
Conclusion:
This script is ideal for traders looking to combine price action with volume analysis, using key technical indicators such as EMA, SMA, Golden Cross, and Death Cross to make informed decisions in trending markets.
---
This explanation covers all aspects of the script and provides a clear understanding of its functionality, which is helpful for sharing the script or using it as an educational resource.

Commodity Trend Reactor [BigBeluga]
🔵 OVERVIEW
A dynamic trend-following oscillator built around the classic CCI, enhanced with intelligent price tracking and reversal signals.
Commodity Trend Reactor extends the traditional Commodity Channel Index (CCI) by integrating trend-trailing logic and reactive reversal markers. It visualizes trend direction using a trailing stop system and highlights potential exhaustion zones when CCI exceeds extreme thresholds. This dual-level system makes it ideal for both trend confirmation and mean-reversion alerts.
🔵 CONCEPTS
Based on the CCI (Commodity Channel Index) oscillator, which measures deviation from the average price.
Trend bias is determined by whether CCI is above or below user-defined thresholds.
Trailing price bands are used to lock in trend direction visually on the main chart.
Extreme values beyond ±200 are treated as potential reversal zones.
🔵 FEATURES\
CCI-Based Trend Shifts:
Triggers a bullish bias when CCI crosses above the upper threshold, and bearish when it crosses below the lower threshold.
Adaptive Trailing Stops:
In bullish mode, a trailing stop tracks the lowest price; in bearish mode, it tracks the highest.
Top & Bottom Markers:
When CCI surpasses +200 or drops below -200, it plots colored squares both on the oscillator and on price, marking potential reversal zones.
Background Highlights:
Each time a trend shift occurs, the background is softly colored (lime for bullish, orange for bearish) to highlight the change.
🔵 HOW TO USE
Use the oscillator to monitor when CCI crosses above or below threshold values to detect trend activation.
Enter trades in the direction of the trailing band once the trend bias is confirmed.
Watch for +200 and -200 square markers as warnings of potential mean reversals.
Use trailing stop areas as dynamic support/resistance to manage stop loss and exit strategies.
The background color changes offer clean confirmation of trend transitions on chart.
🔵 CONCLUSION
Commodity Trend Reactor transforms the simple CCI into a complete trend-reactive framework. With real-time trailing logic and clear reversal alerts, it serves both momentum traders and contrarian scalpers alike. Whether you’re trading breakouts or anticipating mean reversions, this indicator provides clarity and structure to your decision-making.

Super Arma Institucional PRO v6.3Super Arma Institucional PRO v6.3
Description
Super Arma Institucional PRO v6.3 is a multifunctional indicator designed for traders looking for a clear and objective analysis of the market, focusing on trends, key price levels and high liquidity zones. It combines three essential elements: moving averages (EMA 20, SMA 50, EMA 200), dynamic support and resistance, and volume-based liquidity zones. This integration offers an institutional view of the market, ideal for identifying strategic entry and exit points.
How it Works
Moving Averages:
EMA 20 (orange): Sensitive to short-term movements, ideal for capturing fast trends.
SMA 50 (blue): Represents the medium-term trend, smoothing out fluctuations.
EMA 200 (red): Indicates the long-term trend, used as a reference for the general market bias.
Support and Resistance: Calculated based on the highest and lowest prices over a defined period (default: 20 bars). These dynamic levels help identify zones where the price may encounter barriers or supports.
Liquidity Zones: Purple rectangles are drawn in areas of significantly above-average volume, indicating regions where large market participants (institutional) may be active. These zones are useful for anticipating price movements or order absorption.
Purpose
The indicator was developed to provide a clean and institutional view of the market, combining classic tools (moving averages and support/resistance) with modern liquidity analysis. It is ideal for traders operating swing trading or position trading strategies, allowing to identify:
Short, medium and long-term trends.
Key support and resistance levels to plan entries and exits.
High liquidity zones where institutional orders can influence the price.
Settings
Show EMA 20 (true): Enables/disables the 20-period EMA.
Show SMA 50 (true): Enables/disables the 50-period SMA.
Show EMA 200 (true): Enables/disables the 200-period EMA.
Support/Resistance Period (20): Sets the period for calculating support and resistance levels.
Liquidity Sensitivity (20): Period for calculating the average volume.
Minimum Liquidity Factor (1.5): Multiplier of the average volume to identify high liquidity zones.
How to Use
Moving Averages:
Crossovers between the EMA 20 and SMA 50 may indicate short/medium-term trend changes.
The EMA 200 serves as a reference for the long-term bias (above = bullish, below = bearish).
Support and Resistance: Use the red (resistance) and green (support) lines to identify reversal or consolidation zones.
Liquidity Zones: The purple rectangles highlight areas of high volume, where the price may react (reversal or breakout). Consider these zones to place orders or manage risks.
Adjust the parameters according to the asset and timeframe to optimize the analysis.
Notes
The chart should be configured only with this indicator to ensure clarity.
Use on timeframes such as 1 hour, 4 hours or daily for better visualization of liquidity zones and support/resistance levels.
Avoid adding other indicators to the chart to keep the script output easily identifiable.
The indicator is designed to be clean, without explicit buy/sell signals, following an institutional approach.
This indicator is perfect for traders who want a visually clear and powerful tool to trade based on trends, key levels and institutional behavior.

Ceres Trader Simple Trend & Momentum SignalsCeres Trader – Simple Trend & Momentum Signals
Description:
Cut through chart noise with a lightweight, two-factor signal system that combines a classic trend filter (200 EMA) with momentum confirmation (smoothed RSI as a QQE proxy). This indicator plots clean entry arrows—no background shading, no clutter—so you can trade only in the high-probability regime:
Trend Filter: 200-period exponential moving average
Momentum Filter: RSI(14) smoothed over N bars, offset by 50 to create a zero-line
Long Entry: Price above the 200 EMA and the smoothed RSI crosses up through zero → green up-arrow below bar
Short Entry: Price below the 200 EMA and the smoothed RSI crosses down through zero → red down-arrow above bar
Key Features:
Minimalist display: only the 200 EMA and entry arrows
Customizable inputs: EMA length, RSI length, RSI smoothing period
Ultra-low CPU load: suitable for lower timeframes (e.g. 1 min gold futures)
Yellow label text: for optimal visibility on dark or light chart backgrounds
How to Use:
Add the script to your TradingView chart.
Choose your timeframe and adjust inputs as needed.
Take only the long signals when price is above the EMA, and only the short signals when price is below.
Place stops just beyond the EMA; targets can be measured swings or fixed R-multiples.
Notes:
Designed as a regime-based entry filter—no exits or background fills included.
Feel free to combine with your own stop-loss, take-profit, and money-management rules.
Trade smarter, not harder—let the market tell you only when both trend and momentum align.
