[Delphi] RSI - Dynamic Movement Sys - Volume Oscil - Pista CicCopyright by Delphi v1.0 05/07/2018 - 12/07/2018
RSI - Dynamic Movement System - Volume Oscillator - Pista Ciclica
Follow me for updates and strategies
05/07/2018 Added Pista Ciclica
05/07/2018 Added RSI
09/07/2018 Added ADX - Dynamic Movement System
12/07/2018 Added Volume Oscillator
Recherche dans les scripts pour "美联储议息会议12月时间"

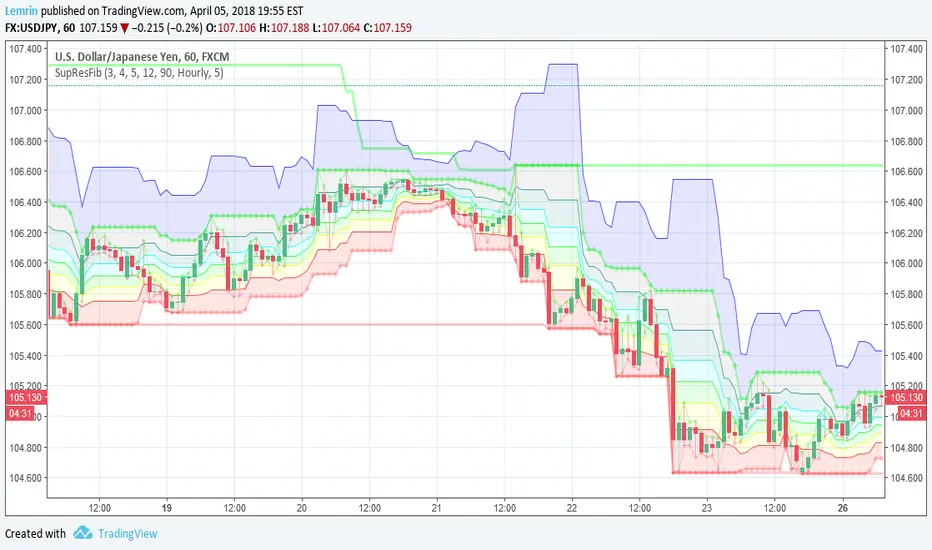
Automatic Support, Resistance, Fibonacci LevelsThis indicator plots absolute high and low values for up to five completely adjustable time periods (in months, weeks, days, hours, minutes) and optionally calculates the Fibonacci levels on the pair of absolutes of your choice, ascending or descending, and mimics the shading available in the built-in Fib charting tools (e.g. retracement).
Here are a few screenshots of the same chart with various options selected.
3-Month, 4-Week, and 5-Day absolutes with 3-Monthly Fib plotted:
The same chart with 4-Weekly Fib:
The same chart with 5-Daily Fib:
5-Day, 12-Hour, 90-Minute absolutes with 12-Hourly Fib:
Zoomed in, on a 30-minute interval, with 90-minute Fib:
With descending ("inverted") 90-minute Fib:
I started putting this together for Vazzyb, who was looking for a way to automate plotting horizontal support and resistance levels for monthly, weekly, and daily extremes, and then I added additional features as they occurred to me. Special thanks to Paaax, who suggested I add Fib levels.
I am leaving the code open, so you may feel free to grab snippets you like and use them for your own purposes. Of particular interest may be my custom "calc_fib()" function, which accepts any series pair, as well as a Boolean indicating whether to invert, and returns an array with each of the major Fibonacci levels: .
If anyone likes this enough to feel generous, please feel free:
BTC
3KmFchJ18QvMzAJKDcFQXvyK9p1EHWQdhP
BCH
qqtrw64ptuwprk5vtj3z8qwkvh3v0jawxq7khqng7x
ETH
0x9b51361A278910Ba3945C7519C9f0FA8a77df18d
LTC
MDeWWsP7XCG2zQuZ2dYALZXQ52u2qkc8fh
P.S. If you want the time lengths to be as close to accurate as possible, don't forget to change the number of days per week when using for cryptocurrency!
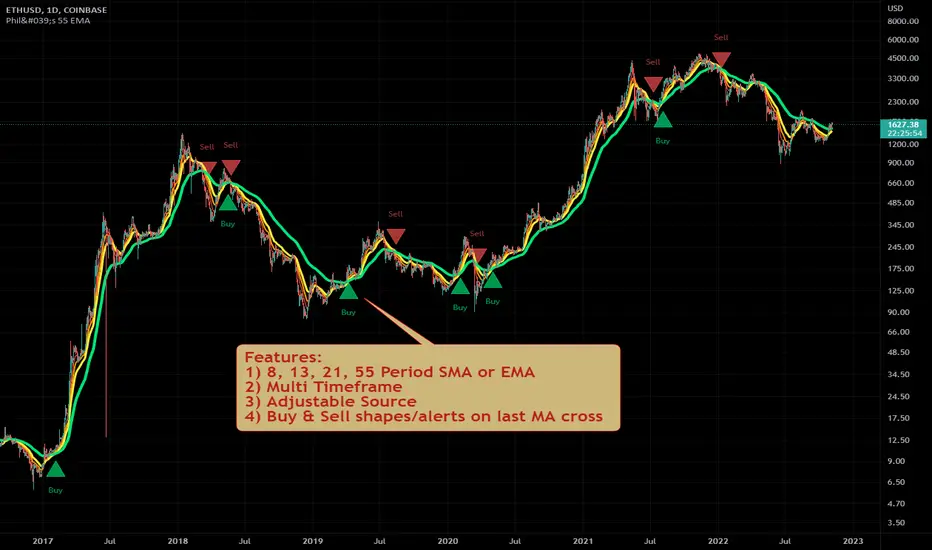
Philakone 55 EMA Swing Trading StrategyThis strategy was inspired by Philkone Crypto's "Lesson 12: Let's Learn Advanced 55 EMA Strategy" video.
steemit.com
Supports Buy and Sell Condition alerts and displays arrows on the chart.
Ichimoku Kinko Hyo + HULL-MA_X + MacDThe Ichimoku Kinko Hyo system includes five kinds of signal, of which this strategy uses the most recent of ones i.e. Tenkan Sen / Kijun Sen Cross and price crosses the Kijun Sen. As the Chikou Span, Senkou Span A and Senkou Span B are shifted into the past/future, the trigger signals will be only be used for visual confirmation and not part of the strategy.
The Tenkan Sen, also known as the Turning or Conversion line, is a moving average of the highest high and lowest low over the last 9 periods in this strategy.
The Kijun Sen, also known as the Standard or Base line, is a moving average of the highest high and lowest low over the last 24 periods in this strategy.
The Chikou Span, also known as the Lagging line, is the closing price plotted 24 periods behind in this strategy.
The Senkou Span A, also known as the 1st leading line, is a moving average of the Tenkan Sen and Kijun Sen and is plotted 24 periods ahead in this strategy.
The Senkou Span B, also known as the 2nd leading line, is a moving average of the highest high and lowest low over the last 51 trading days is plotted 24 periods ahead in this strategy.
Moving average convergence divergence (MaCD) is a trend-following momentum indicator that shows the relationship between two moving averages of prices. The MaCD is calculated in this strategy by subtracting the 24-day exponential moving average (EMA) from the 12-day EMA. A nine-day EMA of the MACD, called the "signal line", aMaCD in this case, is then plotted on top of the MaCD. In this strategy, MaCD/ aMaCD Cross is functioning as a trigger for buy and sell signals.
As with most technical analysis methods, Ichimoku is likely to produce frequent conflicting signals in non-trending markets, So in addition to Ichimoku Kinko Hyo, the Hull MA is popular amongst some day traders, as the indicator which in combination with MaCD attempts to give an accurate signal by eliminating lags and improving the smoothness of the line.
Alan Hull, developed this moving average indicator and hence it’s called the Hull MA.
Now, let’s dissect how the Hull moving average is calculated.
The Hull MA involves the weighted moving average (WMA) in its calculation.
First, calculate the WMA with period (n / 2) and multiply this by 2. Remember ‘n’ is the time period configurable based on the trader’s requirement. The default setting is 12 periods in this strategy, fast Hull MA crossing slow Hull MA will generate a circle on charts.
Second, calculate the WMA for period “n” and subtract if from the first step. Thirdly, calculate the weighted moving average with period sqrt (n) using the data from the second step. You can take a look at the below formula:
Hull MA= WMA (2*WMA (n/2) − WMA (n)), sqrt (n))
The Hull MA Cross in combination with Tenkan Sen / Kijun Sen Cross and MaCD tries to give an accurate signal by eliminating lags and improve the smoothness of price activity. Please note that price trends can and do change often, so your readings of the charts and this trading system should be probabilistic, rather than predictive.

Pullback Trading Tool R5-65 by JustUncleLBy request this is an updated version of the "PullBack Trading Tool": removes experimental "OCC" channel, added option to display ribbons or just single moving average lines, added alert arrows for "PB" exits, added alertcondition for TV alarm subsystem, added some extract options for Pivot points and general cleanup of code.
Description:
This project incorporates the majority of the indicators needed to analyse and trade Trends for Pullbacks, swings and reversals.
Incorporated within this tool are the following indicators:
1. Major industry (Banks) recognised important EMAs in an EMA Ribbon:
Lime = EMA5 (Optional Display)
DodgerBlue = EMA12 (Optional Display)
Red = EMA36 (Optional display)
Green = EMA89
Blue = EMA200
Black = EMA633
2. The 5 EMA (default) High/Low/Close Price Action Channel (PAC), the PAC channel display is disabled by default.
3. Optionally display Fractals and optional Fractal levels
4. Optional HH, LH, LL, HL finder.
5. Optional Buy/Sell "PB" exit Alerts with Optional 200EMA filter.
6. Coloured coded Bar high lighting based on the PAC:
blue = bar closed above PAC
red = bar closed below PAC
gray = bar closed inside PAC
7. Alert condition sent to TradingView's Alarm subsystem for PB exits.
8. Pivot points with optional labels.
9. EMA5-12 Ribbon is displayed by default.
10.EMA12-36 Ribbon is displayed by default
Set up and hints:
I am unable to provide a full description here, as Pullback Trading incorporates a full trading Methodology, there are a number of articles and books written on the subject.
Set the chart to Heikin Ashi Candles (optional).
I also add a "Sweetspot Gold R3" indicator to the chart as well to help with support and resistance finding and shows where the important "00" lines are.
First on a weekly basis say Sunday night or Monday morning, analyse the Daily and Weekly charts to establish overall trends, and support/resistant levels. Draw significant mini trend lines (2/3 TL), vertical trend lines (VTL) and S/R levels. Can use the Pivots points to guide VTL drawing and Fractals to help guide 2/3 TL drawing.
Once the trend direction and any potential major reversals highlighted, drop down to lower timeframe chart and draw appropriate mini Trend line (2/3 TL) matching the established momentum direction. Take note of potential pull backs from and of the EMAs, in particular the EMA5-12 ribbon, EMA12-36 Ribbon and the 200EMA. Can use the Pivots and/or Fractals points to guide your 2/3 TL drawing.
Set a TradingView alarm on the "PBTOOL alert", with the default settings this normally occurs before or during the Break of the manually drawn TL lines.
Once alerted check to see if the TL is broken and is returning to trend away from the EMA lines, this is indicated by bar colour change to trend directional colour.
You can trade that alert or drop down to even lower time frames and perform the same TL analysis there to find trades at the lower TF. Trading at lower TF you will allow tighter Stop loss settings.
Other than the "SweetSpot Gold R3" indicator, you should not need any other indicator to successfully trade trends for Pullbacks and reversals. If you really want another indicator I suggest a momentum one for example: AO ( Awesome Oscillator ), MACD or Squeeze Momentum.

Spartan Trader FX IndicatorUnofficial (I am not affiliated to www.spartantraderfx.com in any way) combo indicator providing all the indicators needed for their trading system (default coloring as presented in the materials):
EMA 12 line
EMA 36 line
EMA 200 line
EMA 633 line
EMA 200 and EMA 633 volatility zone
EMA 12/36 crossover arrows
heiken ashi color overlay(helpful when trying to see true open and close of candles using regular candlesticks)

Scalping Swing Trading Tool R1-4 by JustUncleLDescription:
This study project is a "Scalping Swing trading Tool" and is an alternative to the "Scalping Pullback Tool R1". It is designed for a two pane TradingView chart layout :
the first pane set to 15min Time Frame;
the second pane set to 1min Time Frame(TF).
The tools incorporates the majority of the indicators needed to analyse and scalp Trends for Swings, PullBacks and reversals on 15min charts and 1min charts.
Incorporated within this tool are the following indicators:
1. The following EMAs are drawn automatically:
Green = EMA89 (15min TF) = EMA75 (1min TF)
Blue = EMA200 (15min TF) = EMA180 (1min TF)
Black = EMA633 (15min TF) = EMA540 (1min TF)
2. The 10EMA (default) High/Low+Close Price Action Channel (PAC), the PAC channel
display is disabled by default.
3. Optionally display Fractals and optional Fractal levels
4. Optional HH, LH, LL, HL finder.
5. Coloured coded Bar high lighting based on the PAC:
blue = bar closed above PAC
red = bar closed below PAC
gray = bar closed inside PAC
lime Line = EMA10 of bar close
6. Pivot points (disables Fractals automatically when selected) with optional labels.
7. EMA5-12 Channel is displayed by default.
8. EMA12-36 Ribbon is displayed by default
9. Optionally display EMA36 and PAC instead of EMA12-36 Ribbon.
Set up and hints:
I am unable to provide a full description here, as Pullback Trading incorporates a full trading Methodology, there are a number of articles and books written on the subject.
Set to two pane TradingView chart, set first pane to 15Min and second to 1min.
Set the chart to Heikin Ashi Candles (optional).
I also add a "Sweetspot Gold2" indicator to the chart as well to help with support and resistance finding and shows where the important "00" lines are.
Use the EMA200 on the 15min pane as the anchor. So when prices above EMA200 we only trade long (buy) and when prices below the EMA200 we only trade short (sell).
On the 15min chart draw any obvious Vertical Trend Lines (VTL), use Pivots point as a guide.
On the 15min chart what we’re looking for price to Pullback into the EMA5-12 Channel or EMA12-36 ribbon, we draw Trendlines uitilising the Pivot points or Fractals to guide your TL drawing.
On the 15min chart look for the trend to resume and break through the drawn TL. The bar color needs to change back to the trend direction colour to confirm as a break.
Now this break can be traded as a 15min trade or now look to the 1min chart.
On the 1min chart draw any Pullback into any of the EMAs.
On the 1min chart look for the trend to resume and break through the drawn TL. The bar color needs to change back to the trend direction colour to confirm as a break.
Now this break can be traded as a 1min trade.
There is also an option to select Pristine (ie Ideal) filtered Fractals, which look like tents or V shape 5-candle patterns. These are actually used to calculate the Pivot points as well.
Other than the "SweetSpot Gold2" indicator, you should not need any other indicator to successfully trade trends for Pullbacks and reversals. If you really want another indicator use the AO (Awesome Oscillator) as it is momentum based.

Murray Math LevelsThe original script was posted on ProRealCode by user supertiti.
The Murray Math lines levels are determined within some principles of Gann levels and candlesticks formations. The Murray Math levels act pretty much like pivot and support/resistance areas.
1. Line 8/8 - 0/8 (Ultimate Support and Ultimate Resistance).
Those lines are the most strong concerning Support and resistance.
2. Line 7/8 (Weak, Place to Stop and Reverse).
This line is weak. If suddenly the price was going too fast and too far and stops around this line it means the price will reverse down very soon. If the price did not stop near this line this price will continue the movement to the line 8/8.
3. Line 1/8 (Weak, Place to Stop and Reverse).
This line is weak. If suddenly the price was going too fast and too far and stops around this line it means the price will reverse up very soon. If the price did not stop near this line this price will continue the movement down to the line 0/8.
4. Line 2/8 and 6/8 (Pivot, Reverse)
Those two lines yield the line 4/8 only to the strength to reverse the price movement.
5. Line 5/8 (Top of Trading Range)
The price is spending the about 40% of the time on the movement between the lines 5/8 and 3/8. If the price is moving near line 5/8 and stopping near the line during the 10 - 12 days so it means that it is necessary to sell in this "bonus zone" (some people are doing like this) but if the price is keeping the tendency to stay above 5/8 line, so it means that the price will be above. But if the price is droping below 5/8 line it means that the price will continue falling to the next level of resistance.
6. Line 3/8 (Bottom of Trading Range).
If the price is below this line and in uptrend it means that it will be very difficult for the price to break this level. If the price broke this line during the uptrend and staying above during the 10- 12 days it means that the price will be above this line during the 40% of its time moving between this line and 5/8 line.
7. Line 4/8 (Major Support/Resistance Line).
It is the major line concerning support and resistance. This level is the better for the new sell or buy. It is the strong level of support of the price is above 4/8. It is the fine resistance line if the price is below this 4/8 line.
Candlestick Trend Indicator v0.5 by JustUncleLRequested Update to this Indicator alert project. In this update I have added the option to be able select which Price Action candles you want included in the display and the generated alarm Alert. Other changes also included in this update:
Also added a Price Action candle for "Last Fractal S/R Break", this also a good continuation indication.
Added option to select a different moving average types for directional MA line.
Modified some default settings, using HullMA instead of Zero Lag EMA and standard MACD settings(12,26,9).
Description:
This is a trend following indicator and alert for Binary Options based on Candlestick patterns and trend line -
NOTE: original system was a forex trading system.
This code combines a number of indicators to create an overall trading strategy.
The indicator recognises and displays some useful candle named defined patterns that are used to support trend continuation:
Bearish + Bullish PinBars
Dark Cloud Cover
Piecing Line
Bullish + Bearish Harami
Bullish + Bearish Engulfing Candle
Bullish + Bearish Last Fractal S/R break
Also recognises main Price Action candles from ChrisMoody (CM), the four(4) price action patterns are colored coded bars:
Yellow = Inside Bar - breakout/continuance
Orange = Outside Bar - breakout/continuance
Aqua/Fuschia = Up/Down Shaved Bars - Buying/Selling pressure
Red/Green = Possible reversal PinBars - Reverse Down / reverse Up
The highlighted candles (maroon and darker green) represent the defined PA patterns that have been confirmed following the current trend direction that is indicated by the Hull MA(20) line (can select a different type of MA, or even disable) and confirmed by MACD direction (can be disabled). The confirmed Alerts are indication by green (buy) and red (sell) dots at the bottom of the chart. An alert is generated from this selection for the alert condition of the alarming system.
The fractal upper/lower break lines are also draw, if the (optional) last fractal break line is broken by a highlighted bar then this indicates a stronger trend conformation.
The MACD indicator MACD DEUTER 2 colour(12,26,9) you can visually see the MACD histogram colours with MACD direction - needs "MACD DEUTER 2 colour" indicator.
This multi-indicator set up is suitable for 1hr, 4hr and daily charts with 1-4 candle expiry.
References and Inspiration from:
Fractal Levels by RicardoSantos
Almost Zero Lag EMA
Candlestick Patterns With EMA by rmwaddelljr
CM_Price-Action-Bars by ChrisMoody
www.forexstrategiesresources.com
"Scalp Jockey - MTF MA Cross Visual Strategizer by JayRogers"

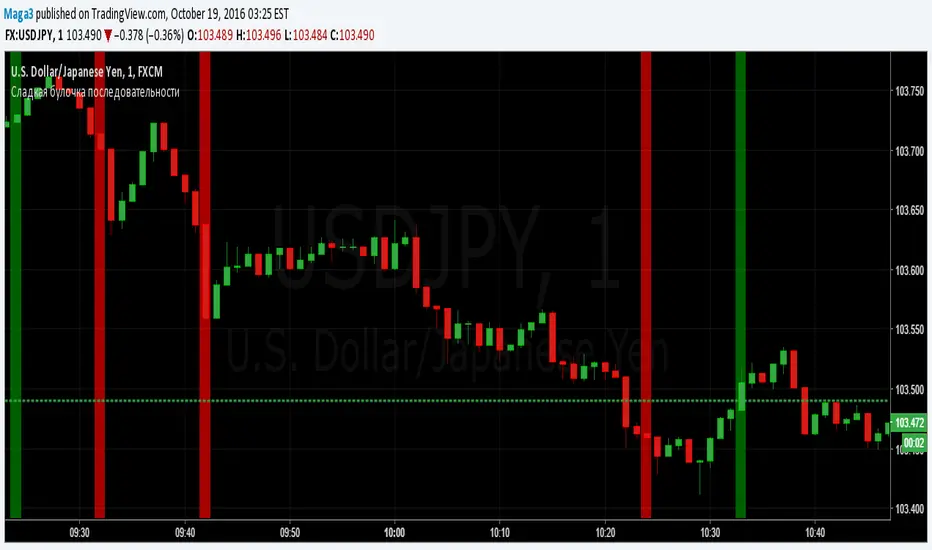
Sladkaya Bulochka PosledovatelnostiSerial number of the same color candles - a popular method of how to find the exact entry zones and determine the trends and kickbacks.
The number of consecutive candles usually starts from 3 and up to 12 in some strategies.
5 candles in sequence - one of the most popular signals. Login at the close of the 5th candle.
---------------------------------------------
Последовательное число свечей одинакового цвета - популярный метод как поиска точных зон входа, так и определения трендов и откатов.
Число последовательных свечей, как правило, начинается с 3 и доходит до 12 в некоторых стратегиях.
5 свечей в последовательности - один из наиболее популярных сигналов. Вход на закрытии 5й свечи.
MACD trend heatmap (by ChartArt)This is an overlay indicator which uses the classic period settings and signals from the MACD (Moving Average Convergence/Divergence) indicator to overlay a heatmap using all the information the MACD generates with its three periods (12,26,9).
The first two moving averages which the MACD uses (12 and 26) can be plotted on the chart like usual EMAs.
In addition to the background color function (the heatmap) and the EMAs, there is an optional bar color alert when the uptrend or the downtrend as measured by the MACD appears to be very strong.

Stoch_VX2Nothing New about a Stochastic but maybe in how you use them ( Other than Over bought / Sold cross over & divergence signals )
Running 3 bands
Standard stoch & tops & bottoms swing band
Optimised variables 12, 5 , 3 or fib 13, 5, 3 / - 12 / 3 / 3 a little bit tighter to combine both smoothness & accuracy. These are my own personal setting inc. Strategy.

MACD Color Trawler (by ChartArt)This version of the MACD indicator is 'trawling' (checking) if the MACD histogram and the zero line crossing with the MACD line are both positive or negative. The idea behind this is to show areas with higher or lower risk.
Features:
1. Enable the bar color
2. Enable the background color
3. Change zero line value
FYI:
"The MACD-Histogram is an indicator of an indicator. In fact, MACD is also an indicator of an indicator. This means that the MACD-Histogram is the fourth derivative of price."
First derivative: 12-day EMA and 26-day EMA
Second derivative: MACD (12-day EMA less the 26-day EMA)
Third derivative: MACD signal line (9-day EMA of MACD)
Fourth derivative: MACD-Histogram (MACD less MACD signal line)
Source: stockcharts.com

Multi-Timeframe MACD with Color Mix (Nikko)Multi-Timeframe MACD with Color Mix (Nikko) Indicator
This documentation explains the benefits of the "Multi-Timeframe MACD with Color Mix (Nikko)" indicator for traders and provides easy-to-follow steps on how to use it. Written as of 05:06 AM +07 on Saturday, October 04, 2025, this guide focuses on helping you, as a trader, get the most out of this tool with clear, practical advice before diving into the technical details.
Benefits for Traders
1. Multi-Timeframe Insight
This indicator lets you see momentum trends across 15-minute, 1-hour, 1-day, and 1-week timeframes all on one chart. This big-picture view helps you catch both quick market moves and long-term trends without flipping between charts, saving you time and giving you a fuller understanding of the market.
2. Visual Momentum Representation
The background changes from red to green based on short-term (15m) momentum, giving you a quick, easy-to-see signal—red means bearish (prices might drop), and green means bullish (prices might rise). The histogram uses a mix of red, green, and blue colors to show the combined strength of the 1-hour, 1-day, and 1-week timeframes, helping you spot strong trends at a glance (e.g., a bright mix for strong momentum, darker for weaker).
3. Enhanced Decision-Making
The background and histogram colors work together to confirm trends across different timeframes, making it less likely you’ll act on a false signal. This helps you feel more confident when deciding when to buy, sell, or hold.
4. Proactive Alert System
You can set alerts to notify you when the percentage of bullish timeframes hits your chosen levels (e.g., below 10% for bearish, above 90% for bullish). This keeps you in the loop on big momentum shifts without needing to watch the chart all day—perfect for when you’re busy.
5. Flexibility and Efficiency
You can turn timeframes on or off, adjust settings like speed of the moving averages, and tweak transparency to fit your trading style—whether you’re a fast scalper or a patient swing trader. Everything is shown on one chart, saving you effort, and the colors make it simple to read, even if you’re new to trading.
How to Use It
Getting Started
Add the Indicator: Load the "Multi-Timeframe MACD with Color Mix (Nikko)" onto your TradingView chart using the Pine Script editor or indicator library.
Pick Your Timeframes: Turn on the timeframes that match your trading—use 15m and 1h for quick trades, or 1d and 1w for longer holds—using the enable_15m, enable_1h, enable_1d, enable_1w, and enable_background options.
Reading the Colors
Background Gradient: Watch for red to signal bearish 15m momentum and green for bullish momentum. Adjust the Background_transparency (default 75%, or 25% opacity) if the chart feels too busy—try lowering it to 50 for clearer candlesticks in fast markets.
Histogram and EMA Colors:
The histogram and its Exponential Moving Average (EMA) line show a mix of red (1-week), green (1-day), and blue (1-hour) based on how strong the momentum is in each timeframe.
Brighter colors mean stronger momentum—white (all bright) shows all timeframes are pushing up hard, while darker shades (like gray or black) mean weaker or mixed momentum.
Turn off a timeframe (e.g., enable_1h = false) to see how it changes the color mix and focus on what matters to you.
Setting Alerts
Set Your Levels: Choose a threshold_low (default 10%) and threshold_high (default 90%) based on your comfort zone or past market patterns to catch big turns.
Get Notifications: Use TradingView alerts to get pings when the market hits your set levels, so you can act without staring at the screen.
Practical Tips
Pair with Other Tools: Use it with support/resistance lines or the RSI to double-check your moves and build a solid plan.
Tweak Settings: Adjust fast_length, slow_length, and signal_smoothing to match your asset’s speed, and bump up the lookback (default 50) for steadier trends in wild markets.
Practice First: Test different timeframe combos on a demo account to find what works best for you.
Understanding the Colors (Simple Explanation)
How Colors Work
The histogram and its EMA line use a color mix based on a simple idea from color theory, like mixing paints with red, green, and blue (RGB):
Red comes from the 1-week timeframe, green from 1-day, and blue from 1-hour.
When all three timeframes show strong upward momentum, they blend into bright white—the brightest color, like a super-bright light telling you the market’s roaring up.
If some timeframes are weak or pulling down, the mix gets darker (like gray or black), warning you the momentum might not be solid.
Brighter is Better
Bright Colors = Strong Opportunity: The brighter the histogram and EMA (closer to white), the more all your chosen timeframes are in agreement that prices are rising. This is your signal to think about buying or holding, as it points to a powerful trend you can ride.
Dark Colors = Caution: A darker mix (toward black) means some timeframes are lagging or bearish, suggesting you might wait or consider selling. It’s like a dim light saying, “Hold on, check again.”
Benefit in Practice: Watching the brightness helps you jump on the best trades fast. For example, a bright white histogram on a green background is like a green traffic light—go for it! A dark gray on red is like a red light—pause and rethink. This quick color check can save you from bad moves and boost your profits when the trend is strong.
Why It Helps
These colors are your fast friend in trading. A bright histogram means all your timeframes are cheering for an uptrend, giving you the confidence to act. A dull one tells you to be careful, helping you avoid traps. It’s like having a color-coded guide to pick the hottest market moments!
Technical Details
Input Parameters
Fast Length (default: 12): Short-term moving average speed.
Slow Length (default: 26): Long-term moving average speed.
Source (default: close): Price data used.
Signal Smoothing (default: 9): Smooths the signal line.
MA Type (default: EMA): Choose EMA or SMA.
Timeframe and Scaling
Timeframes: 15m, 1h, 1d, 1w, with on/off switches.
Lookback Period (default: 50): Sets the data window for trends.
Background Transparency (default: 75%): Controls background see-through level.
MACD Calculation
Per Timeframe: Uses request.security():
MACD Line: ta.ema(src, fast_length) - ta.ema(src, slow_length).
Signal Line: ta.ema(MACD, signal_length).
Histogram: (macd - signal) / 3.0.
Background Gradient
15m Normalization: norm_value = (hist_15m - hist_15m_min) / max(hist_15m_range, 1e-10), limited to 0-1.
RGB Mix: Red drops from 255 to 0, green rises from 0 to 255, blue stays 0.
Apply: color.new(color.rgb(r_val, g_val, b_val), Background_transparency).
Histogram and EMA Colors
Color Assignment:
1h: Blue (#0000FF) if hist_1h >= 0, else black.
1d: Green (#00FF00) if hist_1d >= 0, else black.
1w: Red (#FF0000) if hist_1w >= 0, else black.
Final Color: final_color = color.rgb(min(r, 255), min(g, 255), min(b, 255)).
Plotting: Histogram and EMA use final_color; MACD (#2962FF), signal (#FF6D00).
Alerts
Bullish Percentage: bullish_pct = (bullish_count / bullish_total) * 100, counting hist >= 0.
Triggers: Below threshold_low or above threshold_high.
--------------------------------------------------------------------
Conclusion
The "Multi-Timeframe MACD with Color Mix (Nikko)" is your all-in-one tool to spot trends, confirm moves, and trade smarter with its bright, easy-to-read colors. By using it wisely, you can sharpen your market edge and trade with more confidence.
This README is tailored for traders and reflects the indicator's practical value as of 05:06 AM +07 on October 04, 2025.

Kairi Relative Index Upgrated v1Kairi Relative Index Upgraded v1 — how far from “fair” are we, right now?
Most oscillators mash together price and momentum in ways that are hard to explain to a new trader. KRI is refreshingly simple: it measures how far price is from its moving average, as a percent of that average.
KRI = 100 × (Price − SMA) / SMA
Above 0 → price is above its average (stretched up).
Below 0 → price is below its average (stretched down).
The farther from 0, the more stretched we are from the mean.
This upgraded version keeps the pane clean (zero line, colored KRI, optional guide rails at +Line Above / Line Below) so you can read extension, reversion pressure, and reclaims at a glance—on any timeframe.
(If you add screenshots: image #1 should label the zero line and ± threshold lines; image #2 should show a textbook “overshoot at VAH/VAL + KRI extreme → rotate back to POC.”)
What you’re seeing (and how to read it fast)
KRI line
Green when KRI ≥ 0 (price above SMA)
Red when KRI < 0 (price below SMA)
Zero line = the moving average itself (no stretch).
Guide lines (default +10/−10) = “This is pretty far for this setting.” Treat these as review-and-decide zones, not auto-trade signals.
Three quick reads:
Magnitude: how far from the mean (size of KRI).
Direction: above/below zero (which side of the mean).
Turn: KRI curling back toward zero (reversion starting) or accelerating away (trend impulse continuing).
What KRI really measures (plain-English)
The SMA(length) is your “fair value” line for this indicator.
KRI tells you the percentage deviation from that fair value—normalized, so you can compare across assets/timeframes with the same length.
Because it’s a pure distance metric, KRI excels at:
spotting over-extensions into VP edges (VAH/VAL) and AVWAP,
timing mean-reversion back to POC/AVWAP in balance,
confirming reclaims (KRI crossing back through zero at a level),
framing pullbacks in trend (healthy dips usually avoid deep negative KRI in strong uptrends).
Using KRI on any timeframe
The workflow is always Location → Flow → KRI:
Location: a real level (Volume Profile v3.2’s VAH/VAL/POC/LVNs or Anchored VWAP).
Flow quality: check CVDv1 (Alignment OK? Absorption not red?).
KRI: are we stretched into/away from the level, and is KRI turning?
Scalping (1–5m)
Fade the stretch (balance): At VAH/VAL or Session AVWAP, an extreme KRI that rolls back toward zero = quick rotation to the middle (POC/AVWAP).
Don’t fade if bands are expanding and flow is strong (CVDv1 says go) — big KRI can stay big in expansion.
Intraday (15m–1H)
Continuation after pullback: In uptrends, look for shallow negative KRI at support (VAL/AVWAP) that turns up → join trend.
Failed breakout tell: Price pokes above VAH but KRI barely increases or rolls over quickly → likely a reclaim back inside value.
Swing (2H–4H)
Edge-to-mean rotations: At composite VAH/VAL, KRI extremes are great context: fade back to POC/HVNs if flow doesn’t confirm a breakout.
Reclaim confirmation: After a flush below Weekly AVWAP, KRI crossing back up through zero on the reclaim bar is a clean green light.
Position (1D–1W)
Regime posture: Multi-day runs with sustained positive KRI (and shallow dips) = constructive; mirror for downtrends. Use KRI pullbacks to ~0 at Weekly AVWAP for adds.
Entries, exits, and risk (simple rules)
Mean-reversion entry: At VAH/VAL or AVWAP, wait for KRI extreme at/through your guide line and a turn back toward zero.
Stop: just beyond the level; Target: POC/HVN or the zero line on KRI.
Trend-continuation entry: In a trend, take pullbacks where KRI stays modest (doesn’t blow through your lower/upper guide) and turns back with the trend at the level.
Avoid: chasing breakouts where KRI is already extreme and still climbing unless CVDv1 says Alignment OK + no Absorption and you have a clean retest.
Settings that matter (and how to tune them)
Length (default 50): defines the moving average “fair value.”
Shorter (20–34): faster, more signals, more noise—good for intraday.
Longer (50–100): steadier, better for swings/position.
Source (default close): keep it simple; hlc3 or close both work.
Line Above / Below (defaults +10/−10): your review zones. Tune them to the asset/timeframe:
Scroll back 6–12 months and eyeball typical |KRI| spikes. Set your lines around the 80th–90th percentile of |KRI| for that market and length.
Majors often need smaller thresholds than thin alts on the same timeframe.
Tip: If your KRI is always beyond the lines, increase length or widen the thresholds. If it never touches them, shorten length or tighten thresholds.
What to look for (pattern cheat sheet)
Stretch into level → curl: KRI tags an extreme right at VAH/VAL/AVWAP, then turns back → classic rotation.
Shallow pullback in trend: KRI dips toward zero but doesn’t hit your lower guide, then turns up at support → continuation.
No-juice break: New price high with weaker KRI (smaller positive % vs prior leg) → breakout lacks extension; plan for retest or reclaim.
Zero-line reclaims: After a washout, KRI crosses zero as price reclaims AVWAP/VAL → clean confirmation.
Combining KRI with other tools
Cumulative Volume Delta v1 (CVDv1):
Use KRI for stretch/turn, CVDv1 for quality.
A KRI extreme at VAH with CVDv1 Absorption (red) is a do-not-chase; look for the fail/reclaim.
A KRI pullback toward zero at VAL with Alignment OK + strong Imbalance + no Absorption = high-quality continuation.
Volume Profile v3.2:
KRI’s best signals happen at VAH/VAL/POC/LVNs.
LVN traversals with rising KRI often run quickly to the next HVN—use VP for targets.
Anchored VWAP :
Treat AVWAP as fair-value rails. KRI zero cross on an AVWAP reclaim is your green flag; KRI extreme + failure to accept beyond AVWAP warns of a fake break.
Common pitfalls KRI helps you avoid
Buying high into a tired move: KRI already very positive at VAH and rolling over = likely rotation; wait.
Fading true expansion: In strong trends with confirmed flow, KRI can remain extreme; don’t automatically fade just because it’s “far.”
Wrong thresholds: Copy-pasting ±10 to every market/timeframe can mislead. Calibrate to the market you trade.
Practical defaults to start with
Length: 50
Lines: +10 / −10 as placeholders—calibrate later.
Timeframes: great out of the box on 15m–4H; for 1–5m try Length 34 and tighter lines; for daily swings try Length 100 and broader lines.
Process: Level → CVDv1 quality → KRI stretch/turn. If any of the three disagree, wait for the retest.
Disclaimer & Licensing
This indicator and its description are provided for educational purposes only and do not constitute financial or investment advice. Trading involves risk, including the possible loss of capital. makes no warranties and assumes no responsibility for any decisions or outcomes resulting from the use of this script. Past performance is not indicative of future results. Use at your own risk.
Licensing & Attribution:
Copyright (c) 2018–present, Alex Orekhov (everget). Modified and upgraded by .
The original “Kairi Relative Index” is released under the MIT License, and this derivative is distributed under the MIT License as well. Permission is hereby granted, free of charge, to any person obtaining a copy of this software and associated documentation files to deal in the Software without restriction, subject to the conditions of the MIT License, including the above copyright notice and this permission notice. The Software is provided “AS IS,” without warranty of any kind, express or implied.

Cycle Momentum Filter [JopAlgo]Cycle Momentum Filter (CMF) — spot “when” to engage the market, on any timeframe
Markets breathe in cycles (expansion → contraction) while momentum and trend decide which moves actually travel. CMF is a compact filter that blends those ideas so you can answer two questions before you click:
Is this a good moment to take a trade? (cycle position)
If I take it, is there enough force behind the move to carry it? (momentum + trend)
CMF does not replace your levels—use it with your location tools (e.g., Volume Profile v3.2 and Anchored VWAP). It simply keeps you out of entries taken at the wrong part of the swing or against weak momentum.
(When you add screenshots: image #1 should label each sub-line and the green/yellow/red background; image #2 can show CMF turning green at VAL + AVWAP before a rotation back to POC.)
What you’re seeing (and how to read it at a glance)
CMF draws five sub-lines around a zero line, plus a background color:
Cycle Oscillator (blue): where you are in the swing. Above zero ≈ cycle crest side; below zero ≈ trough side.
ROC % (purple): short-term price acceleration. Above zero = positive momentum; below zero = negative.
MACD Histogram (orange): classic impulse measure (fast–slow EMA gap). Above zero = bullish impulse.
EWO (cyan): Elliott Wave Oscillator (EMA fast – EMA slow). Above zero = trend tilt up.
RSI-MA (gray, plotted as RSI−50): smoothed RSI relative to 50. Above zero = buyers have the relative strength.
Background color = the filter result:
Green → bullish window: cycle favors longs and momentum/trend/RS confirm.
Red → bearish window: mirror logic.
Yellow → neutral: at least one piece disagrees—do less, or wait for alignment.
For new traders: Every sub-line crossing above/below zero is a yes/no vote. Green happens only when all bullish checks are true; red when all bearish checks are true.
How CMF is built (plain-English version)
Cycle (DPO-style): CMF subtracts a displaced SMA from price to remove trend and expose the swing. Below 0 = you’re on the dip side of the cycle; above 0 = rally side.
Momentum (ROC): percent change over roc_length bars; tells you if price is actually accelerating.
Impulse (MACD hist): measures push from fast vs slow EMAs.
Trend tilt (EWO): broader drift via two EMAs (fast/slow).
Participation bias (RSI-MA): smoothed RSI relative to 50 (plotted as RSI−50 so its zero line matches the others).
The signal rules are strict AND conditions:
Bullish = cycle < 0 and ROC > 0 and MACD hist > 0 and EWO > 0 and RSI-MA > 0.
Bearish = cycle > 0 and ROC < 0 and MACD hist < 0 and EWO < 0 and RSI-MA < 0.
Otherwise Neutral.
This strictness is deliberate: it cuts a lot of low-quality entries.
Using CMF on any timeframe
The framework is the same—only your anchors/targets change as you zoom.
Scalping (1–5m)
Where: VP v3.2 VAL/VAH/LVNs or Session AVWAP.
When: take longs when CMF turns green on/after a dip to your level; shorts when it turns red on/after a pop into resistance.
Skip: yellow reads in the middle of the range; that’s chop.
Tip: on very fast pairs, require two consecutive green/red bars before entry.
Intraday (15m–1H)
Use CMF green to time pullbacks to AVWAP or VA edges in the trend direction.
In balance days, wait for CMF color + level alignment to fade back to POC.
If CMF flips yellow after entry, tighten risk; if it flips against you, consider exiting early.
Swing (2H–4H)
Treat first green after a higher-timeframe pullback to Weekly AVWAP or composite VAL as your A-setup.
If CMF stays green through the first pullback, consider adding; the opposite for red in downtrends.
Position (1D–1W)
Fewer, bigger decisions: CMF green at Monthly/Quarterly AVWAP or at composite VAL suggests rotation toward POC/HVNs; CMF red at VAH suggests mean-reversion lower.
If CMF can’t turn green/red at key retests, that’s valuable: the level likely won’t hold.
Entries, exits, and risk (simple rules)
Entry: trade at a level when CMF just flips to your side (green for longs / red for shorts).
Invalidation: if CMF reverts to yellow immediately, it’s a warning; if it flips to the opposite color, that’s your soft stop condition—tighten or exit unless higher-timeframe context argues otherwise.
Targets: use Volume Profile v3.2 (POC/HVNs) and AVWAP (mean) for logical destinations.
Don’t use CMF alone for stops; place them beyond the level or structure.
Settings that actually matter (and how to tune them)
Cycle Length (default 20): swing detection.
Shorter (10–14): quicker flips, better for scalps.
Longer (30–40): steadier cycle for swings/position.
ROC Length (default 10): momentum lookback.
Shorter: earlier yes/no, more noise.
Longer: slower, more selective.
MACD Fast/Slow (5/13) & EWO Fast/Slow (5/35): impulse and drift.
Increase slow values to calm false flips; decrease fast to react sooner.
RSI Length (14) & Smoothing (5): participation tilt.
Reduce smoothing for faster confirmation; increase to avoid whips.
Background on/off: keep it on while learning; once you’re comfortable, you can hide the background and read the lines against zero.
Tuning tip: If you trade only a few coins, optimize Cycle and ROC first; leave MACD/EWO defaults. Then decide how strict you want RSI (try RSI smoothing = 3 for faster reads).
What to look for (pattern cheatsheet)
Green at a dip-level (VAL/AVWAP) → rotate toward POC/HVN.
Red at a pop-level (VAH/AVWAP) → rotate down toward POC/HVN.
Color holds through the retest → continuation is more likely.
Color flips against the breakout → watch for failed break and reclaim.
Only one line disagrees (e.g., ROC < 0 while others > 0) → expect slower follow-through; consider waiting one bar.
Combining CMF with other tools
Volume Profile v3.2 :
Use VAH/VAL/POC/LVNs for where. CMF answers when.
Green at VAL → mean-reversion long to POC.
Red at VAH → fade to POC.
LVN breaks with green often travel quickly to the next HVN.
Anchored VWAP :
Reclaim of AVWAP + CMF turns green → higher-quality long; rejection + red → cleaner short.
Weekly AVWAP + CMF color is a reliable swing compass.
Cumulative Volume Delta v1 (CVDv1):
CMF says “now”, CVDv1 says “how good”.
Prefer CMF green when CVDv1 Alignment = OK, Imbalance strong, Absorption ≠ red.
If CMF flips green but CVDv1 shows Absorption (red), do not chase; look for a reclaim instead.
Common pitfalls CMF helps you avoid
Buying high in the cycle: CMF keeps longs to when the cycle is on the dip side and momentum/trend agree.
Forcing trades on yellow: yellow is your do-less mode—wait for alignment.
Ignoring flow at levels: CMF gives the window, but quality still matters; confirm with CVDv1.
Practical defaults to start with
Cycle 20 | ROC 10 | MACD 5/13 | EWO 5/35 | RSI 14 (smooth 5)
Works out of the box on 15m–4H.
For scalps, try Cycle 14 / ROC 7–9 / RSI smooth 3.
For daily swings, Cycle 30–34 / ROC 12–14.
Alerts (what they tell you)
Bullish Signal: CMF turned green (all bullish checks passed). Use it as a heads-up; still anchor the entry to VP/AVWAP.
Bearish Signal: CMF turned red. Same rule: wait for the level.
Open source & disclaimer
This indicator is published open source so traders can learn, tweak, and build rules they trust. Tools guide decisions; risk management decides outcomes.
Disclaimer — Not Financial Advice.
The “Cycle Momentum Filter ” indicator and this description are provided for educational purposes only and do not constitute financial or investment advice. Trading involves risk, including possible loss of capital. makes no warranties and assumes no responsibility for any trading decisions or outcomes resulting from the use of this script. Past performance is not indicative of future results.

Directional Indicator Crossovers [JopAlgo]Directional Indicator Crossovers — read trend intent at a glance, on any timeframe
Most traders ask two questions before they click: who’s in control right now and is control getting stronger or weaker?
The Directional Indicator (DI) answers the first one cleanly. +DI tracks upward directional movement; –DI tracks downward directional movement. When +DI crosses above –DI, buyers have the initiative; when –DI crosses above +DI, sellers do. DI Xover focuses on that simple, tradeable signal—the crossover—and keeps the pane uncluttered so you can layer it with your location/flow tools.
(If you add screenshots: image #1 can label +DI, –DI and a bullish crossover; image #2 can show a failed crossover in chop next to a successful one at a strong level.)
What you’re seeing (and how it’s built)
This indicator plots two lines in a separate pane:
+DI (green): smoothed positive directional movement.
–DI (red): smoothed negative directional movement.
Under the hood (length = 14 by default):
It measures how much today’s high exceeded yesterday’s high (up move) and how much today’s low fell below yesterday’s low (down move).
It keeps only the dominant side each bar (if up > down and up > 0 → up counts; vice-versa for down).
It normalizes by True Range (so moves are scaled by volatility) and smooths with RMA (so you don’t get jitter).
It raises alerts when +DI crosses above –DI (bullish) or –DI crosses above +DI (bearish).
How to read it, fast:
Cross up = buyers just took initiative.
Cross down = sellers just took initiative.
Wider distance between the lines = stronger control.
Lines braided/tight = balance/chop → expect more fake crosses.
DI is about directional control. It doesn’t tell you where to trade—that’s your location (e.g., Volume Profile, AVWAP). Use DI as a timing/confirmation layer, not as a standalone level generator.
Using DI Crossovers on any timeframe
The framework doesn’t change; only your expectations do as you zoom.
Scalping (1–5m)
Treat crossovers as triggers at levels. If price is tagging VAL/VAH/LVN (from Volume Profile v3.2) or Anchored VWAP, a fresh +DI cross up is your green light for a quick long; –DI cross up flips that logic for shorts.
Avoid taking every crossover mid-range—wait for location first.
In fast tape, require the lines to separate for 1–2 bars after the cross before you click.
Intraday (15m–1H)
In trend days, the first pullback into your level (POC/VA boundary/AVWAP) that prints a fresh +DI cross up is often the cleanest add/entry.
In balance days, fade DI crosses at edges back to POC—only if your flow tool isn’t screaming absorption against you.
Swing (2H–4H)
Look for confluence: at Weekly AVWAP or composite VAL/VAH, a DI crossover that stays separated for several bars is a solid momentum confirmation.
Failed crossover (lines recross quickly) near a level is a useful fail signal—expect a move back into value.
Position (1D–1W)
Use fewer, bigger signals: a weekly DI cross at Monthly/Quarterly AVWAP or at composite value edges marks a regime change.
Add on pullbacks when the controlling DI stays dominant (distance holds or widens).
Entries, exits, and risk (simple rules)
Entry (with level): wait for price to reach your level (e.g., VAL/VAH or AVWAP), then take the trade with the DI cross in that direction.
Filter: skip crosses when the two lines are braided (tiny separation) unless you’re trading a tight scalp with strict risk.
Exit / reduce: if your trade was based on a bullish cross, consider reducing when –DI recaptures +DI or the lines flatten at your target HVN/POC.
Stops: put them beyond the level (not just on a DI recross), but treat a fast recross as a warning to tighten.
Settings that actually matter (and how to tune them)
DI Length (default 14):
Shorter (7–10) = faster signals, more noise (good for scalps with filters).
Longer (20–30) = fewer but stronger signals (good for swing/position).
If you often see flip-flops, lengthen the setting or take crosses only at VP/AVWAP levels.
Pro tip: Define a minimum separation rule for yourself (e.g., after a cross, require the gap between +DI and –DI to increase on the next bar). You don’t need extra code for this—just enforce it visually.
What to look for (pattern cheatsheet)
Cross + hold at a level: The lines cross at your level and keep separating → high-quality entry in that direction.
Sneaky fail: Cross, then immediate recross back → treat it as a fade signal back into value (especially near VAH/VAL).
Strength confirmation: After a breakout, +DI stays above –DI on pullbacks → trend is healthy; buy dips at AVWAP/POC.
Pre-move tell: DI lines unbraid and begin diverging before price leaves a range; wait for location + trigger.
Combining DI Xover with other tools
Cumulative Volume Delta v1 (CVDv1):
Use DI for direction, and CVDv1 for quality. A bullish DI cross with ALIGN OK + Imbalance strong + no Absorption is a far better long than DI alone.
If DI crosses up but CVDv1 flags Absorption (red), don’t chase—look for the fail/reclaim instead.
Volume Profile v3.2 :
Let VP choose the battleground (POC/VAH/VAL/LVNs). Take the DI crossover at those references.
Classic: bearish DI cross at VAH → fade toward POC; bullish DI cross at VAL → rotate to POC—assuming CVDv1 isn’t vetoing with Absorption.
Anchored VWAP :
Treat reclaims/rejections of AVWAP as the location and DI cross as the trigger.
Example: price reclaims Weekly AVWAP, then on the next pullback, a +DI cross up confirms the add.
Common pitfalls this helps you avoid
Trading crosses in the middle of nowhere. DI is a trigger, not a level; wait for VP/AVWAP.
Chasing every wiggle. When the lines are braided, you’re likely in balance—expect fake crosses.
Ignoring flow. A DI cross against CVDv1 Absorption is often a trap; quality > quantity.
Practical defaults to start with
Length: 14
Timeframes: Works out of the box on 15m–4H. For 1–5m scalps try 10–12; for daily/weekly swings try 20–30.
Process: Only act on crosses at levels (VP v3.2 / Anchored VWAP), and prefer those where CVDv1 says ALIGN OK and no Absorption.
Alerts (what they tell you)
Bullish DI Crossover: +DI crossed above –DI → buyers just took initiative. Look to your chart for location and CVDv1 quality before entering.
Bearish DI Crossover: –DI crossed above +DI → sellers took initiative. Same rule: confirm at a level with flow.
Open source & disclaimer
This indicator is published open source so traders can learn, adapt, and build rules they trust. No tool guarantees outcomes; risk management remains essential.
Disclaimer — Not Financial Advice.
The “Directional Indicator Crossovers ” indicator and this description are provided for educational purposes only and do not constitute financial or investment advice. Trading involves risk, including possible loss of capital. makes no warranties and assumes no responsibility for any trading decisions or outcomes resulting from the use of this script. Past performance is not indicative of future results.

SM OTC style Supply/Demand Zones Lite+//@version=6
indicator("OTC SD MTF Lite+", "OTCSDmtf+", overlay=true, max_boxes_count=200, max_labels_count=200)
// ================= Inputs =================
useH4 = input.bool(true, "Show 4H zones")
useD1 = input.bool(true, "Show 1D zones")
useW1 = input.bool(true, "Show 1W zones")
useM1 = input.bool(false, "Show 1M zones")
baseLen = input.int(2, "Base length (HTF bars)", 1, 5)
wickPctMax = input.float(35.0, "Max wick % in base", 0, 100)
impulseX = input.float(1.5, "Departure body vs ATR (x)", 0.5, 5.0)
atrLen = input.int(14, "ATR length (HTF)")
extendBars = input.int(2000, "Extend bars on chart", 200, 10000)
maxPerTF = input.int(12, "Max zones per TF", 3, 30)
showLegend = input.bool(true, "Show tiny legend (4H/1D/1W/1M)")
onlyNearest = input.bool(false, "Show ONLY nearest zone above/below")
hideOverlapTF = input.bool(true, "Hide overlapping zones within each TF (keep newest)")
showNearestLabels = input.bool(false, "Show distance labels to nearest above/below")
// --- Hard cap for future drawing with xloc.bar_index ---
FUTURE_CAP = 500
// Colors (Demand hues per TF). Supply uses red for contrast.
colH4 = color.new(color.teal, 78)
colD1 = color.new(color.blue, 78)
colW1 = color.new(color.orange, 78)
colM1 = color.new(color.purple, 78)
colSup= color.new(color.red, 78)
// ================= Helpers =================
wickiness(h, l, o, c) =>
rng = math.max(h - l, syminfo.mintick)
topW = h - math.max(o, c)
botW = math.min(o, c) - l
100.0 * (topW + botW) / rng
// Returns: (dTrig, dProx, dDist, sTrig, sProx, sDist)
f_htfSignals(baseBars, wickMax, xImpulse, aLen) =>
float _o = open
float _h = high
float _l = low
float _c = close
float _atr = ta.atr(aLen)
bool ok = true
for i = 1 to baseBars
ok := ok and (wickiness(_h , _l , _o , _c ) <= wickMax)
bool bullDepart = _c > _o and (_c - _o) > xImpulse * _atr
bool bearDepart = _c < _o and (_o - _c) > xImpulse * _atr
float dTrig = 0.0
float dProx = na
float dDist = na
float sTrig = 0.0
float sProx = na
float sDist = na
if ok and bullDepart
float hi = ta.highest(_h, baseBars)
float lo = ta.lowest(_l, baseBars)
dTrig := 1.0
dProx := lo
dDist := hi
if ok and bearDepart
float hi2 = ta.highest(_h, baseBars)
float lo2 = ta.lowest(_l, baseBars)
sTrig := 1.0
sProx := hi2
sDist := lo2
// ================= Pull HTF signals =================
= request.security(syminfo.tickerid, "240", f_htfSignals(baseLen, wickPctMax, impulseX, atrLen))
= request.security(syminfo.tickerid, "D", f_htfSignals(baseLen, wickPctMax, impulseX, atrLen))
= request.security(syminfo.tickerid, "W", f_htfSignals(baseLen, wickPctMax, impulseX, atrLen))
= request.security(syminfo.tickerid, "M", f_htfSignals(baseLen, wickPctMax, impulseX, atrLen))
// ================= Storage per TF =================
var zH4 = array.new_box()
var aH4 = array.new_bool()
var lH4 = array.new_label()
var sH4 = array.new_int() // 1 = Demand, -1 = Supply
var zD1 = array.new_box()
var aD1 = array.new_bool()
var lD1 = array.new_label()
var sD1 = array.new_int()
var zW1 = array.new_box()
var aW1 = array.new_bool()
var lW1 = array.new_label()
var sW1 = array.new_int()
var zM1 = array.new_box()
var aM1 = array.new_bool()
var lM1 = array.new_label()
var sM1 = array.new_int()
// ================= Overlap utils =================
overlap(topA, botA, topB, botB) =>
not (topA < botB or botA > topB)
purgeOverlaps(arrB, arrA, arrL, newTop, newBot) =>
if hideOverlapTF and array.size(arrB) > 0
for i = 0 to array.size(arrB) - 1
if array.get(arrA, i)
box bOld = array.get(arrB, i)
float t = box.get_top(bOld)
float btm = box.get_bottom(bOld)
if overlap(newTop, newBot, t, btm)
box.delete(bOld)
label.delete(array.get(arrL, i))
array.set(arrA, i, false)
// ================= Add zone =================
addZone(arrB, arrA, arrL, arrS, topV, botV, baseColor, isDemand) =>
purgeOverlaps(arrB, arrA, arrL, topV, botV)
int leftX = bar_index - 1
int rightX = bar_index + math.min(extendBars, FUTURE_CAP) // respect +500 cap
box b = box.new(leftX, topV, rightX, botV, xloc=xloc.bar_index, bgcolor=baseColor, border_color=color.new(color.black, 0))
float ly = isDemand == 1 ? topV : botV
st = isDemand == 1 ? label.style_label_down : label.style_label_up
string tagTxt = isDemand == 1 ? "Demand" : "Supply"
label l = label.new(leftX, ly, tagTxt, xloc=xloc.bar_index, style=st, textcolor=color.white, color=color.new(color.black, 0), size=size.tiny)
array.push(arrB, b)
array.push(arrA, true)
array.push(arrL, l)
array.push(arrS, isDemand)
if array.size(arrB) > maxPerTF
box.delete(array.shift(arrB))
array.shift(arrA)
label.delete(array.shift(arrL))
array.shift(arrS)
// ================= Maintain / Invalidate =================
extendAll(arrB, arrA) =>
if array.size(arrB) > 0
for i = 0 to array.size(arrB) - 1
if array.get(arrA, i)
box.set_right(array.get(arrB, i), bar_index + math.min(extendBars, FUTURE_CAP)) // respect +500 cap
invalidate(arrB, arrA, arrL) =>
if array.size(arrB) > 0
for i = 0 to array.size(arrB) - 1
if array.get(arrA, i)
box b = array.get(arrB, i)
float t = box.get_top(b)
float btm = box.get_bottom(b)
// Close outside band → remove
if close > t or close < btm
box.delete(b)
label.delete(array.get(arrL, i))
array.set(arrA, i, false)
// ================= New HTF bar flags (strict booleans) =================
int chH4 = ta.change(time("240"))
int chD1 = ta.change(time("D"))
int chW1 = ta.change(time("W"))
int chM1 = ta.change(time("M"))
bool newBarH4 = useH4 and (not na(chH4)) and (chH4 != 0)
bool newBarD1 = useD1 and (not na(chD1)) and (chD1 != 0)
bool newBarW1 = useW1 and (not na(chW1)) and (chW1 != 0)
bool newBarM1 = useM1 and (not na(chM1)) and (chM1 != 0)
// ================= Create zones on new HTF bar =================
if newBarH4
if d4t > 0 and not na(d4p) and not na(d4d)
addZone(zH4, aH4, lH4, sH4, d4d, d4p, colH4, 1)
if s4t > 0 and not na(s4p) and not na(s4d)
addZone(zH4, aH4, lH4, sH4, s4p, s4d, colSup, -1)
if newBarD1
if d1t > 0 and not na(d1p) and not na(d1d)
addZone(zD1, aD1, lD1, sD1, d1d, d1p, colD1, 1)
if s1t > 0 and not na(s1p) and not na(s1d)
addZone(zD1, aD1, lD1, sD1, s1p, s1d, colSup, -1)
if newBarW1
if w1t > 0 and not na(w1p) and not na(w1d)
addZone(zW1, aW1, lW1, sW1, w1d, w1p, colW1, 1)
if swt > 0 and not na(swp) and not na(swd)
addZone(zW1, aW1, lW1, sW1, swp, swd, colSup, -1)
if newBarM1
if m1t > 0 and not na(m1p) and not na(m1d)
addZone(zM1, aM1, lM1, sM1, m1d, m1p, colM1, 1)
if smt > 0 and not na(smp) and not na(smd)
addZone(zM1, aM1, lM1, sM1, smp, smd, colSup, -1)
// ================= Maintain & Invalidate (every bar) =================
extendAll(zH4, aH4)
extendAll(zD1, aD1)
extendAll(zW1, aW1)
extendAll(zM1, aM1)
invalidate(zH4, aH4, lH4)
invalidate(zD1, aD1, lD1)
invalidate(zW1, aW1, lW1)
invalidate(zM1, aM1, lM1)
// ================= Nearest across all TFs =================
tfNearest(arrB, arrA) =>
int upIdx = -1
int dnIdx = -1
float upDist = 1e10
float dnDist = 1e10
float upBtm = na
float dnTop = na
if array.size(arrB) > 0
for i = 0 to array.size(arrB) - 1
if array.get(arrA, i)
box b = array.get(arrB, i)
float t = box.get_top(b)
float btm = box.get_bottom(b)
if btm >= close
float d = btm - close
if d < upDist
upDist := d
upIdx := i
upBtm := btm
if t <= close
float d2 = close - t
if d2 < dnDist
dnDist := d2
dnIdx := i
dnTop := t
= tfNearest(zH4, aH4)
= tfNearest(zD1, aD1)
= tfNearest(zW1, aW1)
= tfNearest(zM1, aM1)
float upBest = 1e10, dnBest = 1e10
int upArr = -1, upIdxSel = -1, dnArr = -1, dnIdxSel = -1
color upColor = color.new(color.white, 100), dnColor = color.new(color.white, 100)
if (not na(uh4y)) and uh4d < upBest
upBest := uh4d, upArr := 0, upIdxSel := uh4i, upColor := colH4
if (not na(ud1y)) and ud1d < upBest
upBest := ud1d, upArr := 1, upIdxSel := ud1i, upColor := colD1
if (not na(uw1y)) and uw1d < upBest
upBest := uw1d, upArr := 2, upIdxSel := uw1i, upColor := colW1
if (not na(um1y)) and um1d < upBest
upBest := um1d, upArr := 3, upIdxSel := um1i, upColor := colM1
if (not na(dh4y)) and dh4d < dnBest
dnBest := dh4d, dnArr := 0, dnIdxSel := dh4i, dnColor := colH4
if (not na(dd1y)) and dd1d < dnBest
dnBest := dd1d, dnArr := 1, dnIdxSel := dd1i, dnColor := colD1
if (not na(dw1y)) and dw1d < dnBest
dnBest := dw1d, dnArr := 2, dnIdxSel := dw1i, dnColor := colW1
if (not na(dm1y)) and dm1d < dnBest
dnBest := dm1d, dnArr := 3, dnIdxSel := dm1i, dnColor := colM1
// ================= Nearest-only visibility (optional) =================
hideAll(arrB, arrA) =>
if array.size(arrB) > 0
for i = 0 to array.size(arrB) - 1
if array.get(arrA, i)
box.set_bgcolor(array.get(arrB, i), color.new(color.white, 100))
box.set_border_color(array.get(arrB, i), color.new(color.white, 100))
showOne(arrB, arrA, arrS, idx, demColor) =>
if idx >= 0 and idx < array.size(arrB)
if array.get(arrA, idx)
bool isDemand = array.get(arrS, idx) == 1
color c = isDemand ? demColor : colSup
box.set_bgcolor(array.get(arrB, idx), c)
box.set_border_color(array.get(arrB, idx), color.new(color.black, 0))
if onlyNearest
hideAll(zH4, aH4), hideAll(zD1, aD1), hideAll(zW1, aW1), hideAll(zM1, aM1)
if upArr == 0
showOne(zH4, aH4, sH4, upIdxSel, upColor)
if upArr == 1
showOne(zD1, aD1, sD1, upIdxSel, upColor)
if upArr == 2
showOne(zW1, aW1, sW1, upIdxSel, upColor)
if upArr == 3
showOne(zM1, aM1, sM1, upIdxSel, upColor)
if dnArr == 0
showOne(zH4, aH4, sH4, dnIdxSel, dnColor)
if dnArr == 1
showOne(zD1, aD1, sD1, dnIdxSel, dnColor)
if dnArr == 2
showOne(zW1, aW1, sW1, dnIdxSel, dnColor)
if dnArr == 3
showOne(zM1, aM1, sM1, dnIdxSel, dnColor)
// ================= Nearest distance labels (optional) =================
var label nearUp = na
var label nearDn = na
makeNearLabel(y, txt) =>
label.new(bar_index, y, txt, xloc=xloc.bar_index, style=label.style_label_left, color=color.new(color.black, 0), textcolor=color.white, size=size.tiny)
if showNearestLabels
if not na(nearUp)
label.delete(nearUp)
if not na(nearDn)
label.delete(nearDn)
if upArr != -1
box bUp = upArr == 0 ? array.get(zH4, upIdxSel) : upArr == 1 ? array.get(zD1, upIdxSel) : upArr == 2 ? array.get(zW1, upIdxSel) : array.get(zM1, upIdxSel)
float upBtm = box.get_bottom(bUp)
float pctUp = math.round(10000.0 * (upBtm - close) / close) / 100.0
nearUp := makeNearLabel(upBtm, "Nearest Above ~ " + str.tostring(pctUp) + "%")
if dnArr != -1
box bDn = dnArr == 0 ? array.get(zH4, dnIdxSel) : dnArr == 1 ? array.get(zD1, dnIdxSel) : dnArr == 2 ? array.get(zW1, dnIdxSel) : array.get(zM1, dnIdxSel)
float dnTop = box.get_top(bDn)
float pctDn = math.round(10000.0 * (close - dnTop) / close) / 100.0
nearDn := makeNearLabel(dnTop, "Nearest Below ~ " + str.tostring(pctDn) + "%")
// ================= Tiny legend (dots) =================
var table legend = na
if showLegend and na(legend)
legend := table.new(position.top_left, 4, 1)
if showLegend and not na(legend)
table.cell(legend, 0, 0, "● 4H", text_color=color.white, bgcolor=color.new(color.black, 0))
table.cell(legend, 1, 0, "● 1D", text_color=color.white, bgcolor=color.new(color.black, 0))
table.cell(legend, 2, 0, "● 1W", text_color=color.white, bgcolor=color.new(color.black, 0))
table.cell(legend, 3, 0, "● 1M", text_color=color.white, bgcolor=color.new(color.black, 0))
table.cell_set_bgcolor(legend, 0, 0, color.new(color.teal, 70))
table.cell_set_bgcolor(legend, 1, 0, color.new(color.blue, 70))
table.cell_set_bgcolor(legend, 2, 0, color.new(color.orange, 70))
table.cell_set_bgcolor(legend, 3, 0, color.new(color.purple, 70))

RTH Bias by @traderprimezTired of guessing the intraday direction? The RTH Bias indicator provides a powerful, data-driven statistical edge by analyzing the behavior of price after the initial Regular Trading Hours (RTH) range is set.
It meticulously tracks historical outcomes to show you the most probable "story" for the rest of the trading day.
This tool is designed for day traders of US indices, stocks, and other assets most active during the New York session. It moves beyond simple "opening range breakout" strategies by classifying each day into one of six distinct scenarios, giving you a much deeper insight into the day's potential character.
Core Concept
The opening period of the RTH session (e.g., the first one, two, or three hours) is dominated by high volume and institutional activity. The high and low established during this time often act as a critical pivot or springboard for the remainder of the day.
This indicator captures that initial range and then analyzes thousands of historical days to answer the key question: "Once the opening range is set, what happens next?" Does price tend to break out and trend? Does it fake out in one direction and reverse? Or does it stay trapped? The dashboard provides these probabilities at a glance.
Key Features
Choose the range that best fits your trading style and the asset you're trading:
09:30 - 10:30 (Micro): The classic, volatile first hour.
09:30 - 11:30 (Major): A broader range capturing the morning momentum.
09:30 - 12:30 (Macro): The full morning session, often defining the entire day's extremes.
📊 The Statistical Dashboard
This is the heart of the indicator. It provides a complete statistical breakdown of historical price action:
Scenario: The name of the price action profile.
Distribution: A visual bar chart showing the relative frequency of each scenario.
Count: The raw number of times each scenario has occurred over the lookback period.
Contribution: The percentage probability of each scenario occurring.
🎲 The Six Scenarios Explained
The indicator classifies each day's price action into one of these profiles:
↑ High, then ↓ Low (XAMD): A classic "stop hunt high, then sell-off." Price breaks the range high first, luring in buyers, before reversing to take the range low.
↓ Low, then ↑ High (XAMD): A classic "stop hunt low, then rally." Price breaks the range low first, stopping out sellers, before reversing to take the range high.
One-Sided Breakout (AMDX): A strong trend day. Price breaks only one side of the range and continues in that direction without ever violating the other side.
Search & Destroy (S&D): A volatile, choppy day. Price takes one side, reverses to take the other, and then reverses again.
No Breakout (Inside Day): A consolidation day. Price fails to break either the high or the low of the opening range.
🟩 On-Chart Bias Box
A simple visual aid that tracks the session in real-time:
Neutral (Gray): During Session 1, as the range is forming.
Bullish (Green): The Session 1 high has been broken.
Bearish (Red): The Session 1 low has been broken.
Both (Orange): Both the high and low have been broken (XAMD or S&D profile).
🛡️ RTH Guard Logic
This is a crucial feature for accuracy. The indicator locks in the day's scenario at the RTH close (e.g., 4 PM ET). This ensures that post-market (ETH) price action does not corrupt the historical statistics, giving you clean, reliable data based purely on regular trading hours.
🔔 Custom Alerts
Enable the "First Breakout" alert to be notified the moment the opening range is breached, so you don't have to watch the chart all day.
How to Use in Your Trading
This indicator does not give buy/sell signals. It provides a statistical framework to build a high-probability trading hypothesis for the day.
Select Your Range: In the settings, choose the opening range (Micro, Major, or Macro) you want to analyze.
Wait for the Range to Form: Let the neutral box fully form on your chart.
Analyze the Dashboard: Once the range is set, look at the "Contribution" column. Identify the scenario with the highest probability.
Form a Hypothesis: Build your trade idea around the most likely scenario.
Execute and Manage: You would wait for the box to turn red (low is broken). Instead of shorting, you would look for bullish confirmation (e.g., a market structure shift on a lower timeframe) to enter a long position, with the opening range high as a logical target.
Disclaimer: This indicator is a tool for analysis and probability assessment, not a standalone trading system. It should be used in conjunction with your own strategy and risk management. Past performance is not indicative of future results.

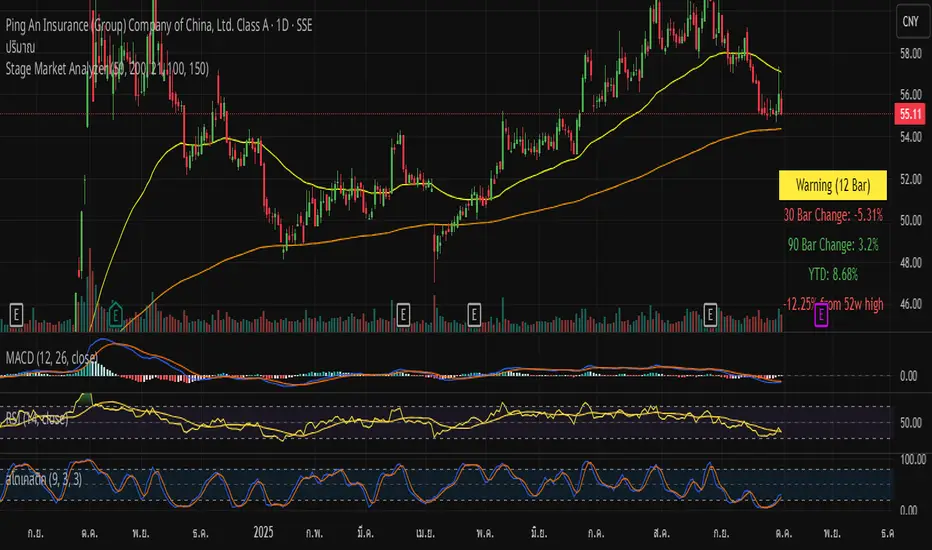
Stage Market AnalyzerStage Market Analyzer – User Guide
Overview:
The “Stage Market Analyzer” indicator is a comprehensive market analysis tool that identifies the current market phase (6 stages) using multiple EMAs (Exponential Moving Averages) and provides key performance metrics including 52-week high, YTD change, and recent price changes. This indicator is displayed on the chart with a visual table and plotted EMA lines for easy trend analysis.
Market Stages
-The indicator classifies the market into six stages based on the position of price relative to the fast and slow EMAs:
Recovery:
-Price above the fast EMA, but below the slow EMA.
-Slow EMA is above the fast EMA.
-ndicates a market recovering from a downtrend.
Accumulation:
-Price above both EMAs, slow EMA above fast EMA.
-Suggests accumulation phase, usually after a downtrend.
Bull Market:
-Price above both EMAs, fast EMA above slow EMA.
-Represents strong uptrend.
Warning:
-Price below both EMAs, fast EMA above slow EMA.
-Signals caution; potential weakening trend.
Distribution:
-Price below fast EMA, slow EMA below fast EMA.
-Market may be topping or preparing to reverse.
Bear Market:
-Price below both EMAs, slow EMA above fast EMA.
-Strong downtrend confirmed.
The indicator counts consecutive bars within the same stage and displays this as “Stage Name (X Bar)” in the table.
EMA Settings
-Fast EMA: Default 50 bars.
-Slow EMA: Default 200 bars.
Additional EMAs: EMA1 (21), EMA2 (100), EMA3 (150) – optional display.
Users can customize all EMA lengths and choose which EMAs to display.
The plotted EMAs help visualize trends, crossovers, and market momentum.
Performance Metrics
30-Bar & 90-Bar Price Change:
Displays the percentage change over the last 30 or 90 bars.
Positive change in green, negative in red.
YTD Change (Year-to-Date):
-Calculated from the first trading bar of the current year to current price.
-Reflects overall market performance for the current year.
52-Week High:
-Shows the percentage difference between current price and the highest price over the last 52 weeks.
-Adjusts automatically for the chart timeframe:
Daily: last 252 bars
Weekly: last 52 bars
Monthly: last 12 bars
Intraday: calculated based on bars per day × 252 trading days
Positive deviation is shown in green, negative in red.
Note: For non-daily charts, the calculation approximates a “year” based on available bars.
Table Display
Located at the bottom-right of the chart.
Columns:
Current Market Stage (with consecutive bar count)
30-Bar Change
90-Bar Change
YTD Change
52-Week High (optional)
Background colors indicate the stage for quick visual reference.
How to Use
Add the indicator to your chart.
Adjust EMAs to match your trading strategy.
Observe the table to understand:
Current market phase
Short-term and long-term performance metrics
Trend direction using plotted EMAs
Use the stage information together with other analysis (support/resistance, volume, etc.) to make informed trading decisions.
Notes & Recommendations
The indicator works best on daily charts for accurate 52-week high and YTD calculations.
For crypto or non-standard trading calendars, be aware that intraday data may approximate the “year” differently.
EMAs are customizable – experiment with different lengths to fit your preferred timeframe or trading style.
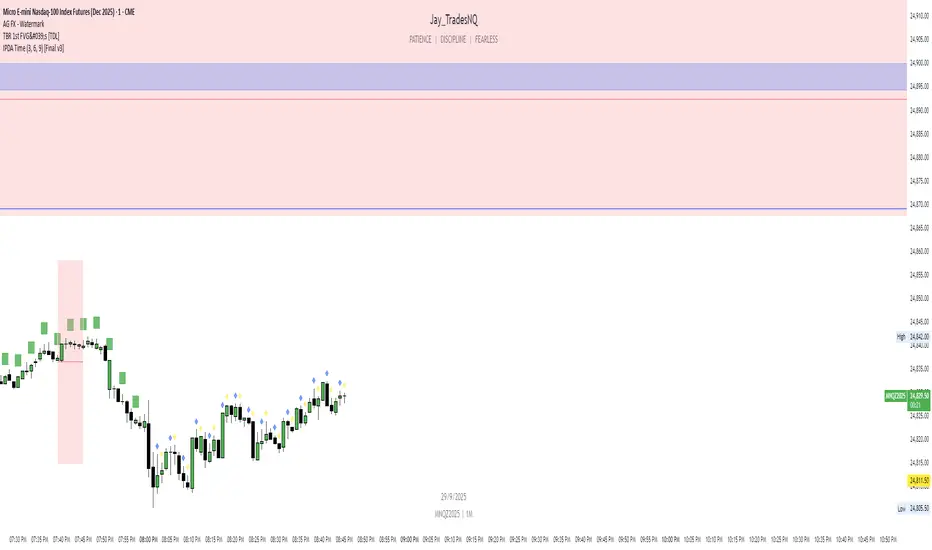
IPDA Time (3, 6, 9) [Final v3]This Pine Script code defines a custom TradingView indicator called "IPDA Time (3, 6, 9)". It is designed to identify specific bars on the chart where the digital root of the current time (hour and minute) equals 3, 6, or 9, which are numbers often associated with cycles and market timing concepts in trading.
1. What the Code Does
The script calculates two main time values based on a concept known as the Digital Root (also called the "Digital Sum").
The Digital Root Function
The core logic uses a custom function, getDigitalRoot(number), which calculates the digital root of any number. The digital root is the single digit obtained by an iterative process of summing the digits of a number, repeatedly until a single digit is reached (e.g., the digital root of 48 is 4+8=12→1+2=3).
Signal Calculations
The script extracts the individual digits from the current chart's hour and minute (h, m) and performs two distinct digital root calculations:
hourPlusMinuteValue (High Confluence Check): Calculates the digital root of the sum of all four digits (two from the hour, two from the minute).
minuteOnlyValue (Minute Check): Calculates the digital root of the sum of the two minute digits only.
Logic and Signal Generation
The code generates three types of signals based on whether these digital roots equal 3, 6, or 9:
High-Importance (Green Square): Generated when BOTH the "Hour + Minute" check (isHourPlusMinuteSignal) and the "Minute Only" check (isMinuteOnlySignal) are true.
Hour + Minute Only (Blue Diamond): Generated when ONLY the "Hour + Minute" check is true.
Minute Only (Yellow Diamond): Generated when ONLY the "Minute Only" check is true.
2. Visual Output on the Chart
The indicator visualizes these signals directly on the price chart:
Signal Type Shape (Style) Color Location Additional Effect
High-Importance Square (shape.square) Green Above Bar Changes the bar's color to green (with 75% transparency).
Hour + Minute Only Diamond (shape.diamond) Blue Above Bar N/A
Minute Only Diamond (shape.diamond) Yellow Above Bar N/A
Export to Sheets
The visual markers appear above the bar/candle that corresponds to the specific time criteria being met, highlighting moments the indicator's logic deems significant.
Tools
Multi-Timeframe MACD ConfluenceMulti-Timeframe MACD Confluence Indicator
This indicator plots Buy and Sell signals based on the confluence of MACD histogram direction across three different timeframes. When the MACD histogram is bullish (above zero) on all selected timeframes, a Buy signal is triggered. When it's bearish (below zero) on all, a Sell signal is shown.
🧠 Key Features:
Customizable timeframes (default: 5min, 15min, 1hr)
Uses traditional MACD: 12/26/9 EMA
Works on any asset or timeframe
Provides visual plot signals and built-in alerts
📈 This tool is ideal for traders who rely on multi-timeframe analysis to validate trend momentum before taking entries.

34 EMA Cross Alert (Once per sequence)This script is used when 5-12 EMA is above 34-50 EMA and if price corrects to 34-50 cloud and bounces i.e. price crosses below 34 EMA and then cross above 34 EMA, it will trigger alert.