Indicator Based Market Exposure (IBME)The Indicator Based Market Exposure (IBME) system was created by Big Wave Chartist as a way to navigate the markets using a confluence of three different signals to determine when the "internals" of the market are in your favor and how heavily invested to be at any point. The idea of the system is also to flash warning signs when the market internals are beginning to deteriorate so as to take a defensive stance. Of course this system can be strictly adhered to, or it can be incorporated into a more discretionary style of trading, and be combined with progressive exposure into (and out of) the market as positions gain (or lose) traction.
The IBME displays a straightforward action signal based on the combination of the 3 separate signals:
Green 🟢 Full size-longs permitted
Yellow 🟡 Pilot positions permitted
Red 🔴 No longs allowed
So let's get into the signals used:
McClellan Summation Index
Net New Highs/Lows
Net New Highs Crossover
McClellan Summation Index (MSI)
The McClellan Summation Index is a long-term version of the McClellan Oscillator, which is a market breadth indicator based on stock advances and declines. Interpretation is similar to that of the McClellan Oscillator, except that it is more suited to intermediate to major trends and related reversals. The McClellan Summation Index can be calculated as the sum of all the daily values of the McClellan Oscillator. This is used along with the 10-sma to watch for a crossover indicating an uptrend or downtrend beginning.
Net New Highs/Lows
This is the net number of stocks making 52-week highs or lows. For instance, if there are 60 new 52-week highs and 20 new 52-week lows, the net number will be 40 net new 52 week highs. This signal is particularly useful in gauging breadth.
Net New Highs Crossover
This is the description of NNHC from the original separate version of this indicator created by HikoStory: "Net New Highs can guide you to increase or decrease your exposure based on the current market health. They are calculated by subtracting the new highs from the new lows, based on all stocks of the...NASDAQ. A positive value shows that the market is doing good, since more stocks are making new highs compared to new lows. A negative value shows that the market is doing bad, since more stocks are making new lows compared to new highs. Combined with a moving average you can see crossovers that can warn you early when there is a change in the current market health."
The default index for the IBME is the Nasdaq.
The IBME is meant to be used on a daily time frame chart, therefore the signal will only show on a daily time frame chart.
Display options include:
Show/hide individual signals
Table background/font color
Table size/placement
Recherche dans les scripts pour "芯片龙头etf"

ATR + Momentum Shifts w/Take ProfitThis script is a technical analysis indicator designed to assist in identifying potential entry points and setting take profit levels in trading. It combines the Average True Range (ATR) indicator, momentum shifts, and customizable take profit levels to provide insights into potential market movements.
Differences from Currently Published Ones:
This script is unique due to its use of a combination of elements:
ATR and Momentum: The script combines the ATR indicator to provide dynamic support and resistance levels with the momentum indicator to identify shifts in the underlying momentum.
Customizable Take Profit Levels: It offers the ability to set take profit levels based on customizable multipliers of the ATR, helping traders manage potential profits.
How to Use:
ATR Bands: The script plots upper and lower ATR bands as potential dynamic support and resistance levels.
Shift Arrows: Arrows are plotted below bars for potential long entry opportunities (green triangle) and above bars for potential short entry opportunities (yellow triangle).
Take Profit Levels: The script also plots take profit levels both above and below the source price based on the ATR multipliers set in the inputs.
Markets and Conditions:
This script can be used across various financial markets, including stocks, forex, commodities, and cryptocurrencies. It's most effective in trending markets where momentum shifts can signal potential reversals or continuation of trends. Traders should consider the following conditions:
Trend Confirmation: Look for momentum shifts in the direction of the prevailing trend for higher probability setups.
Volatility: Higher volatility can amplify ATR movements and subsequently affect the placement of ATR bands and take profit levels.
Risk Management: Always implement proper risk management strategies to protect your capital.
Additional Considerations:
Customization: Traders can adjust input parameters like ATR length, momentum length, and take profit multipliers to match their trading style and market conditions.
Combining with Other Indicators: Consider using this indicator in conjunction with other technical indicators or chart patterns for confirmation.

Feigenbaum ProjectionsThe theory of price delivery per Feigenbaum projections is credited to TRSTNGLRD, this indicator aims to aid traders from all backgrounds to utilize projections for determination of potential future price moves.
What follows is the simplest description of where to anchor the projection:
As price delivers and clears higher high (buy side liquidity) then reverses to clear most recent low (sell side liquidity), this becomes the anchorage point for the Feigenbaum projection and is referred to as perturbation. The start and end points for the projection should be only those candle bodies that wholly exist within the range within the high and low that were cleared by the perturbation, this range of candle bodies is to be considered the "initial condition". Structure that appears as a broadening formation is one such price delivery occurrence that can be utilized with these projections.
The projected zones are all pre-configured by TRSTNs specifications per Feigenbaum but can be adjusted if the need arises.
Price is expected to expand beyond the initial condition and into the negative and positive target zones, accuracy diminishes with further expansion and reevaluation should occur when a new perturbation is discovered.
It's recommended to explore various timeframes to find a perturbation by which to anchor the next Feigenbaum projection.
I'll do my best to update this description with time as more discoveries are made and TRSTNGLRD provides more guidance and feedback on this indicator.

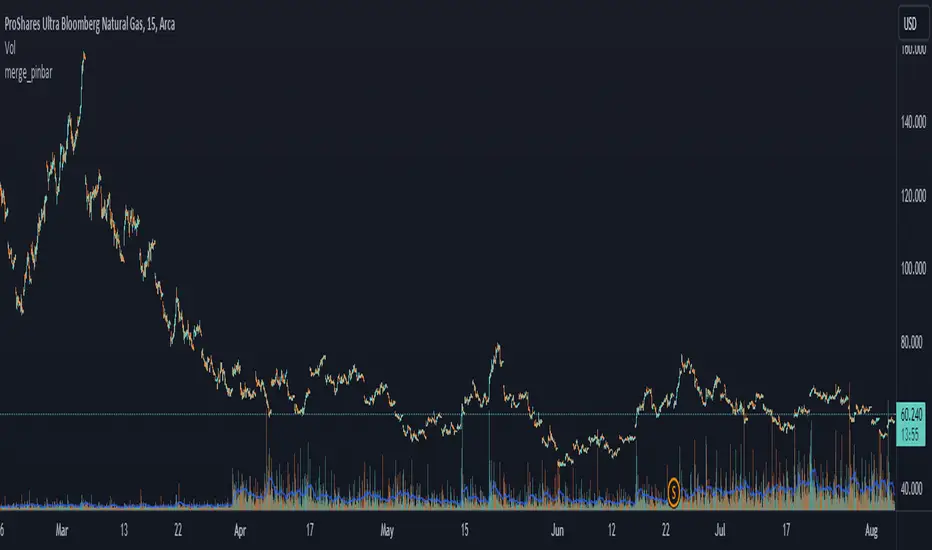
merge_pinbar_modifiedLibrary "merge_pinbar"
Published by @dandrideng
Modified by @RpNm1337
merge_pinbar: merge bars and check whether the bar is a pinbar
merge_pinbar(period, max_bars)
merge_pinbar: merge bars and check whether the bar is a pinbar
Parameters:
period (simple int)
max_bars (simple int)
Returns: array:
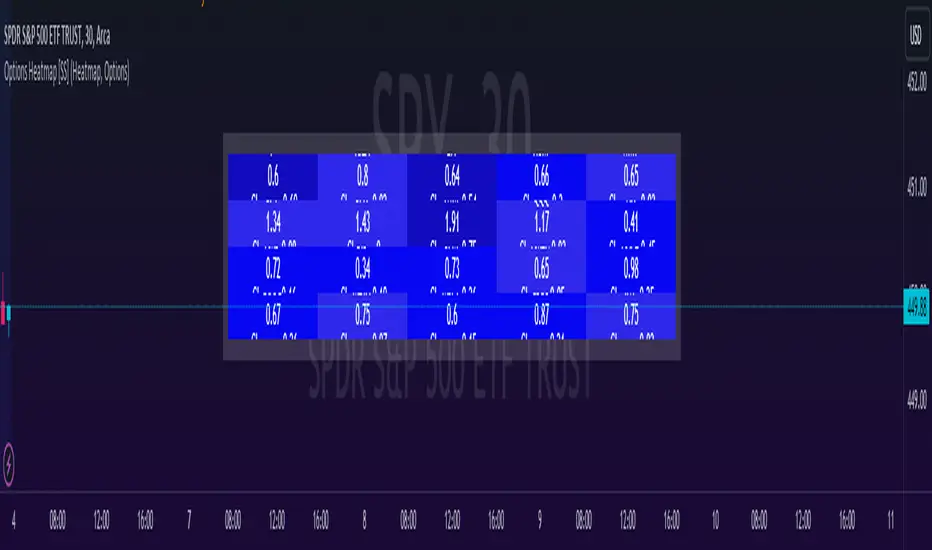
Options & Leveraged Shares Heatmap This is the leveraged share/option heatmap / screener.
Tradingview offers a few different tickers that have PTCR data on the daily timeframe. So I was able to pull those few tickers that display the PTCR data and format it into a heatmap.
I also had some room to add leveraged share data as well.
It is pretty self explanatory but I will go over it really briefly:
The timeframe is 1 D. This cannot be changed because this is the only timeframe available for the PTCR data.
It will pull the current day PTCR as well as the previous day PTCR and display the PTCR and change value.
The screening will be done according to the 1 day change.
You have the ability to select the option to sort by Max and Min or sort by heatmap:
Displaying max and min will show you the max positive and negative change among all the available tickers.
Max positive = bearish, as this indicates an uptick in Puts.
Max negative = bullish, as this indicates a decline in Puts.
If we flip over to the leveraged shares, it is the same:
To keep it consistent, the leveraged share ratio is displayed similar to PTCR. It is Sell to Buy ratio. The higher the ratio, the more selling and vice versa.
Thus, the same rules apply. Max positive = bearish and max negative = bullish.
If you want to display the heatmap, this is what it will look like:
The darker the blue, the higher the change in either a negative or positive direction. The same for the leveraged shares:
And that is the indicator.
Hopefully you find it helpful. I like to reference it at the end of each day to see how things are looking in terms of positioning for the following day.
Leave your comments/questions and suggestions below.
Safe trades!
Session Moving AveragesAdds EMAs and SMAs to chart using 8am-8pm EST values. Completely configurable in settings.
Some platforms allow users to configure what time frame they would like to view market data. One popular selection is 8am-8pm EST as 8am is when institutional orders go through. An argument can be made that price action before 8am EST is not valid yet moving averages will use that data.
This matters less for shorter moving averages such as a 9 or 20 ema, but it dramatically changes the 200 or the 50 sma for example.
This script allows you to ignore that pre-market data (or any data you choose to configure in the settings) and select up to 3 moving averages (either Exponential or Simple) for a set time.
By default the moving averages include the 9-ema (gray), 20-ema (green), and 200-sma (purple) and is set to 8am-8pm EST
This is configurable in the settings including the time frame you would like the moving averages to start using market data.
By default the script will use your charts timeframe. You are able to use multi-time frames with this script just scroll down to "timeframe", then click "chart" in settings... this will then allow you to select a timeframe.
A popular choice is 5-minute value of 8am-8pm EST moving averages. This means regardless of the time frame you are on (sub 1-minute, 1-minute, etc.) the script will display 5-minute data.
Final note: In settings you are able to turn on/off shapes (the gray lines at the bottom) which shows when the data is being used. This can be helpful on certain tickers that trade continuously such as /ES or /NQ.

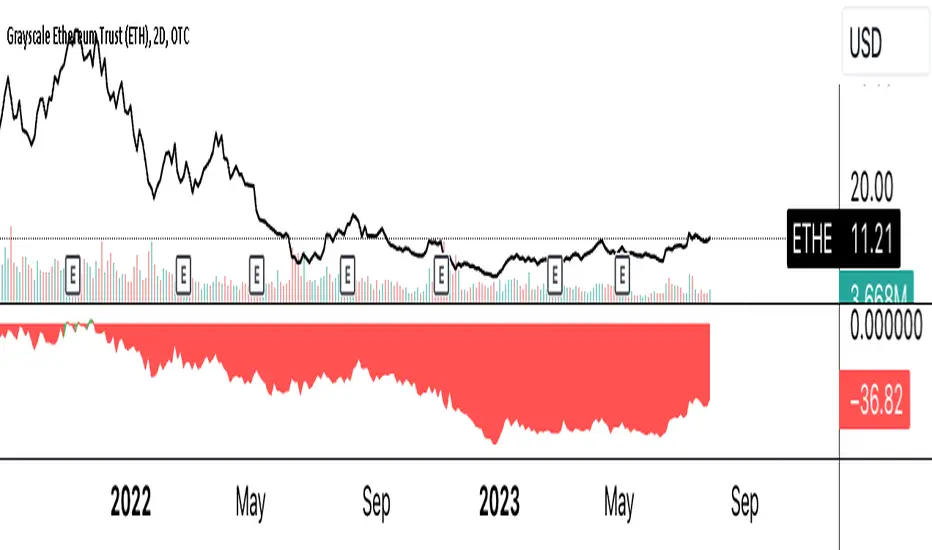
ETHE Discount/Premium to NAVThe provided script calculates the discount or premium of the Grayscale Ethereum Trust (ETHE) to its Net Asset Value (NAV), considering an annual fee of 2.5%. It does this by comparing the ETHE's price to the underlying Ethereum (ETH) value per share, adjusting for the effect of the annual fee.
Stock Open % ChangeWhile the percentage change in price from yesterday's close is important, wouldn't it be more interesting to see how much a stock price changes from the Market Open? Furthermore, you could track multiple indices to see which one has moment based on the percentage change in open, informing trading decisions.
This grid allows you to select 5 different ticker symbols, and display the change% from open, and from the close. Colors, rows, and grid placement may be customized as well.

All Candlestick Patterns Screener [By MUQWISHI]▋ INTRODUCTION :
The Candlestick Patterns Screener has been designed to offer an advanced monitoring solution for up to 40 symbols. Utilizing a log screener style, it efficiently gathers information on confirmed candlestick pattern occurrences and presents it in an organized table. This table includes essential details such as the symbol name, signal price, and the corresponding candlestick pattern name.
_______________________
▋ OVERVIEW:
_______________________
▋ CREDIT:
Credit to public technical “*All Candlestick Patterns*” indicator.
_______________________
▋ USAGE:
_______________________
▋ Final Comments:
For best performance, add the Candlestick Patterns Screener on active symbol chart like QQQ, SPY, AAPL, BTCUSDT, ES, EURUSD or …etc.
Candlestick patterns are not a major concept to build a trading decision.
Personally, I see candlestick patterns as a means to comprehend the psychology of the market, and help to follow the price action.
Please let me know if you have any questions.
Thank you.

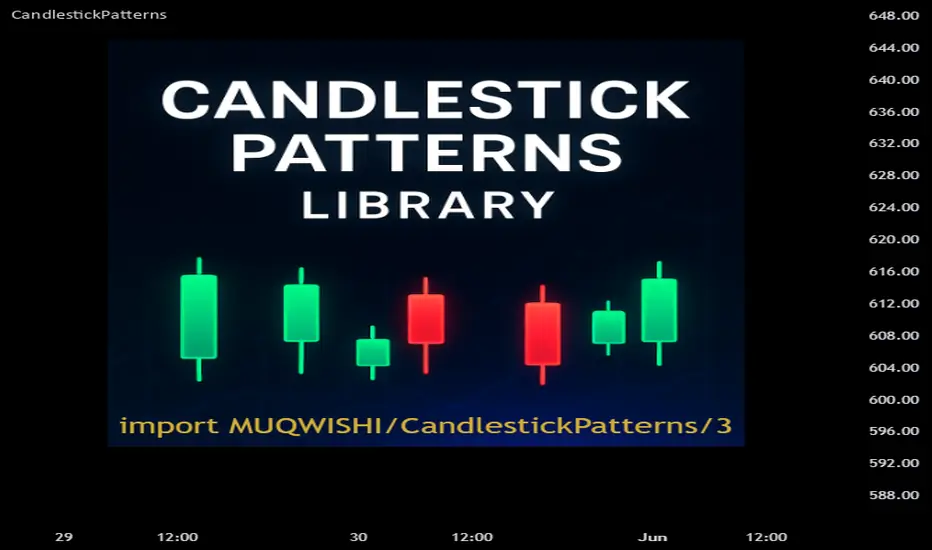
CandlestickPatternsLibrary "CandlestickPatterns"
This library provides a wide range of candlestick patterns, and available for user to call each pattern individually. It's a comprehensive and common tool designed for traders seeking to raise their technical analysis, and it may help users identify key turning of price action in financial instruments. Credit to public technical “*All Candlestick Patterns*” indicator.
abandonedBaby(order, d1)
The "Abandoned Baby" candlestick pattern is a bullish/bearish pattern consists of three candles.
Parameters:
order (simple string) : (simple string) Pattern order type "bull" or "bear".
d1 (simple float) : (simple float) Previous candle's body percentage out of candle range. Optional argument, default is 5.
darkCloudCover(c1, n)
The "Dark Cloud Cover" is a bearish pattern consists of two candles.
Parameters:
c1 (simple bool) : (simple bool) Previous candle's body must be higher than average. Optional argument, default is true.
n (simple int) : (simple int) Length of average candle's body. Optional argument, default is 14.
doji(d0)
The "Doji" is neither bullish or bearish consists of one candles.
Parameters:
d0 (simple float) : (simple float) Current candle's body percentage out of candle range. Optional argument, default is 5.
dojiStar(order, c1, n, d0)
The "Doji Star" is a bullish/bearish pattern consists of two candles.
Parameters:
order (simple string) : (simple string) Pattern order type "bull" or "bear" .
c1 (simple bool) : (simple bool) Previous candle's body must be higher than average. Optional argument, default is true.
n (simple int) : (simple int) Length of average candle's body. Optional argument, default is 14.
d0 (simple float) : (simple float) Current candle's body percentage out of candle range. Optional argument, default is 5.
downsideTasukiGap(c2, c1, n)
The "Downside Tasuki Gap" is a bearish pattern consists of three candles.
Parameters:
c2 (simple bool) : (simple bool) Before previous candle's body must be higher than average. Optional argument, default is true.
c1 (simple bool) : (simple bool) Previous candle's body must be lower than average. Optional argument, default is true.
n (simple int) : (simple int) Length of average candle's body. Optional argument, default is 14.
dragonflyDoji(d0)
The "Dragon Fly Doji" is a bullish pattern consists of one candle.
Parameters:
d0 (simple float) : (simple float) Current candle's body percentage out of candle range. Optional argument, default is 5.
engulfing(order, c1, c0, n)
The "Engulfing" is a bullish/bearish pattern consists of two candles.
Parameters:
order (simple string) : (simple string) Pattern order type "bull" or "bear".
c1 (simple bool) : (simple bool) Previous candle's body must be lower than average. Optional argument, default is true.
c0 (simple bool) : (simple bool) Current candle's body must be higher than average. Optional argument, default is true.
n (simple int) : (simple int) Length of average candle's body. Optional argument, default is 14.
eveningDojiStar(c2, c0, d1, n)
The "Evening Doji Star" is a bearish pattern consists of three candles.
Parameters:
c2 (simple bool) : (simple bool) Before previous candle's body must be higher than average, default is true.
c0 (simple bool) : (simple bool) Current candle's body must be higher than average. Optional argument, default is true.
d1 (simple float) : (simple float) Previous candle's body percentage out of candle range. Optional argument, default is 5.
n (simple int) : (simple int) Length of average candle's body. Optional argument, default is 14.
eveningStar(c2, c1, c0, n)
The "Evening Star" is a bearish pattern consists of three candles.
Parameters:
c2 (simple bool) : (simple bool) Before previous candle's body must be higher than average. Optional argument, default is true.
c1 (simple bool) : (simple bool) Previous candle's body must be lower than average. Optional argument, default is true.
c0 (simple bool) : (simple bool) Current candle's body must be higher than average. Optional argument, default is true.
n (simple int) : (simple int) Length of average candle's body. Optional argument, default is 14.
fallingThreeMethods(c4, c3, c2, c1, c0, n)
The "Falling Three Methods" is a bearish pattern consists of five candles.
Parameters:
c4 (simple bool) : (simple bool) 5th candle ago body must be higher than average. Optional argument, default is true.
c3 (simple bool) : (simple bool) 4th candle ago body must be lower than average. Optional argument, default is true.
c2 (simple bool) : (simple bool) 3rd candle ago body must be lower than average. Optional argument, default is true.
c1 (simple bool) : (simple bool) 2nd candle ago body must be lower than average. Optional argument, default is true.
c0 (simple bool) : (simple bool) Current candle's body must be higher than average. Optional argument, default is true.
n (simple int) : (simple int) Length of average candle's body. Optional argument, default is 14.
Returns: (bool)
fallingWindow()
The "Falling Window" is a bearish pattern consists of two candles.
gravestoneDoji(d0)
The "Gravestone Doji" is a bearish pattern consists of one candle.
Parameters:
d0 (simple float) : (simple float) Current candle's body percentage out of candle range. Optional argument, default is 5.
hammer(c0, n)
The "Hammer" is a bullish pattern consists of one candle.
Parameters:
c0 (simple bool) : (simple bool) Current candle's body must be lower than average. Optional argument, default is true.
n (simple int) : (simple int) Length of average candle's body. Optional argument, default is 14.
hangingMan(c0, n)
The "Hanging Man" is a bearish pattern consists of one candle.
Parameters:
c0 (simple bool) : (simple bool) Current candle's body must be lower than average. Optional argument, default is true.
n (simple int) : (simple int) Length of average candle's body. Optional argument, default is 14.
haramiCross(order, c1, n)
The "Harami Cross" candlestick pattern is a bullish/bearish pattern consists of two candles.
Parameters:
order (string) : (simple string) Pattern order type "bull" or "bear".
c1 (simple bool) : (simple bool) Previous candle's body must be higher than average. Optional argument, default is true.
n (simple int) : (simple int) Length of average candle's body. Optional argument, default is 14.
harami(order, c1, c0, n)
The "Harami" candlestick pattern is a bullish/bearish pattern consists of two candles.
Parameters:
order (string) : (simple string) Pattern order type "bull" or "bear"
c1 (simple bool) : (simple bool) Previous candle's body must be higher than average. Optional argument, default is true.
c0 (simple bool) : (simple bool) Current candle's body must be lower than average. Optional argument, default is true.
n (simple int) : (simple int) Length of average candle's body. Optional argument, default is 14.
invertedHammer(c0, n)
The "Inverted Hammer" is a bullish pattern consists of one candle.
Parameters:
c0 (simple bool) : (simple bool) Current candle's body must be lower than average. Optional argument, default is true.
n (simple int) : (simple int) Length of average candle's body. Optional argument, default is 14.
kicking(order, c1, c0, n)
The "Kicking" candlestick pattern is a bullish/bearish pattern consists of two candles.
Parameters:
order (string) : (simple string) Pattern order type "bull" or "bear"
c1 (simple bool) : (simple bool) Previous candle's body must be higher than average. Optional argument, default is true.
c0 (simple bool) : (simple bool) Current candle's body must be higher than average. Optional argument, default is true.
n (simple int) : (simple int) Length of average candle's body. Optional argument, default is 14.
longLowerShadow(l0)
The "Long Lower Shadow" candlestick pattern is a bullish pattern consists of one candles.
Parameters:
l0 (simple float) : (simple float) Current candle's lower wick min percentage out of candle range. Optional argument, default is 75.
longUpperShadow(u0)
The "Long Upper Shadow" candlestick pattern is a bearish pattern consists of one candles.
Parameters:
u0 (simple float) : (simple float) Current candle's upper wick min percentage out of candle range. Optional argument, default is 75.
marubozuBlack(c0, n)
The "Marubozu Black" candlestick pattern is a bearish pattern consists of one candles.
Parameters:
c0 (simple bool) : (simple bool) Current candle's body must be higher than average. Optional argument, default is true.
n (simple int) : (simple int) Length of average candle's body. Optional argument, default is 14.
marubozuWhite(c0, n)
The "Marubozu White" candlestick pattern is a bullish pattern consists of one candles.
Parameters:
c0 (simple bool) : (simple bool) Current candle's body must be higher than average. Optional argument, default is true.
n (simple int) : (simple int) Length of average candle's body. Optional argument, default is 14.
morningDojiStar(c2, d1, c0, n)
The "Morning Doji Star" candlestick pattern is a bullish pattern consists of three candles.
Parameters:
c2 (simple bool) : (simple bool) Before previous candle's body must be higher than average. Optional argument, default is true.
d1 (simple float) : (simple float) Previous candle's body percentage out of candle range. Optional argument, default is 5.
c0 (simple bool) : (simple bool) Current candle's body must be higher than average. Optional argument, default is true.
n (simple int) : (simple int) Length of average candle's body. Optional argument, default is 14.
morningStar(c2, c1, c0, n)
The "Morning Star" candlestick pattern is a bullish pattern consists of three candles.
Parameters:
c2 (simple bool) : (simple bool) Before previous candle's body must be higher than average. Optional argument, default is true.
c1 (simple bool) : (simple bool) Previous candle's body must be lower than average. Optional argument, default is true.
c0 (simple bool) : (simple bool) Cuurent candle's body must be higher than average. Optional argument, default is true.
n (simple int) : (simple int) Length of average candle's body. Optional argument, default is 14.
onNeck(c1, c0, n)
The "On Neck" candlestick pattern is a bearish pattern consists of two candles.
Parameters:
c1 (simple bool) : (simple bool) Previous candle's body must be higher than average. Optional argument, default is true.
c0 (simple bool) : (simple bool) Cuurent candle's body must be lower than average. Optional argument, default is true.
n (simple int) : (simple int) Length of average candle's body. Optional argument, default is 14.
piercing(c1, n)
The "Piercing" candlestick pattern is a bullish pattern consists of two candles.
Parameters:
c1 (simple bool) : (simple bool) Previous candle's body must be higher than average. Optional argument, default is true.
n (simple int) : (simple int) Length of average candle's body. Optional argument, default is 14.
risingThreeMethods(c4, c3, c2, c1, c0, n)
The "Rising Three Methods" candlestick pattern is a bullish pattern consists of five candles.
Parameters:
c4 (simple bool) : (simple bool) 5th candle ago body must be higher than average. Optional argument, default is true.
c3 (simple bool) : (simple bool) 4th candle ago body must be Lower than average. Optional argument, default is true.
c2 (simple bool) : (simple bool) 3rd candle ago body must be Lower than average. Optional argument, default is true.
c1 (simple bool) : (simple bool) 2nd candle ago body must be Lower than average. Optional argument, default is true.
c0 (simple bool) : (simple bool) Current candle's body must be higher than average. Optional argument, default is true.
n (simple int) : (simple int) Length of average candle's body. Optional argument, default is 14.
risingWindow()
The "Rising Window" candlestick pattern is a bullish pattern consists of two candle.
shootingStar(c0, n)
The "Shooting Star" candlestick pattern is a bearish pattern consists of one candle.
Parameters:
c0 (simple bool) : (simple bool) Current candle's body must be higher than average. Optional argument, default is true.
n (simple int) : (simple int) Length of average candle's body. Optional argument, default is 14.
spinningTopBlack(l0, u0)
The "Spinning Top Black" is neither bullish or bearish.
Parameters:
l0 (simple float) : (simple float) Current candle's lower wick min percentage out of candle range. Optional argument, default is 34.
u0 (simple float) : (simple float) Current candle's upper wick min percentage out of candle range. Optional argument, default is 34.
spinningTopWhite(l0, u0)
The "Spinning Top White" is neither bullish or bearish.
Parameters:
l0 (simple float) : (simple float) Current candle's lower wick min percentage out of candle range. Optional argument, default is 34.
u0 (simple float) : (simple float) Current candle's upper wick min percentage out of candle range. Optional argument, default is 34.
threeBlackCrows(c2, c1, c0, n)
The "Three Black Crows" candlestick pattern is a bearish pattern consists of three candles.
Parameters:
c2 (simple bool) : (simple bool) Before previous candle's body must be higher than average. Optional argument, default is true.
c1 (simple bool) : (simple bool) Previous candle's body must be higher than average. Optional argument, default is true.
c0 (simple bool) : (simple bool) Cuurent candle's body must be higher than average. Optional argument, default is true.
n (simple int) : (simple int) Length of average candle's body. Optional argument, default is 14.
threeWhiteSoldiers(c2, c1, c0, n)
The "Three White Soldiers" candlestick pattern is a bullish pattern consists of three candles.
Parameters:
c2 (simple bool) : (simple bool) Before previous candle's body must be higher than average. Optional argument, default is true.
c1 (simple bool) : (simple bool) Previous candle's body must be higher than average. Optional argument, default is true.
c0 (simple bool) : (simple bool) Cuurent candle's body must be higher than average. Optional argument, default is true.
n (simple int) : (simple int) Length of average candle's body. Optional argument, default is 14.
triStar(order, d2, d1, d0)
The "Tri Star" candlestick pattern is a bullish/bearish pattern consists of three candles.
Parameters:
order (simple string) : (simple string) Pattern order type "bull" or "bear".
d2 (simple float) : (simple float) Before previous candle's body percentage out of candle range. Optional argument, default is 5.
d1 (simple float) : (simple float) Previous candle's body percentage out of candle range. Optional argument, default is 5.
d0 (simple float) : (simple float) Current candle's body percentage out of candle range. Optional argument, default is 5.
tweezerBottom(c1, n)
The "Tweezer Bottom" candlestick pattern is a bullish pattern consists of two candles.
Parameters:
c1 (simple bool) : (simple bool) Previous candle's body must be higher than average. Optional argument, default is true.
n (simple int) : (simple int) Length of average candle's body. Optional argument, default is 14.
tweezerTop(c1, n)
The "Tweezer Top" candlestick pattern is a bearish pattern consists of two candles.
Parameters:
c1 (simple bool) : (simple bool) Previous candle's body must be higher than average. Optional argument, default is true.
n (simple int) : (simple int) Length of average candle's body. Optional argument, default is 14.
upsideTasukiGap(c2, c1, n)
The "Tri Star" candlestick pattern is a bullish pattern consists of three candles.
Parameters:
c2 (simple bool) : (simple bool) Before Previous candle's body must be higher than average. Optional argument, default is true.
c1 (simple bool) : (simple bool) Previous candle's body must be lower than average. Optional argument, default is true.
n (simple int) : (simple int) Length of average candle's body. Optional argument, default is 14.
Trend Correlation Oscillator [SS]Hello,
Publishing this simple indicator.
What is it?
The Trend Correlation Oscillator takes the concept of my autocorrelation oscillator but applies it simply to time instead of autocorrelation.
It performs a correlation assessment to time. The theory behind it is the stronger the correlation, the more "exhausted" the trend and the more likely the trend will reverse. It is kind of building off of random walk theory in which the market should be random and efficient.
Does it work?
If you follow me on my indicator side, you will know that my indicators are all based on my own research and findings and stuff that I personally find that works. All of this comes from years of losing money trying to use conventional systems and finally developing my own stuff that I find works well. This is such an invention. It does work extremely well but its best applied for day traders. If you want to use this as a swing trader, play around with the lookback length. I don't have general recommendations to swing traders wanting to use this because this isn't an indicator I personally would use for swing trading (I would use the autocorrelation oscillator for that).
How to use it:
The default setting is to a 14 candle lookback. This works the best. It also should really be used on the 5 minute chart and not the 1 minute chart, as from my experience this works much better.
When a trend is approaching "exhaustion" to the upside, the indicator will turn red to let you know we are approaching a trend exhaustion. Once the exhaustion is at its peak and beginning to reverse, the indicator will place a cross symbol on where your entry should be. See the image below for an example:
It also works well if you combine it with my PTCR Correlation Indicator:
Closing thoughts
That is basically the indicator. Its one of my more simple ones, but many times simple is better and most effective!
Hopefully you find it helpful.
As always let me know your questions, comments and feedback/recommendations for improvements below.
Please know I do read and make note of all recommendations for indicators and improvements, however as it is just me managing them, it takes time for implementation and review :-).
Safe trades!

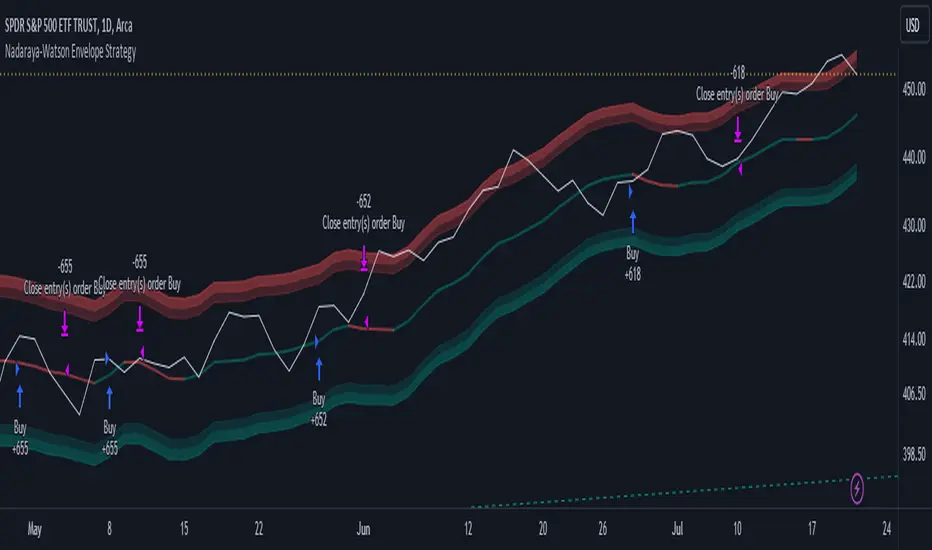
Nadaraya-Watson Envelope Strategy (Non-Repainting) Log ScaleIn the diverse world of trading strategies, the Nadaraya-Watson Envelope Strategy offers a different approach. Grounded in mathematical analysis, this strategy utilizes the Nadaraya-Watson kernel regression, a method traditionally employed for interpreting complex data patterns.
At the core of this strategy lies the concept of 'envelopes', which are essentially dynamic volatility bands formed around the price based on a custom Average True Range (ATR). These envelopes help provide guidance on potential market entry and exit points. The strategy suggests considering a buy when the price crosses the lower envelope and a sell when it crosses the upper envelope.
One distinctive characteristic of the Nadaraya-Watson Envelope Strategy is its use of a logarithmic scale, as opposed to a linear scale. The logarithmic scale can be advantageous when dealing with larger timeframes and assets with wide-ranging price movements.
The strategy is implemented using Pine Script v5, and includes several adjustable parameters such as the lookback window, relative weighting, and the regression start point, providing a level of flexibility.
However, it's important to maintain a balanced view. While the use of mathematical models like the Nadaraya-Watson kernel regression may provide insightful data analysis, no strategy can guarantee success. Thorough backtesting, understanding the mathematical principles involved, and sound risk management are always essential when applying any trading strategy.
The Nadaraya-Watson Envelope Strategy thus offers another tool for traders to consider. As with all strategies, its effectiveness will largely depend on the trader's understanding, application, and the specific market conditions.
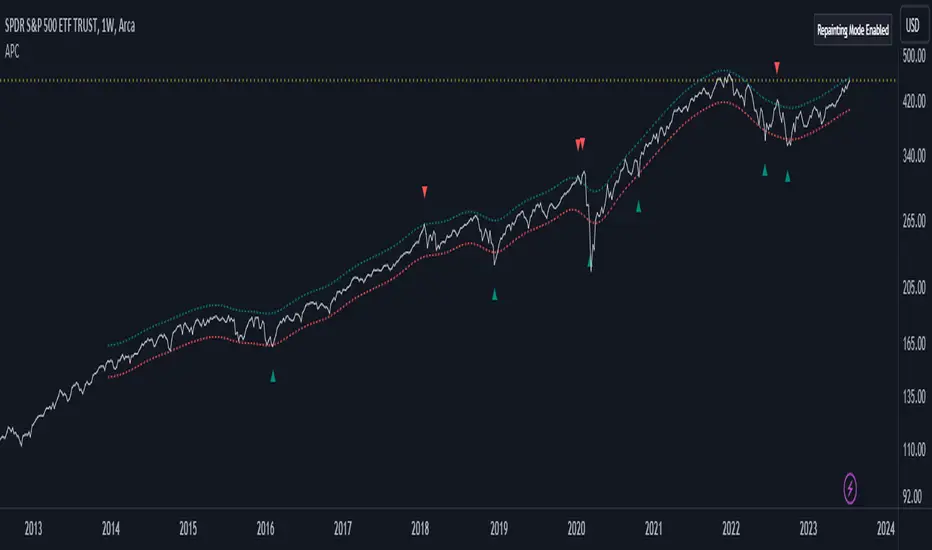
Adaptive Price Channel (log scale)The field of technical analysis is consistently expanding, with numerous indicators used for market forecasting. Amongst them, a novel indicator dubbed the Adaptive Price Channel (log scale), inspired by the renowned Nadaraya-Watson Envelope (LuxAlgo) from LuxAlgo, is gaining traction for its distinctive features and versatility. Unlike its predecessor, the Adaptive Price Channel (log scale) is applicable on a logarithmic scale, thereby allowing it to be utilized on both smaller and larger timeframes.
1. Key Features
The Adaptive Price Channel (log scale) is founded on the trading view Pinescript language, version 5, with its primary aim to maximize the versatility and scalability of trading indicators. It allows traders to adapt it according to their preferred timeframe, thereby making it applicable for a wide range of trading strategies.
Its bandwidth can be adjusted through the input parameters, offering traders the flexibility to manipulate the indicator according to their strategic requirements. Furthermore, it provides an option for repainting smoothing. This option enables users to control the repainting effect in which the historical output of the indicator may change over time. When disabled, the indicator provides the endpoints of the calculations, ensuring consistency in historical values.
Moreover, the Adaptive Price Channel (log scale) allows for color customization, thereby improving visibility and user-friendliness. The colors of the indicator's upward and downward directions can be changed according to the user's preference.
2. Working Mechanism
The Adaptive Price Channel (log scale) uses the logarithm of the source, which is typically the closing price of a trading instrument. It leverages a Gaussian function that exponentially decreases the further the price moves away from the mean, accounting for both positive and negative values. The bandwidth of the Gaussian function can be adjusted to adapt to different market conditions.
Additionally, the Adaptive Price Channel (log scale) features an array of 500 lines for each bar, which helps in defining the boundaries or envelope for price movements. The calculations are executed using the Nadaraya-Watson estimator, which uses kernel regression for non-parametric analysis.
The calculated values for the upper and lower bounds of the envelope are then converted back from the logarithmic scale using the exponential function. This calculation process continues for each bar until the last bar in the data set.
To ensure optimal performance, the Adaptive Price Channel (log scale) uses dynamic repainting. If the repainting mode is enabled, it adjusts the smoothing of the indicator for the entire historical data, making the results more accurate.
3. Visualization and Alerts
The Adaptive Price Channel (log scale) offers an array of visual aids, including labels and plots. The upper and lower bounds of the envelope are plotted, and the indicator triggers labels at points where the closing price crosses these boundaries. These labels serve as alerts for potential trading opportunities.
4. Conclusion
The Adaptive Price Channel (log scale) is an innovative and adaptable trading indicator, drawing inspiration from its predecessor but introducing unique features to increase its versatility. By providing a repainting option, it ensures consistent historical values, thereby enhancing the reliability of the indicator. Furthermore, the capability to operate on a logarithmic scale broadens its usability for different timeframes. The Adaptive Price Channel (log scale) is a powerful tool for any trader, facilitating a better understanding of market dynamics, and enabling more informed decision-making.
GBTC Discount/Premium to NAVGBTC Discount/Premium to NAV, dynamically adjust BTC holdings per share daily

[EKIN] ATR Exit StrategyMy exit strategy to reduce risk via tracking price and ATR. Sets new STOP price based on how many ATR is current price above from the entry price.
I only check 5 and 20 EMAs for entry strategy. I intentionally used a simple entry strategy to further test the impact of this exit strategy.
First sets STOP at 1.5 ATR below the entry price.
If there is a 2 ATR increase, pulls STOP to the entry point to eliminate the possibility of loss.
If there is a 3 ATR increase, takes a 50% profit and moves STOP to 1 ATR above the entry price.
If there is a 4 ATR increase, moves STOP to 2 ATR above the entry price.
If there is a 5 ATR increase, moves STOP to 3 ATR above the entry price.
.
.
.
This is my first strategy attempt so I am open to any recommendations. I am planning to update this strategy overtime when I get better at pinescript and trading in general

Buyers & Sellers / RangeBuyers & Sellers / Range
Volatility oscillator that measures the relationship of Buying & Selling Pressure to True Range.
In other words, how much % Buyers and Sellers separately occupy the Bar
BSP is a part of Bar Range. Entire bar metrics will always have bigger value than its composite elements (body and wicks).
Since there will be NO chance of BP or SP being more than ATR, their ratio would serve crucial Volatility details.
Hence, we can relate each of them to the overall range.
As a result we have simultaneous measurements of proportions buyers and sellers to the bar.
Default mode shows BP/ATR and SP/ATR mirrored. When one rises, the other falls to compensate.
Buying Pressure / True Range ⬆️🟢 ⬇️🔵
Selling Pressure / True Range ⬆️🔴 ⬇️🟠
They are being averaged in 2 different ways:
Pre-average first, then relate as ratio
Related first, then Averaged
Enable "Preaveraged" to use already averaged BSP and Ranges in ratio instead of averaging the ratio of BSP to individual bar. For example, we're looking BP/ATR, in calculation of buyers / Range it will use "MA(Buying Pressure) / MA(True Range)" instead of "MA(Buying Pressure / True Range)".
Due such calculation, it is going to be more lagging than in off mode. Nevertheless, it reduces noise from the impact of individual bar change.
Second way of noise reduction is enabling "Body / Range"
BSP Body / Range where Bullish & Bearish Body = Buying & Selling Pressure - Relevant Wick
Buying Body = Buying Pressure - Lower Wick
Selling Body = Selling Pressure - Upper Wick
And only then it is divided to ATR.
Note that Balance line differs because body is less than it used to be with wicks. So change in wicks won't play any role in computing the ratio anymore. Thus, signals of their crossings will be more reliable than in default mode.
