Recherche dans les scripts pour "30分钟K线图+交易策略"

COLOUR CODED ULTIMATE OSCILLATOR WITH LEVELS (70/50/30)Just added 70/30/50 levels to @LazyBear 's "Color Coded UO" script.
Happy Trading!

[STRATEGY]EMA 30/60 Cross Strategystrategy based on EMA 30/60 cross
works best on 4hr timeframes & high-midcaps

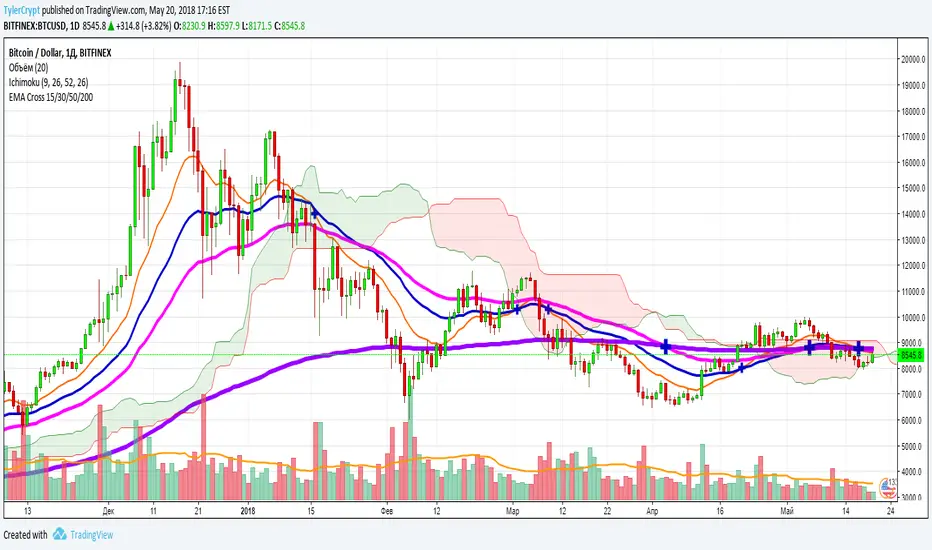
5 Moving Average Exponential 7-15-30-50-2005 Moving Average Exponential. Crypto EMA. 7 is a fast support or resistance, 15 confirmation support or resistance. 30 Important support and resistance. 50 institutional support or resistance. 200 general trend, support and resistance.

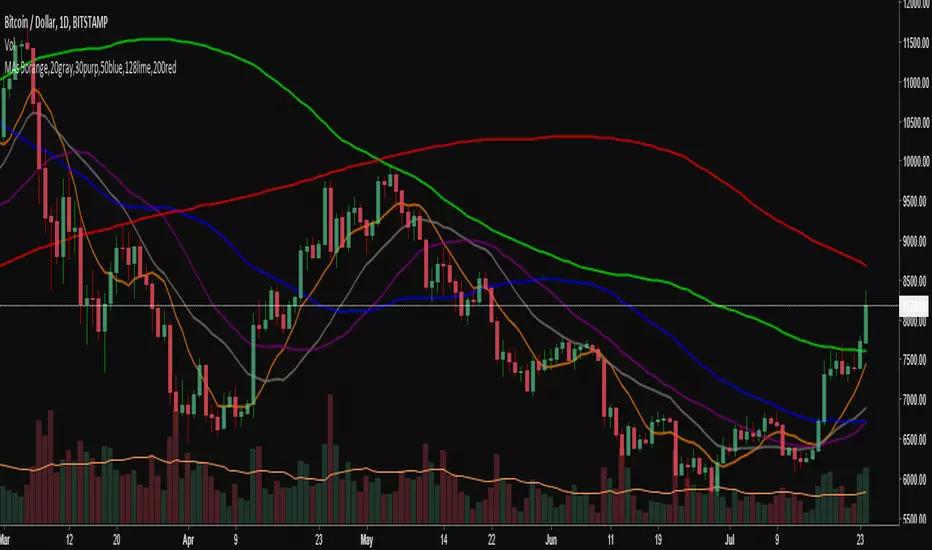
6 SMA's (fit to BTC) 9,20,30,50,128,200 (exponential optional)I've been using these for a while trading Bitcoin and I've found them to be the most useful to me. I replaced the 7 you may have seen in the first set with the 9 as I'm seeing it tested across many time frames quite frequently. The least used of the six is the 30 period, but it does have some influence I've found on the large time frames, mainly the weekly.

6 Simple Moving Averages 9,20,30,50,128,200 (bitcoin tested)I've condensed my SMAs down to these 6 and have found them to be most useful for Bitcoin, which is what I trade the most. They all have played their roll in acting as support and resistance and making decisions with the 30 period probably the least relevant, but relevant nonetheless. There is the option to change to exponential if desired.

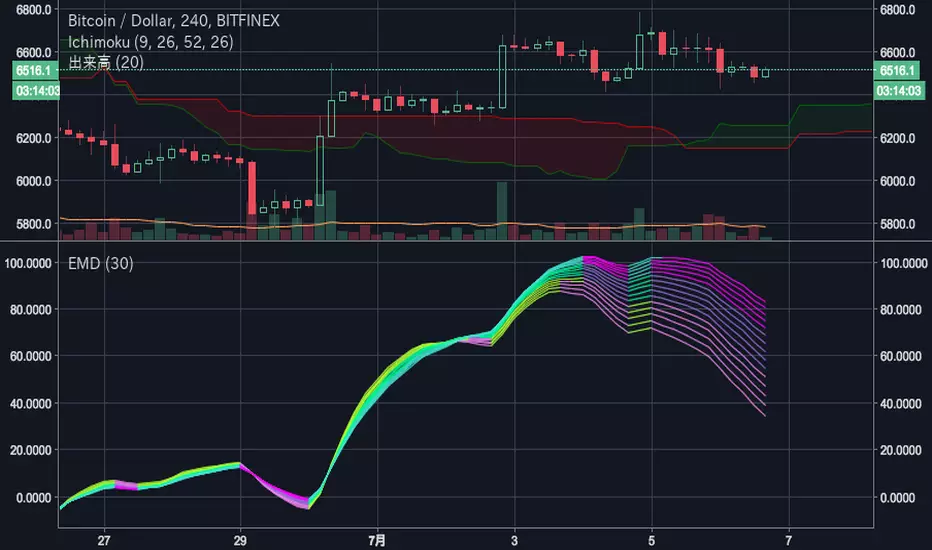
EvaMacD for 30 linesEva Chart calculate IIR Filter with Multiple MACD Histogram and estimate the cycle.
This oscillator can find the most powerful frequency. This use 30 MACD histogram lines tuned for filter.

Simple Moving Averages (7, 30, 50, 100, 200)7, 30, 50, 100, 200 simple moving averages, bundled in one indicator (for users who are using the free TradingView service and can only load limited number of indicators at any given time).
You can turn each moving average on or off at will and change the colors.

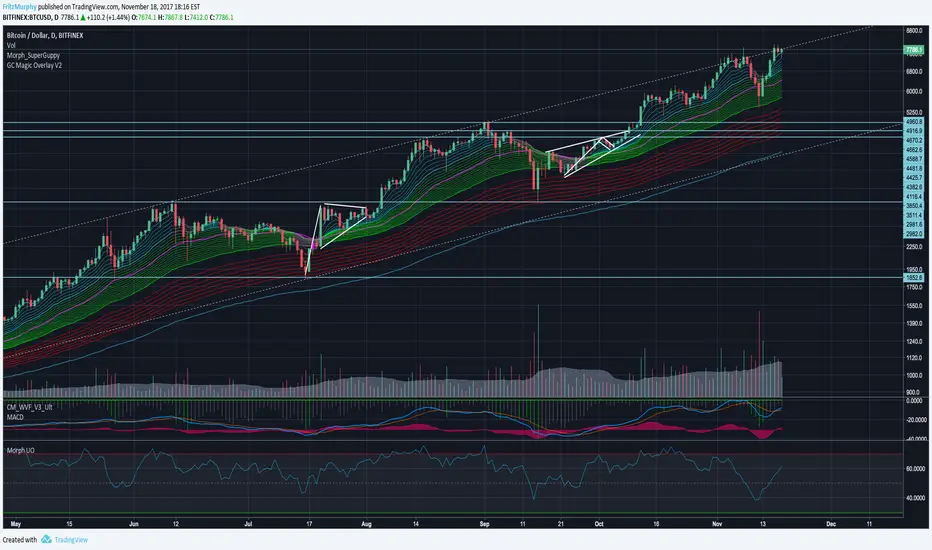
Guppy MMA 3, 5, 8, 10, 12, 15 and 30, 35, 40, 45, 50, 60Guppy Multiple Moving Average
Short Term EMA 3, 5, 8, 10, 12, 15
Long Term EMA 30, 35, 40, 45, 50, 60
Use for SFTS Class

Ultimate Oscillator with 70/30/50 LinesUltimate Oscillator with 70/30/50 lines and a background.
Read how to use it here:
stockcharts.com
Enjoy :)


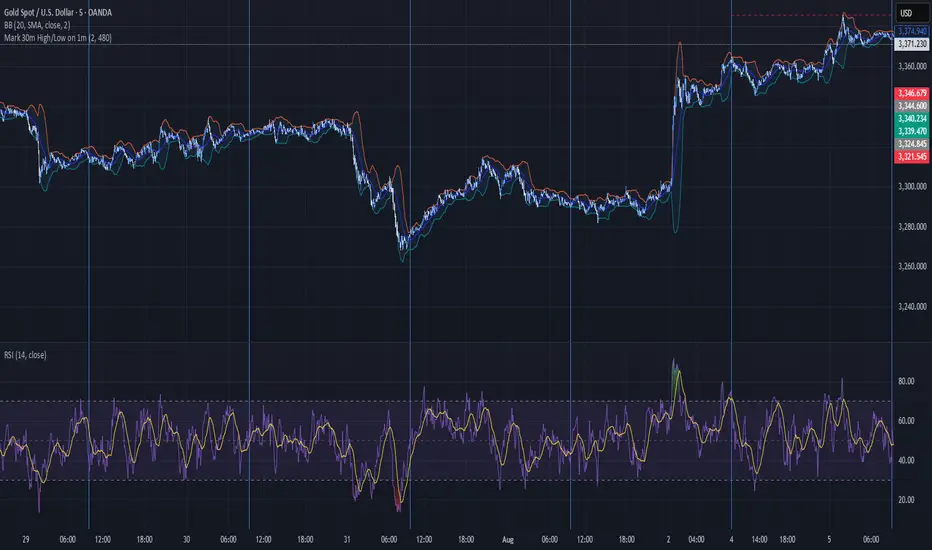
Mark 30m High/Low on 1m30 MIN HIGHS AND LOWS
Marked on the one minute chart.
High is marked with a green line.
Low is marked with a red line.
MTF EMA Pane with Diagnostics30 sec chart, 1 min EMA goes flat, I buy, 1 min EMA stays inside the group, I stay in the trade.
Not financial advice. I am working on an Algo killer, stay tuned. I am dedicating the rest of my life, as short as it my be, to beating the Men behind the Algo's. Buy me some coffee.
Send USDT thru ETH or Base to BYDFi 0x20391e32afd61dc9e1ec027651391b56ceade4e0
Join BYDFi
Referral Link: Spin for a possible $100
partner.bydfi.com
Deposit: USDT via;
ETH (ERC20) 0x20391e32afd61dc9e1ec027651391b56ceade4e0
Tron (TRC20)
TUs5u2YxtQrQfRwYK2CsMmSDGvND6Uopdj
BNB/Base (BEP20)
0x20391e32afd61dc9e1ec027651391b56ceade4e0
Solana
696LAngiQBbdk4m6k1ZBiKZrFtjTJo6dxCnVXMEePQea

30s OR ProjectionsThis script gets the opening range for NQ,ES, and YM. It then created deviations based on this range as targets to take profit from. You may also use the deviations to enter into trades looking for the other side of the range. You have the ability to shade areas of the range.

7:30 AM ET Bar HighlighterHow it works
Step Explanation
1️⃣ hour(time, targetTZ) and minute(time, targetTZ) convert each bar’s opening time to America/New_York and check for 7 : 25.
2️⃣ When both match, isTargetBar becomes true.
3️⃣ bgcolor() paints that candle red, and plotshape() draws the white dot just above it.
Adjustable Color Changing WMA by Slope Degree30 weighted moving average that changes colors based upon degree of slope. Consider it a green light for buying/selling pullbacks to the wma. You can adjust the colors and the threshold for the degree of slope.

30 Day Moving AverageThis indicator offers a longer time frame view compared to the 9 day moving average. This can give a better indication over longer term market moves.

Pump / Dump — RSI OB/OS Only📌 Description
This script “Pump / Dump — RSI OB/OS Only” is a very simple indicator that generates Pump and Dump signals based purely on the RSI overbought/oversold zones.
Pump (Green Up Signal) → When RSI crosses into or stays in the Overbought zone (≥70 by default).
Dump (Red Down Signal) → When RSI crosses into or stays in the Oversold zone (≤30 by default).
⚙️ Features
Adjustable RSI length (default 14).
Customizable Overbought / Oversold levels (default 70/30).
Option to choose between:
Cross Only Mode → Signal appears once when RSI enters the zone.
Zone Mode → Signals appear every bar while RSI stays inside the zone.
Clear visual labels on the chart (green for Pump, red for Dump).
Built-in alert conditions for Pump/Dump events (can be used with TradingView alerts).
🎯 Use Case
Quick visual confirmation of potential momentum shifts.
Helps scalpers & intraday traders spot areas where the market may be overextended.
Works on any symbol & timeframe.
⚠️ Disclaimer: This tool is for educational purposes only. It is not financial advice. Always combine with your own analysis and risk management.

Quarterly Cycle Theory with DST time AdjustedThe Quarterly Theory removes ambiguity, as it gives specific time-based reference points to look for when entering trades. Before being able to apply this theory to trading, one must first understand that time is fractal:
Yearly Quarters = 4 quarters of three months each.
Monthly Quarters = 4 quarters of one week each.
Weekly Quarters = 4 quarters of one day each (Monday - Thursday). Friday has its own specific function.
Daily Quarters = 4 quarters of 6 hours each = 4 trading sessions of a trading day.
Sessions Quarters = 4 quarters of 90 minutes each.
90 Minute Quarters = 4 quarters of 22.5 minutes each.
Yearly Cycle: Analogously to financial quarters, the year is divided in four sections of three months each:
Q1 - January, February, March.
Q2 - April, May, June (True Open, April Open).
Q3 - July, August, September.
Q4 - October, November, December.
S&P 500 E-mini Futures (daily candles) — Monthly Cycle.
Monthly Cycle: Considering that we have four weeks in a month, we start the cycle on the first month’s Monday (regardless of the calendar Day):
Q1 - Week 1: first Monday of the month.
Q2 - Week 2: second Monday of the month (True Open, Daily Candle Open Price).
Q3 - Week 3: third Monday of the month.
Q4 - Week 4: fourth Monday of the month.
S&P 500 E-mini Futures (4 hour candles) — Weekly Cycle.
Weekly Cycle: Daye determined that although the trading week is composed by 5 trading days, we should ignore Friday, and the small portion of Sunday’s price action:
Q1 - Monday.
Q2 - Tuesday (True Open, Daily Candle Open Price).
Q3 - Wednesday.
Q4 - Thursday.
S&P 500 E-mini Futures (1 hour candles) — Daily Cycle.
Daily Cycle: The Day can be broken down into 6 hour quarters. These times roughly define the sessions of the trading day, reinforcing the theory’s validity:
Q1 - 18:00 - 00:00 Asia.
Q2 - 00:00 - 06:00 London (True Open).
Q3 - 06:00 - 12:00 NY AM.
Q4 - 12:00 - 18:00 NY PM.
S&P 500 E-mini Futures (15 minute candles) — 6 Hour Cycle.
6 Hour Quarters or 90 Minute Cycle / Sessions divided into four sections of 90 minutes each (EST/EDT):
Asian Session
Q1 - 18:00 - 19:30
Q2 - 19:30 - 21:00 (True Open)
Q3 - 21:00 - 22:30
Q4 - 22:30 - 00:00
London Session
Q1 - 00:00 - 01:30
Q2 - 01:30 - 03:00 (True Open)
Q3 - 03:00 - 04:30
Q4 - 04:30 - 06:00
NY AM Session
Q1 - 06:00 - 07:30
Q2 - 07:30 - 09:00 (True Open)
Q3 - 09:00 - 10:30
Q4 - 10:30 - 12:00
NY PM Session
Q1 - 12:00 - 13:30
Q2 - 13:30 - 15:00 (True Open)
Q3 - 15:00 - 16:30
Q4 - 16:30 - 18:00
S&P 500 E-mini Futures (5 minute candles) — 90 Minute Cycle.
Micro Cycles: Dividing the 90 Minute Cycle yields 22.5 Minute Quarters, also known as Micro Sessions or Micro Quarters:
Asian Session
Q1/1 18:00:00 - 18:22:30
Q2 18:22:30 - 18:45:00
Q3 18:45:00 - 19:07:30
Q4 19:07:30 - 19:30:00
Q2/1 19:30:00 - 19:52:30 (True Session Open)
Q2/2 19:52:30 - 20:15:00
Q2/3 20:15:00 - 20:37:30
Q2/4 20:37:30 - 21:00:00
Q3/1 21:00:00 - 21:23:30
etc. 21:23:30 - 21:45:00
London Session
00:00:00 - 00:22:30 (True Daily Open)
00:22:30 - 00:45:00
00:45:00 - 01:07:30
01:07:30 - 01:30:00
01:30:00 - 01:52:30 (True Session Open)
01:52:30 - 02:15:00
02:15:00 - 02:37:30
02:37:30 - 03:00:00
03:00:00 - 03:22:30
03:22:30 - 03:45:00
03:45:00 - 04:07:30
04:07:30 - 04:30:00
04:30:00 - 04:52:30
04:52:30 - 05:15:00
05:15:00 - 05:37:30
05:37:30 - 06:00:00
New York AM Session
06:00:00 - 06:22:30
06:22:30 - 06:45:00
06:45:00 - 07:07:30
07:07:30 - 07:30:00
07:30:00 - 07:52:30 (True Session Open)
07:52:30 - 08:15:00
08:15:00 - 08:37:30
08:37:30 - 09:00:00
09:00:00 - 09:22:30
09:22:30 - 09:45:00
09:45:00 - 10:07:30
10:07:30 - 10:30:00
10:30:00 - 10:52:30
10:52:30 - 11:15:00
11:15:00 - 11:37:30
11:37:30 - 12:00:00
New York PM Session
12:00:00 - 12:22:30
12:22:30 - 12:45:00
12:45:00 - 13:07:30
13:07:30 - 13:30:00
13:30:00 - 13:52:30 (True Session Open)
13:52:30 - 14:15:00
14:15:00 - 14:37:30
14:37:30 - 15:00:00
15:00:00 - 15:22:30
15:22:30 - 15:45:00
15:45:00 - 15:37:30
15:37:30 - 16:00:00
16:00:00 - 16:22:30
16:22:30 - 16:45:00
16:45:00 - 17:07:30
17:07:30 - 18:00:00
S&P 500 E-mini Futures (30 second candles) — 22.5 Minute Cycle.
