Mayer Multiple v2.0 - Klahr ThresholdThis is a simple update to the Mayer Multiple script by Unbound , which charts an indicator created by Trace Mayer and popularized by Preston Pysh.
The original post identified any price below 2.4x the 100-day MA as the BTC buy threshold. While the logic there is historically sound, it does not account for the fact that the BTC trend is parabolic in nature. With that in mind, I've attempted to update the 2.4x multiple to react based on the moving average of the Mayer Multiple itself. To do so, I simply found the number that, when added to the MM moving average, historically hit the 2.4x multiple during periods of low volatility. This turns out to be 1.17.
The green line represents the Klahr Threshold (is it obnoxious if I call it that? I've always wanted an indicator named after me). As you can see from the above chart, it hovers around 2.4x in late 2012 to early 2013, rises above it until mid 2014, and then stays below until 2016. It then stays almost exactly at 2.4x until April 2017, when it rises significantly above it for the first time since July 2014. The convergence in late 2012 and 2016-2017 is what leads me to believe that this should be the basis for the updated threshold.
It's entirely possible that there's a more robust method of calculating a reactive threshold (or a different number that should be added to the multiple's MA), but I think this is a good first step in refining the multiple to withstand the test of time.
Recherche dans les scripts pour "BTC"

Power Law of Diminishing Returns for BTC:USDTThis is a script to see if the Law of Diminshining Returns is applicable to BTC/USD

Dumb Money Flow - Retail Panic & FOMO# Dumb Money Flow (DMF) - Retail Panic & FOMO
## 🌊 Overview
**Dumb Money Flow (DMF)** is a powerful **contrarian indicator** designed to track the emotional state of the retail "herd." It identifies moments of extreme **Panic** (irrational selling) and **FOMO** (irrational buying) by analyzing on-chain data, volume anomalies, and price velocity.
In crypto markets, retail traders often buy the top (FOMO) and sell the bottom (Panic). This indicator helps you do the opposite: **Buy when the herd is fearful, and Sell when the herd is greedy.**
---
## 🧠 How It Works
The indicator combines multiple data points into a single **Sentiment Index** (0-100), normalized over a 90-day period to ensure it always uses the full range of the chart.
### 1. Panic Index (Bearish Sentiment)
Tracks signs of capitulation and fear. High values contribute to the **Panic Zone**.
* **Exchange Inflows:** Spikes in funds moving to exchanges (preparing to sell).
* **Volume Spikes:** High volume during price drops (panic selling).
* **Price Crash (ROC):** Rapid, emotional price drops over 3 days.
* **Volatility (ATR):** High market nervousness and instability.
### 2. FOMO Index (Bullish Sentiment)
Tracks signs of euphoria and greed. High values contribute to the **FOMO Zone**.
* **Exchange Outflows:** Funds moving to cold storage (HODLing/Greed).
* **Profitable Addresses:** When >90% of holders are in profit, tops often form.
* **Parabolic Rise:** Rapid, unsustainable price increases.
---
## 🎨 Visual Guide
The indicator uses a distinct color scheme to highlight extremes:
* **🟢 Dark Green Zone (> 80): Extreme FOMO**
* **Meaning:** The crowd is euphoric. Risk of a correction is high.
* **Action:** Consider taking profits or looking for short entries.
* **🔴 Dark Burgundy Zone (< 20): Extreme Panic**
* **Meaning:** The crowd is capitulating. Prices may be oversold.
* **Action:** Look for buying opportunities (catching the knife with confirmation).
* **🔵 Light Blue Line:**
* The smoothed moving average of the sentiment, helpful for seeing the trend direction.
---
## 🛠️ How to Use (Trading Strategies)
### 1. Contrarian Reversals (The Primary Strategy)
* **Buy Signal:** Wait for the line to drop deep into the **Burgundy Panic Zone (< 20)** and then start curling up. This indicates that the worst of the selling pressure is over.
* **Sell Signal:** Wait for the line to spike into the **Green FOMO Zone (> 80)** and then start curling down. This suggests buying exhaustion.
### 2. Divergences
* **Bullish Divergence:** Price makes a **Lower Low**, but the DMF Indicator makes a **Higher Low** (less panic on the second drop). This is a strong reversal signal.
* **Bearish Divergence:** Price makes a **Higher High**, but the DMF Indicator makes a **Lower High** (less FOMO/buying power on the second peak).
### 3. Trend Confirmation (Midline Cross)
* **Crossing 50 Up:** Sentiment is shifting from Fear to Greed (Bullish).
* **Crossing 50 Down:** Sentiment is shifting from Greed to Fear (Bearish).
---
## ⚙️ Settings
* **Data Source:** Defaults to `INTOTHEBLOCK` for on-chain data.
* **Crypto Asset:** Auto-detects BTC/ETH, but can be forced.
* **Normalization Period:** Default 90 days. Determines the "window" for defining what is considered "Extreme" relative to recent history.
* **Weights:** You can customize how much each factor (Volume, Inflows, Price) contributes to the index.
---
**Disclaimer:** This indicator is for educational purposes only. "Dumb Money" analysis is a probability tool, not a crystal ball. Always manage your risk.
**Indicator by:** @iCD_creator
**Version:** 1.0
**Pine Script™ Version:** 6
---
## Updates & Support
For questions, suggestions, or bug reports, please comment below or message the author.
**Like this indicator? Leave a 👍 and share your feedback!**


Stablecoin to BTC Market Cap RatioThis indicator calculates the ratio of the combined market capitalization of USDT and USDC stablecoins to the market capitalization of BTC. Data is updated daily from TradingView's CRYPTOCAP sources. It is displayed as a line in a separate panel, allowing analysis of stablecoin liquidity dynamics relative to BTC.
How to Use
Add the indicator to any asset chart in TradingView. It is useful for assessing the potential buying power of stablecoins in the cryptocurrency market. High ratio values may signal accumulation of liquidity in stablecoins, often preceding growth in BTC or altcoins (bullish signal). Low values indicate a decrease in the role of stablecoins, which may be bearish. It is recommended to combine with other indicators, such as RSI or volumes, to confirm trends.

Power Law BTC IndicatorPOWER LAW BTC indicator:
A long-term price model that suggests Bitcoin's price follows a power law function over time. Unlike traditional stock market models that assume linear or exponential growth, the power law model suggests that Bitcoin's price scales in a predictable, non-random way over the long run

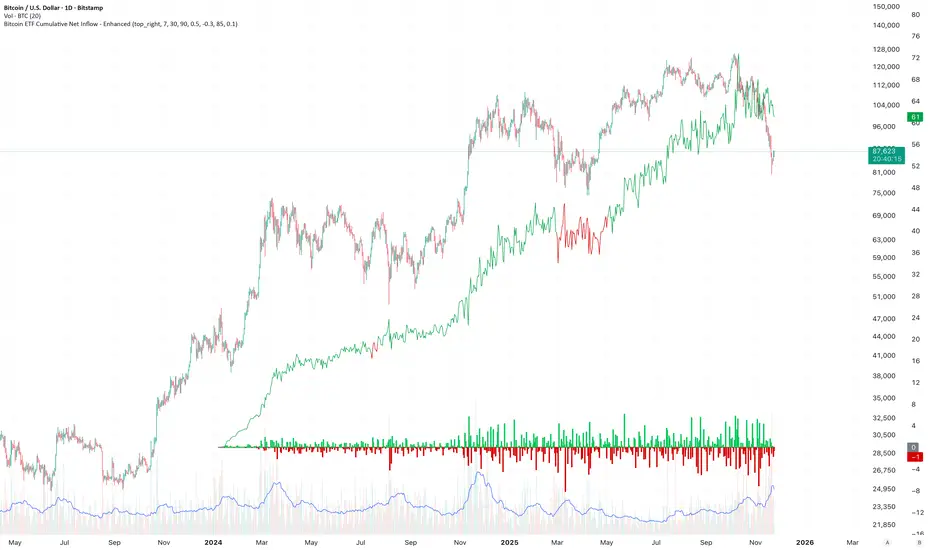
Bitcoin ETF Cumulative Net InflowIndicator Description:
This indicator calculates and plots the cumulative net inflow (in billions of USD) for selected Bitcoin ETFs on the main price chart. It uses AUM data from TradingView to estimate daily net flows, adjusted for BTC price changes, and accumulates them over time. The line is overlaid on the price chart (e.g., BTCUSD) with a right scale for better visibility, helping to identify correlations between ETF inflows and Bitcoin price movements.
Key Features:
Supports selection of 10 major Bitcoin ETFs (IBIT, FBTC, ARKB, etc.) via inputs.
Cumulative inflow line (purple, linewidth=2) for trend analysis.
Data sourced from request.financial("AUM", "D") for accuracy.
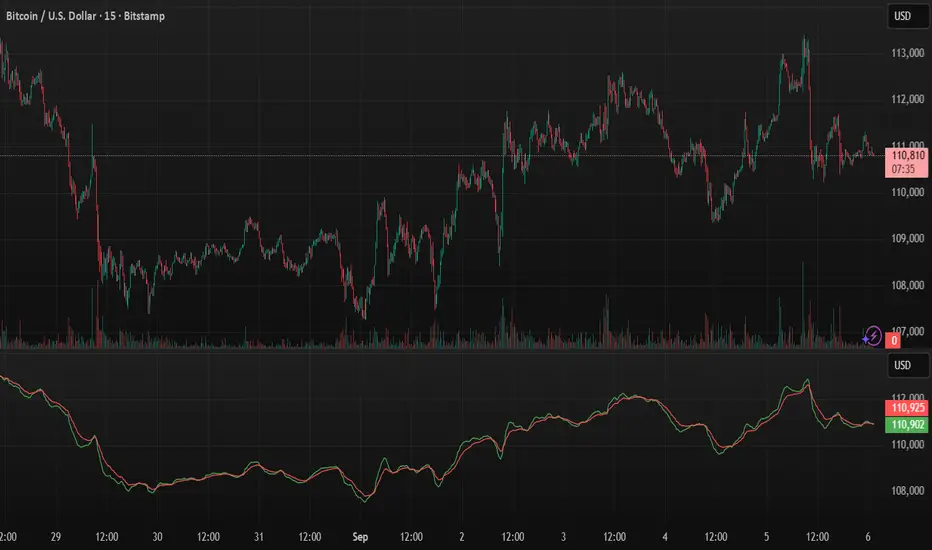
sHip Crypto Buy/Sell Pro BTC 15minThis is a 15min BTC buy sell indicator that is made by Ai. Have not tested yet but you can give it a go if you want.

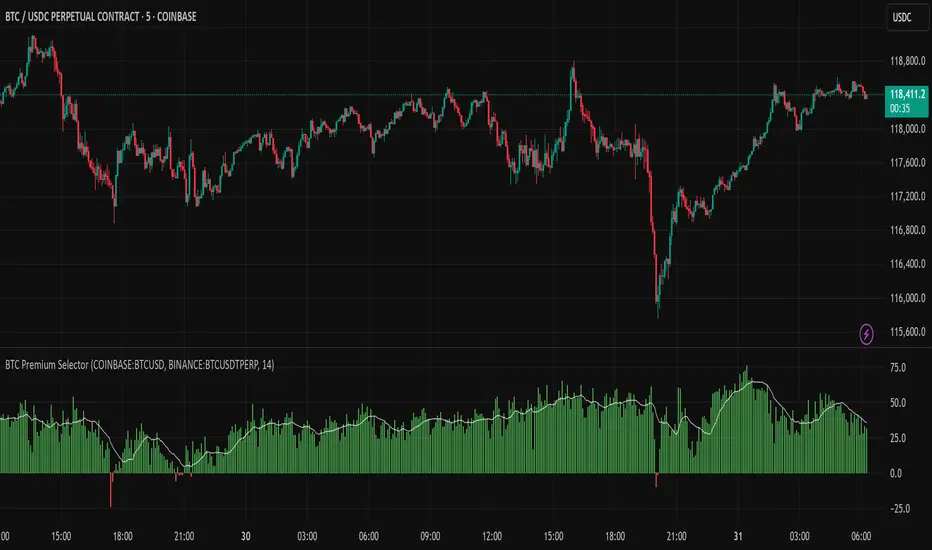
Multi CEX BTC Spot vs Perpetual PremiumThis Indicator shows the BTC Spot vs Perpetual premium across different CEX.
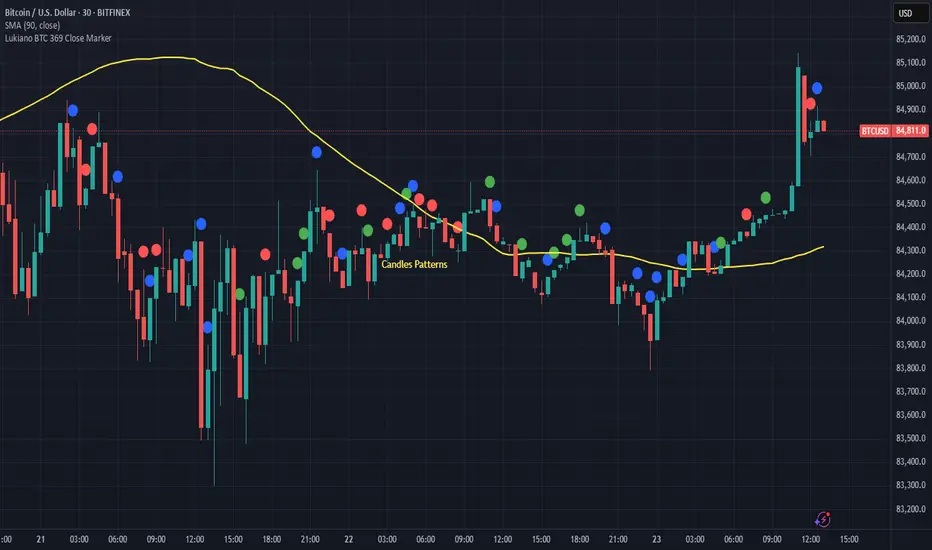
Lukiano BTC 369 Close MarkerThis indicator highlights candles where the closing price reduces to 3, 6, or 9 based on digital root calculation (sum of digits).
🔵 Blue dot = 3
🟢 Green dot = 6
🔴 Red dot = 9
Inspired by Tesla’s 369 theory and adapted for BTC traders who want to explore alternative energy-based signals.
Created by @Lukiano
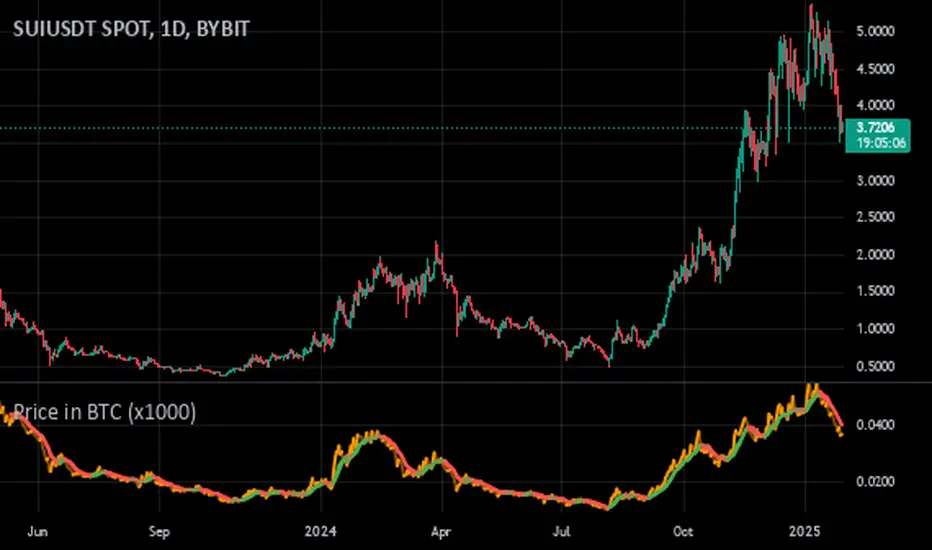
Price in BTC (x1000)I'm not a coder. I just knocked this together with AI
Shows how the current asset performed relative to BTC (COINBASE:BTCUSD) on the current timeframe
Works with assets priced in USD, USDT and USDC but you can easily add more
Had to multiply the price by 1000 to mitigate leading zeros and improve compatibility with low-denomination assets (e.g. PEPE)
MAs and crossovers included
Feel free to use it however you want
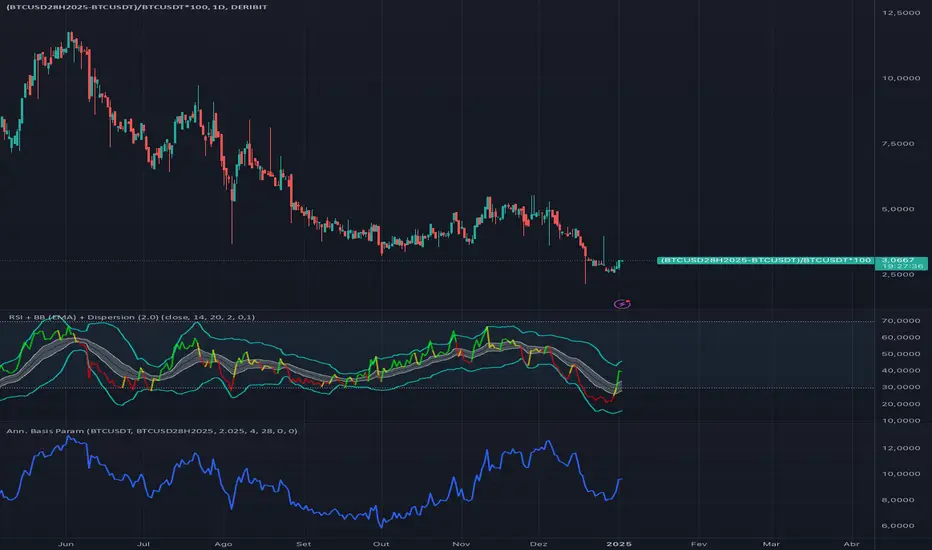
Cash and Carry: Annualized BTC Basis (Parametric)This indicator calculates the annualized BTC basis (premium or discount) between a specified futures contract and a given spot symbol. You can customize the spot ticker, the futures ticker, and the exact expiration date/time. As time moves toward expiration, the annualized yield (basis) will adjust accordingly. Ideal for monitoring potential arbitrage or cash-and-carry opportunities!
Atlantean Bitcoin Weekly Market Condition - Top/Bottom BTC Overview:
The "Atlantean Bitcoin Weekly Market Condition Detector - Top/Bottom BTC" is a specialized TradingView indicator designed to identify significant turning points in the Bitcoin market on a weekly basis. By analyzing long-term and short-term moving averages across two distinct resolutions, this indicator provides traders with valuable insights into potential market bottoms and tops, as well as the initiation of bull markets.
Key Features:
Market Bottom Detection: The script uses a combination of a simple moving average (SMA) and an exponential moving average (EMA) calculated over long and short periods to identify potential market bottoms. When these conditions are met, the script signals a "Market Bottom" label on the chart, indicating a possible buying opportunity.
Bull Market Start Indicator: When the short-term EMA crosses above the long-term SMA, it signals the beginning of a bull market. This is marked by a "Bull Market Start" label on the chart, helping traders to prepare for potential market upswings.
Market Top Detection: The script identifies potential market tops by analyzing the crossunder of long and short-term moving averages. A "Market Top" label is plotted, suggesting a potential selling point.
Customizable Moving Averages Display: Users can choose to display the moving averages used for detecting market tops and bottoms, providing additional insights into market conditions.
How It Works: The indicator operates by monitoring the interactions between the specified moving averages:
Market Bottom: Detected when the long-term SMA (adjusted by a factor of 0.745) crosses over the short-term EMA.
Bull Market Start: Detected when the short-term EMA crosses above the long-term SMA.
Market Top: Detected when the long-term SMA (adjusted by a factor of 2) crosses under the short-term SMA.
These conditions are highlighted on the chart, allowing traders to visualize significant market events and make informed decisions.
Intended Use: This indicator is best used on weekly Bitcoin charts. It’s designed to provide long-term market insights rather than short-term trading signals. Traders can use this tool to identify strategic entry and exit points during major market cycles. The optional display of moving averages can further enhance understanding of market dynamics.
Originality and Utility: Unlike many other indicators, this script not only highlights traditional market tops and bottoms but also identifies the aggressive start of bull markets, offering a comprehensive view of market conditions. The unique combination of adjusted moving averages makes this script a valuable tool for long-term Bitcoin traders.
Disclaimer: The signals provided by this indicator are based on historical data and mathematical calculations. They do not guarantee future market performance. Traders should use this tool as part of a broader trading strategy and consider other factors before making trading decisions. Not financial advice.
Happy Trading!
By Atlantean

Bitcoin Fundamentals - Bitcoin Block RewardThe Bitcoin Block Reward is the batch of new Bitcoins generated by the miners after solving each block.
The Block Reward is set as a basic rule and cannot be changed without agreement between the entire Bitcoin network. It started at 50 BTC during the first period. Afterwards the Block Reward gets adjusted to half of it value (Halving Event) on each cycle of 210000 blocks mined.
This is the only way that new bitcoins are created. It creates an incentive for miners to secure the network.
Over time the Block Reward will decreases to a value that might not cover the mining costs. At that point, the use of the Bitcoin Network might have increased sufficiently as to generate enough transaction fees to cover the mining costs.
MOTIVATION
Even though this is a very simple indicator, I'm currently missing a data source to compute the Block Reward value within Tradingview. Therefore, I created this indicator and its associated library function to enable its visualization and (eventually) for coders to make use of the source function to power more elaborate scripts related to the Halving Events.
Hope that helps!

(mab) Dynamic Bitcoin NVT SignalBitcoin`s NVT is calculated by dividing the Network Value (market cap) by the USD volume transmitted through the blockchain daily. Note this equivalent of the bitcoin token supply divided by the daily BTC value transmitted through the blockchain, NVT is technically inverse monetary velocity.
Credits go to Willy Woo for creating the Network Value Transaction Ratio (NVT). Credits go also to Dimitry Kalichkin improving NVT and creating the NVT Signal (NVTS).
According to its creator, the NVT Ratio is somewhat similar to the PE Ratio used in equity markets. When Bitcoin`s NVT is high, it indicates that its network valuation is outstripping the value being transmitted on its payment network, this can happen when the network is in high growth and investors are valuing it as a high return investment, or alternatively when the price is in an unsustainable bubble.
I created this indicator because the NVT indicator I was using suddenly stopped working. I tried a number of other NVT indicators, but all of them seem to have the same problem and stopped updating after a certain date. The cause is that the data feed from 'Quandl' that is used by most NVT indicators is no longer updated through the previous API.
Instead TradingView created a special API to access 'Quandl" data. This indicator not only uses the new API for 'Quandl', it can also access data from other providers like 'Glassnode', 'CoinMetrics' and 'IntoTheBlock'. However, the 'Quandl' data feed seems to produce the best results with this indicator.
The indicator provides dynamically adjusting overbought and oversold thresholds based on a two year moving average and standard devition with adjustable multipliers. It also implements alerts for NVT going into overbought, oversold or crossing the moving average.
Version 1.0
--
Version history
0.1 Beta
- Initial version
1.0
- First release

LMACD - Logarithmic MACD Weekly BTC Index [Logue]Logarithmic Moving Average Convergence Divergence (LMACD) Weekly Indicator - The LMACD is a momentum indicator that measures the strength of a trend using 12-period and 26-period moving averages. The weekly LMACD for this indicator is calculated by determining the difference between the log (base 10) of the 12-week and 26-week exponential moving averages. Larger positive numbers indicate a larger positive momentum.
For tops: The default setting for tops is based on decreasing "strength" of BTC tops. A decreasing linear function (trigger = slope * time + intercept) was fit to past cycle tops for this indicator and is used as the default to signal macro tops. The user can change the slope and intercept of the line by changing the slope and/or intercept factor. The user also has the option to indicate tops based on a horizontal line via a settings selection. This line default value is 0.125. This indicator is triggered for a top when the LMACD is above the trigger value.
For bottoms: Bottoms are displayed based on a horizontal line with a default setting of -0.07. The indicator is triggered for a bottom when the LMACD is below the bottom trigger value.

PDM - Plus Directional Movement Weekly BTC Index [Logue]Plus Directional Movement (PDM) weekly BTC index - The PDM is a momentum indicator that measures the strength of a trend in the positive direction. The weekly PDM is calculated by determining the difference between the week's high price and the previous week's high price smoothed by a 14-period moving average. Higher PDM values indicate higher momentum in the positive (higher price) direction. The default triggers for this indicator are PDM values above 55 for tops and below 14 for bottoms.

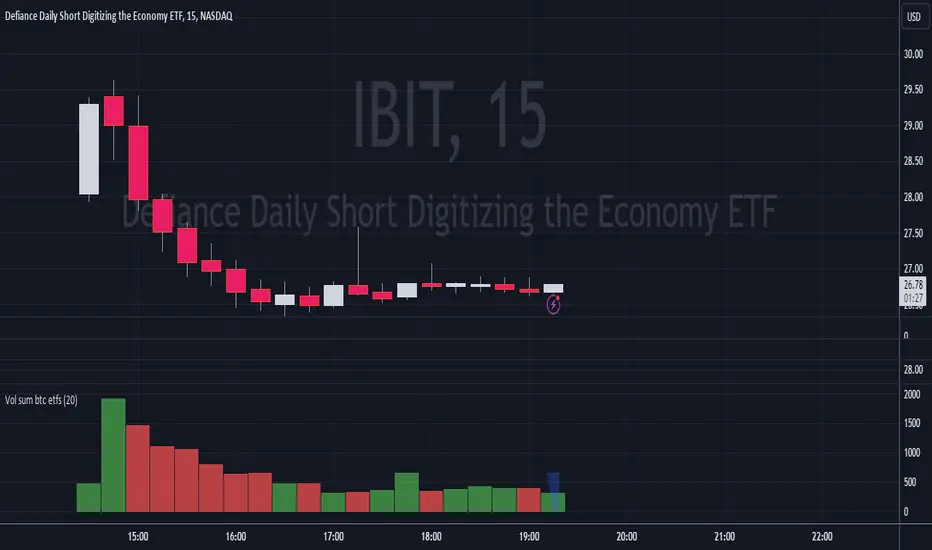
Volume Sum BTC ETFsThis volume indicator tracks the volume of these 10 bitcoin ETFS:
AMEX:GBTC, NASDAQ:IBIT, AMEX:BTCO, AMEX:ARKB, AMEX:HODL, AMEX:EZBC, NASDAQ:BRRR, AMEX:BTCW, AMEX:DEFI, AMEX:BITB
It multiplies the traded shares with the hl2 share price and then devides the volume by the bitcoin hl2 price.
You can change to usd volume in settings.
Enjoy!
Notice that historical volume comes from etfs which traded already before launch like GBTC.
Also notice that that btc trades also when tradfi markets are closed, so then the indicator will show the last available volume. Something to fix later.
Realized price for BTC, ETH, LTCThis script calculates the realized price of BTC/ETH/LTC and shows a signal when the market price falls below the realized price - which can be signal a for potential market bottom. The realized price calculation is based on Glassnode data MVRV ratio.
- Realized Price is the average price of the Bitcoin supply, valued at the day each coin last transacted on-chain. This is often considered the 'on-chain cost basis' of the market.
- MVRV Ratio is the ratio between the market value (MV, spot price) and the Realized value (RV, realized price), allowing for a visualization of Bitcoin market cycles, and profitability.
Calculations:
REALIZED PRICE = REALIZED MARKET CAP / CIRCULATION SUPPLY
REALIZED MARKET CAP = 1 / MVRV * MARKET CAP
It's working with BTCUSD, ETHUSD, LTCUSD tickers only.

Fierytrading: Volatility DepthDear Tradingview community,
I'd like to share one of my staple indicators with you. The volatility depth indicator calculates the volatility over a 7-day period and plots it on your chart.
This indicator only works for the DAILY chart on BTC/USD.
Colors
I've color coded the indicator as follows:
- Red: Extreme Volatility
- Orange: High Volatility
- Yellow: Normal Volatility
- Green: Low Volatility
Red: extreme changes in price. Often during local tops and bottoms.
Orange: higher than average moves in price. Often before or after a "red" period. Often seen in the middle of bear or bull markets.
Yellow: normal price action. Often seen during early stage bull-markets and late stage bear-markets.
Green: very low price movement. Often during times of indecision. Once this indicator becomes green, you can expect a big move in either direction. Low volatility is always followed by high volatility.
In a long-term uptrend, a green period often signals a bullish break out. In a long-term downtrend it often signals a bearish break out.
How to use
Save the indicator and apply it to your chart. You can change the length in the settings, but it's optimized for 7 days, so no need to change it.
I've build in alerts for all 4 different volatility periods. In most cases, the low volatility alert is enough.
Good luck!

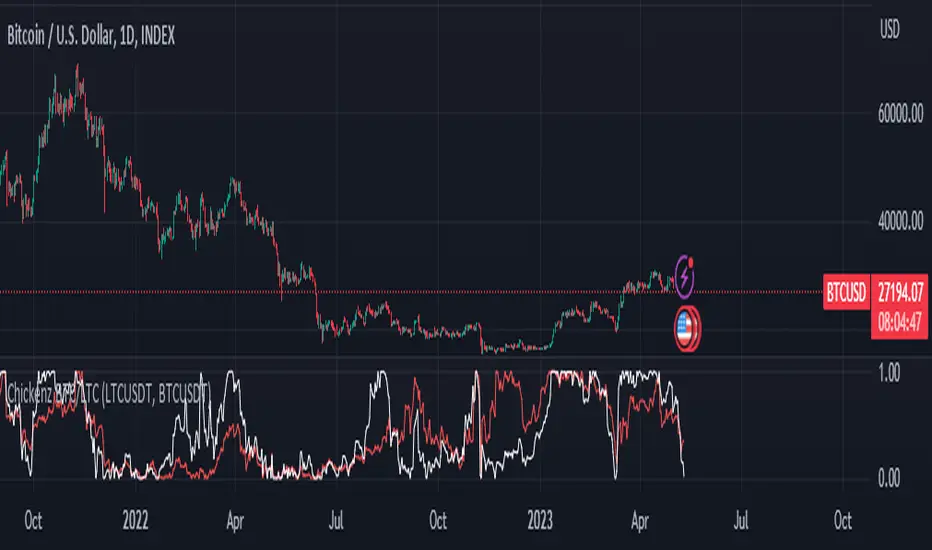
Chickenz Compare performance of 2 Tickers (Default - BTC/LTC)Compare relative performance of 2 Tickers directly on one chart. Default BTC/LTC but can be adjusted to any pair.
First attempt at pine scripts so go gentle on feedback ;)
Altcoin Dominance (without ETH) Excluding Stablecoins UnsymetricAltcoin Dominance (without ETH) Excluding Stablecoins Unsymetric
The purpose of the script is to show Altcoin's strength without Ethereum once we exclude stablecoins.
So we look into all altcoins besides eth and besides stablecoins divided by a value of eth+btc
