YinYang Fear and Greed Index (FGI)Overview:
YinYang Fear and Greed Index is used for seeing how people are feeling towards the current price. It works similar to an RSI, but fluctuates differently. Essentially you want to be Greedy when the Index displays Fear and Fearful when it displays Greed. Our Indicator displays a Green Circle (Greed Signal) on the YinYang Fear and Greed Index when there is a large amount of Greed at this price point. It displays a Red Circle (Fear Signal) when there is a large amount of Fear. The Fear and Greed Signals can happen at any Fear and Greed Index but generally they correlate with the Index level. The Fear and Greed Signals are much more important at dictating a swing in momentum than the actual Index itself. The Index is more of a guide and is useful for seeing when the Index level crosses the Ma (the yellow line) as you can see a shift in momentum. However for large swings in momentum, the Fear and Greed Signals should be used. Do NOT Ignore these signals, they are quite powerful at predicting momentum swings.
Tutorial:
As you can see, the Fear and Greed Index looks somewhat similar to an RSI, but it has the ability to gain drastic momentum when there are strong changes in Fear and Greed.
When it comes to identifying buy/sell locations you generally want to ensure 2 things:
For a buy, the Fear and Greed Index (FGI) is less than 30.
For a sell, the FGI is greater than 70.
A signal has occurred. For buy that is the red circle and for sell that is the green circle.
The reason we generally want to ensure these 2 rules is to ensure you have the highest chance of being right with the lowest risk of being wrong. The way you want to use this indicator is; Be Fearful when others are Greedy and Greedy when others are Fearful.
There will be times when a fear or greed signal appears when the index is between 30-70. When these occur, they are still generally strong signal locations that represent a high chance of momentum in the direction they signal, however they face a higher risk of being wrong and therefore shouldn’t be used on its own to make a trade.
In the photo above we can see that the FGI’s color changed from Red to Orange in the candle after the Fear Signal. This happened because there was high price movement right after it (which is normal) and caused the Fear level to drop.
The color the FGI displays is based not off the FGI but by the STATE it is currently in. When the color is Green it is in a state of HIGH GREED, when the color is Red it is in a state of HIGH FEAR. When the color is Teal it is in a state of SLIGHT GREED, when the color is Orange it is in a state of SLIGHT FEAR. These colors hold true for the Information Tables as well.
As we can also see from the example above, it is 100% possible to have a state of HIGH GREED when the FGI is low. For instance look at the Fear (BUY) signals circled. Right before the Fear Signals happened, it was in a state of HIGH GREED (Green). The opposite is also true with Fear. We can have a high state of Fear when the FGI is high. However, please do remember, the lowest risk and best time to make trades is still:
FGI is higher than 70 and there is a Greed Signal = SELL
FGI is lower than 30 and there is a Fear Signal = BUY
You may notice there are sometimes occurrences that we call ‘Oddballs’. These oddballs are quite rare but they do happen and when they do they’re generally in clusters (close together). These Oddballs are when a Greed Signal occurs when the FGI is very low or when a Fear Signal occurs when the FGI is very high. Basically, they are occurring in the opposite location that they are supposed to. These may not seem like they matter but they matter a lot. As you can see based on where the blue vertical lines are, the price moved in the direction the signal identified shortly after the signal.
You may be wondering, are Oddball’s stronger price influencers than the regular signal? The issue with Oddballs is they sometimes CAN BE. But generally they aren’t. They generally do signal price movement will occur in the direction they are influencing, but generally not as much movement as if it occurred properly (Fear signal under 30 or Greed signal above 70).
The takeaway from Oddballs is to acknowledge their existence and potentially use them as markers for smaller purchases or DCA locations. We don’t recommend treating them as a legitimate purchase signal as they generally are weaker and less predictable, but nevertheless don’t dismiss them.
Our Information Tables are there to show you the FGI on 6 different Time Frames at the same time. This can be very useful for knowing how the other Time Frames are fairing while you are trading without needing to constantly change the Time Frame you are on.
For example, you see a Fear Signal on the 1 Day Time Frame, you then swap to the 15 minute Time Frame to find your entry location. Well, once you’re locked into that trade, you’ll likely be fixated on the 15 minute Time Frame. There’s a chance while you’re still waiting for your exit that levels and states of the FGI could change on higher Time Frames. This could drastically influence when and where your exit on the lower Time Frame should be.
This concludes our Tutorial on how to use YinYang Fear and Greed Index (FGI). However, continue reading for a description and better understanding of the Settings available to you for customization within this Indicator.
Settings:
1. Information Tables:
1.1. Show Information Tables:
Our Information Tables display 6 different Time Frames (resolutions) so that you can see the current level of Fear and Greed (FGI) that is prevalent on each Time Frame. There are 4 different states the FGI can be in:
Fear (Red)
Minor Fear (Orange)
Greed (Green)
Minor Greed (Teal)
The color of each Time Frame Cell (on Oscillator and in the table) is based on the following:
Red: Red represents that it is currently in a state of Fear. When it is in a state of fear it means traders are being overly bearish and selling when they likely shouldn’t. While it is in a state of Fear, there is a high chance of BULLISH price movement occurring. Remember, Be Fearful when others are Greedy and Greedy when others are Fearful.
Orange: Orange represents that it is currently in a state of Minor Fear. Minor Fear means that the FGI is less than 50, but it’s not currently in a state of Fear or Greed. While it is in this state, there is a better chance for BULLISH price action than there is bearish but it's nowhere near as likely as when in a state of Fear.
Green: Green represents that it is currently in a state of Greed. When it is in a state of Greed, it means traders are being overly bullish and buying when they shouldn’t. While it is in a state of Greed, there is a high chance of BEARISH price movement occurring.
Teal: Teal represents that it is currently in a state of Minor Greed. Minor Greed means that the FGI is greater than 50, but it’s not currently in a state of Fear or Greed. While it is in this state, there is a better chance for BEARISH price actions than there is bullish; but it’s nowhere near as likely as when its in a state of Greed.
2. Res1 / Res2/ Res3 / Res4 / Res5 / Res6:
These represent the different resolutions (Time Frames) being used in your information tables and can be modified to display whatever resolution works best for your trading style. By default they are:
Res1: Current Timeframe
Res2: 15 Minute
Res3: 1 Hour
Res4: 4 Hour
Res5: 1 Day
Res6: 1 Week
Backup Res (not changeable): 5 Minute (this is only used if your Current Timeframe in Res1 is a duplicate of one of the other resolutions)
Our Fear and Greed Index can be very useful for understanding how people are feeling in the market and when large price swings will occur. Remember, Be Greedy when others are Fearful and Fearful when others are Greedy!
If you have any Questions or Concerns, don’t hesitate to contact us.
HAPPY TRADING!
Recherche dans les scripts pour "Buy sell"

thuyliemforever EMA Scalper - Buy/Sellthuyliemforever EMA Scalper - Buy/Sell
Indicator that help you make decision buy or sell.

MM SIGMA STC+ADXThe Schaff Trend Cycle (STC) is a charting indicator that is commonly used to identify market trends and provide buy and sell signals to traders. Developed in 1999 by noted currency trader Doug Schaff, STC is a type of oscillator and is based on the assumption that, regardless of time frame, currency trends accelerate and decelerate in cyclical patterns.12
How STC Works
Many traders are familiar with the moving average convergence/divergence (MACD) charting tool, which is an indicator that is used to forecast price action and is notorious for lagging due to its slow responsive signal line . By contrast, STC’s signal line enables it to detect trends sooner. In fact, it typically identifies up and downtrends long before MACD indicator.
While STC is computed using the same exponential moving averages as MACD, it adds a novel cycle component to improve accuracy and reliability. While MACD is simply computed using a series of moving average, the cycle aspect of STC is based on time (e.g., number of days).
It should also be noted that, although STC was developed primarily for fast currency markets, it may be effectively employed across all markets, just like MACD. It can be applied to intraday charts, such as five minutes or one-hour charts, as well as daily, weekly, or monthly time frames.
Introduction to ADX
ADX is used to quantify trend strength. ADX calculations are based on a moving average of price range expansion over a given period of time. The default setting is 14 bars, although other time periods can be used.1 ADX can be used on any trading vehicle such as stocks, mutual funds, exchange-traded funds and futures.
ADX is plotted as a single line with values ranging from a low of zero to a high of 100. ADX is non-directional; it registers trend strength whether price is trending up or down.2 The indicator is usually plotted in the same window as the two directional movement indicator (DMI) lines, from which ADX is derived (shown below).Quantifying Trend Strength
ADX values help traders identify the strongest and most profitable trends to trade. The values are also important for distinguishing between trending and non-trending conditions. Many traders will use ADX readings above 25 to suggest that the trend is strong enough for trend-trading strategies. Conversely, when ADX is below 25, many will avoid trend-trading strategies.
ADX Value Trend Strength
0-25 Absent or Weak Trend
25-50 Strong Trend
50-75 Very Strong Trend
75-100 Extremely Strong Trend
Low ADX is usually a sign of accumulation or distribution. When ADX is below 25 for more than 30 bars, price enters range conditions, and price patterns are often easier to identify. Price then moves up and down between resistance and support to find selling and buying interest, respectively. From low ADX conditions, price will eventually break out into a trend. Below, the price moves from a low ADX price channel to an uptrend with strong ADX.
Added Buy/Sell alerts
ADX filters based on the threshold you put in the settings.
great for trend and trade confirmation

Long Term Buy/Sell Signal by BonyThis script attempts to use Exponential Moving averages (short-term and long-term convergence) of different lengths in order to identify trade entries and exits for bullish & bearish trades. I would strongly recommend using this as a guide to enter or exit long-term swing trades on growth names such as Apple, Tesla, Microsoft to keep your emotions out of the trading. You use this script by entering a trade when it signals a green BUY signal with a UP arrow and exiting when it signals red. The general idea is that one is fast and one is slow-moving EMA and these indicate when to buy/sell when they crossover the overbought/sold lines.
Disclaimer:
This script is for educational purposes only. The market is always moving up or down, so always trade with caution and use your best judgment for every trade.

ExpertToken Buy/Sell SignalExpertToken Buy/Sell Signal เป็นอินดิเคเตอร์ที่สามารถบอกสัญญาณการซื้อขาย และบอกแนวโน้มของราคาได้
หลักการทำงาน
สัญญาณ Buy/Sell ถูกกำหนดโดยการใช่ CCI วัดโมเมนตัมการซื้อขาย หาก CCI ส่งสัญญาณว่าแรงขายเยอะเกินไป และมีแนวโน้มราคาจะกลับตัวสูงขึ้น ก็จะส่งสัญญาณ Buy แต่หาก CCI ส่งสัญญาณว่าแรงซื้อเยอะเกินไป และมีแนวโน้มราคาจะกลับตัวต่ำลง ก็จะส่งสัญญาณ Buy
เส้นสีน้ำเงินเป็นเส้น EMA 200 ไว้ใช้บอกแนวโน้มระยะยาว
เมฆขาว ประกอบไปด้วย เส้นสีเขียว(เส้น EMA เคลื่อนที่เร็ว) และเส้นสีแดง(เส้น EMA เคลื่อนที่ช้า) โดยให้ทั้งสองเส้นตัดกันเพื่อบอกสัญญาณการกลับตัว ค่าเริ่มต้นของทั้งสองเส้นเป็น 20, 50
วิธีการใช้อินดิเคเตอร์
ขั้นตอนแรก ให้ดูเส้นสีน้ำ หากราคาอยู่เหนือเส้นสีน้ำเงิน อาจมีแนวโน้มที่ราคาจะขึ้น
ขั้นตอนที่สอง ให้ดูเมฆ ที่ถูกสร้างขึ้นโดยการน้ำเส้น EMA 2 เส้น สีเขียวและสีแดง หากเส้นสีเขียวอยู่เหนือเส้นสีแดง ราคาอาจมีแนวโน้มที่ขึ้น หากเส้นสีแดงอยู่เหนือเส้นสีเขียว ราคาอาจจะลง แต่ถ้าหากราคาอยู่ในโซนเมฆขาว(ราคาอยู่ระหว่างเส้นเขียวกับสีแดง) ราคาอยู่ในช่วงเป็นกลาง
สุดท้าย หากมีข้อความบอกสัญญาณบอกว่า Buy หรือ Sell ให้พิจารณาจากสองขั้นตอนก่อนหน้านี้ หากมันสอดคล่องกับสองขั้นตอนก่อนหน้านี้ ให้พิจารณาการเปิดตำแหน่งตามสัญญาณ
################################################################################################
ExpertToken Buy/Sell Signal is an indicator that can give you trading signals. and tell the trend of the price
How it works
Buy/Sell signals are determined by using CCI to measure trading momentum.
If CCI signals too much selling pressure and there is a tendency for the price to reverse higher It sends a buy signal, but if CCI signals that it is overbought and the price tends to reverse lower will send signal Buy
The blue line is the EMA 200 line to indicate a long-term trend.
The white cloud consists of a green line (fast moving EMA line) and a red line (slow moving EMA line), with the two lines intersecting to signal a reversal. The default values for both lines are 20, 50.
How to use the indicator
The first step is to look at the watercolor lines. If the price is above the blue line There may be a tendency for prices to go up.
The second step is to look at the clouds that are created by watering the 2 EMA lines, green and red. If the green line is above the red line The price may tend to go up. If the red line is above the green line, the price may go down, but if the price is in the white cloud zone (the price is between the green and red line), the price is in the neutral range.
Finally, if there is a signal to say Buy or Sell, consider the previous two steps. If it complies with the previous two steps Consider opening a position based on a signal.

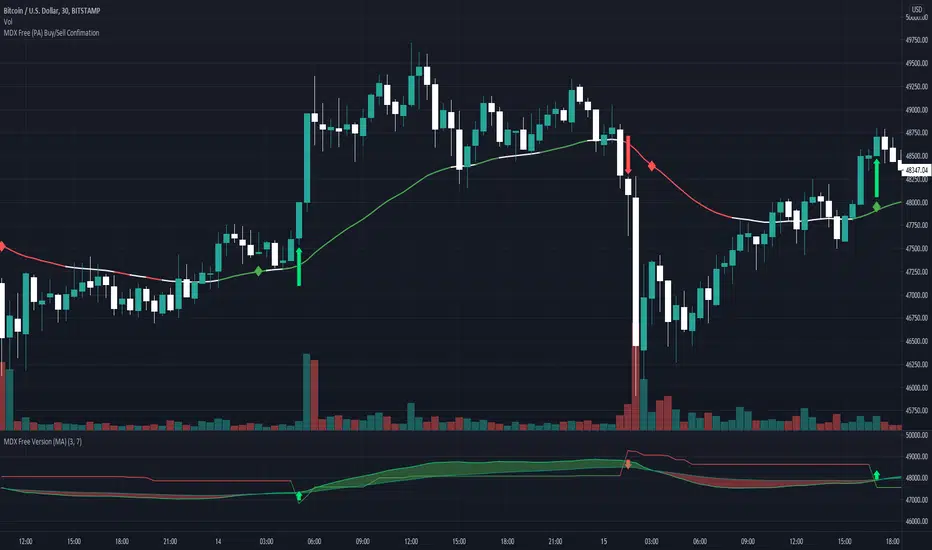
MDX Free (PA) Buy/Sell ConfimationThis is a free version of the MDX Crypto trading "bot". Note that this indicator and the MDX version are based on simple code available on trading view or via google search.
This indicator is based on the super trend indicator to provide buy/sell signals at inflection points of uptrends and downtrends. These inflection points are commonly used as entry/exit points for trading. They are represented on the chart as green (buy) or red (sell) arrow.
This also uses two exponential moving averages. One average is set over 21 bars (fast) and the other is set over 55 bars (slow). When the plots intersect it represents a change in momentum. This is shown on the chart as a red (negative change) or green (positive change) diamonds. When a green diamond follows a green arrow it is considered a confirmed buy. When a red diamond follows a red arrow it is a confirmed sell.
Caution:
Caution this indicator is not reliable on its own, especially on low time scales. When looking back in time this indicator will almost always show a "confirmed buy" before a large increase in price, but on many occasions you can have a "confirmed buy" which is followed by a dump in price, that will not trigger sell signal in time. For best results use with 15m to 1h timeframes
Disclaimer:
This indicator is for informational purposes and should be used for educational purposes only. If you rely on this for trading without additional information you will loose money. I am not a financial advisor, or a professional trader. Use at your own risk.
This is an unpolished version. It may be updated and the source code published if it is used.
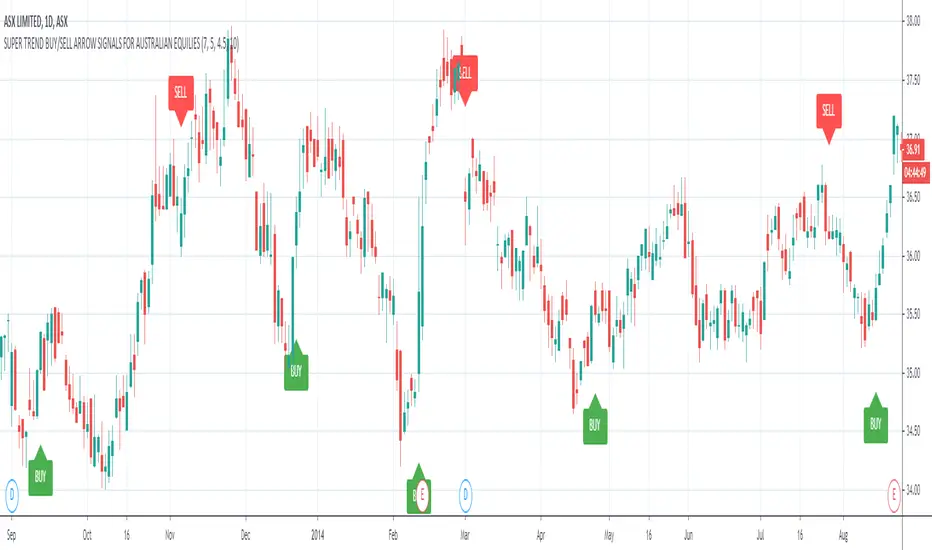
ASX Buy/Sell Arrow Signals For Australian Equities TradingASX Buy/Sell Arrow Signals For Australian Equities Trading.
ASX:ASX
This indicator is specifically designed to trade on assets on the Australian Stock Exchange.
The indicator analyzes historical data and predicts short-term trends and reversal points, as well as generates alert Buy/Sell or Long/Short trading signals.
A distinctive feature of this indicator is that the signals are filtered and high-precision signals are displayed.
The script is useful for trading as an independent trading system, as well as in combination with other indicators, as an addition to any existent trading system.
This script was compiled at the request of our subscribers and we hope it will be useful in trading.
The indicator uses a combination of few popular indicators such as MACD, RSI, Moving Averages.
Recommended for trading on timeframes: D1, W1.
Volume Based Buy/SellThis is my very first scrip on this platform. It's the first version of the script, It works on the volume-based moving averages and exponential moving average.
I have added the buy/sell signals for educational purposes only. While adding the buy/sell signal I have an additional check on the strength of the trend to reduce loss to a minimum.
How to use:
1. Use with Heikin Ashi Chart.
2. Use 15 Min timeframe for intraday.
Some improvements I am working in the near future is:
1. Exit tread with the maximum profit.
2. Reduce down false trad to 0%.
To encourage and support please like the script try using for your own paper trading.
Dont forget to leave a comment on if you see any improvement in the script or any idea you have. Happy treading together.

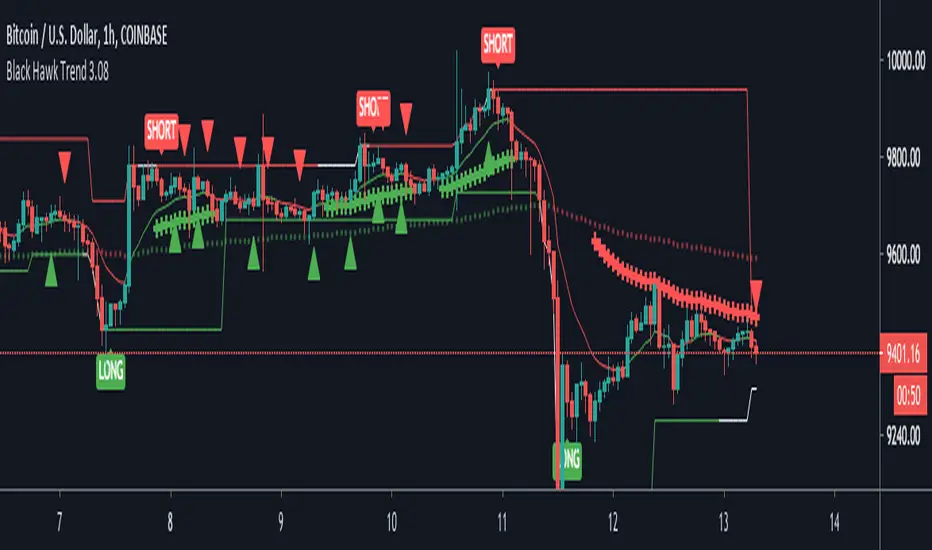
Black Hawk Trend 3The Black Hawk Trend indicator uses data from sources (such as EMAs, RSI, Stochs) to derive a trend direction. This indicator contains a pivot line that turns green when there is a buy position (lower bar) and it turns red when there is an active sell position (upper bar).
When there is a buy/sell signal, this does not mean buy immediately at this point, but rather look for a potential entry.
This indicator has the ability to treat buy and sells separately (Default: 2 account method) or it can use them in tandem (1 account method).
There is a toggle in the settings to modify the code for Bitcoin vs Forex (& Stocks).
When there is a strong trend, a red/green “+” sign shows up; this typically means take caution when trying to take a position countertrend.
There are also red/green triangles that signify a potential area to add to a position.
#Disclaimer:
1. I am not a financial advisor.
2. I do not guarantee this script will provide consistent profits or that anyone can make money with it.
Use the link below to obtain access to this indicator.
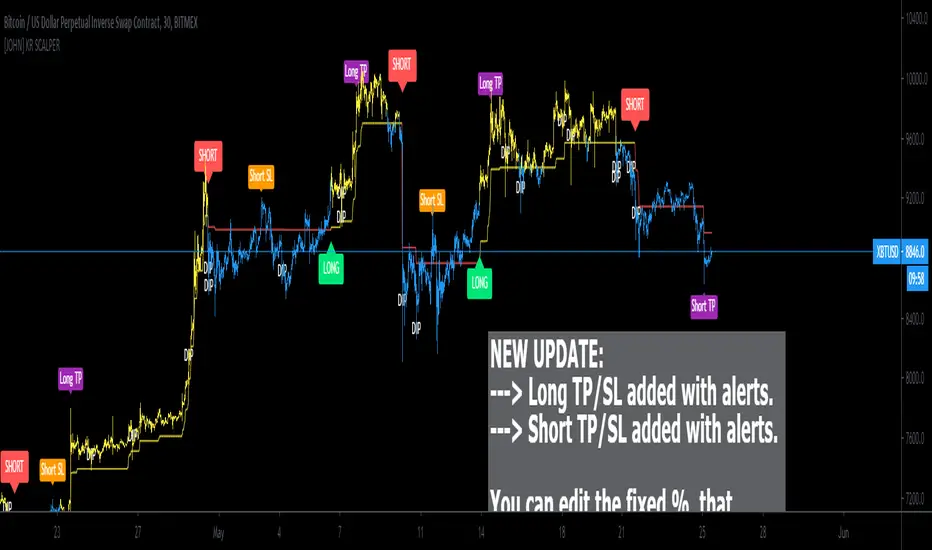
[JOHN] KR SCALPERHello this is KR SCALPER indicator. (work on crypto market)
---------------------------------
How this indicator work?
KR SCALPER script work with bollinger bands, price volatility and ATR (average true range).
This system provide
- HIGH QUALITY BUY/SELL Signals with a reasonable ROI.
- DIPS noted on chart with "DIP" TEXT, thanks to the use of bbands parameters.
- Work in cryptocurrency market, tested with top 10 coins, with good results.
- Tested on LTF (from 5m to 1h), work even on 4h, 1d.
How use it?
Indicator is setup for cryptocurrency. You can long and short by following the indications below:
GREEN LABEL = LONG
RED LABEL = SHORT
DIP noted on chart
This system write on chart with "DIP" text whenever a decrease of price/selloff occour, usually a good place to make attention if you are looking for a trade.
This is possible with the use of Bbands that helped me on this add.
Below some timeframes examples.
5 minute chart
15 minute chart
1H timeframe chart
4H timeframe chart
Below ETH USD 4H timeframe chart for reference.
----------------------------------
I hope you like and enjoy.
Good trading traders!
[astropark] ALGO Trading V3 [alarms]Dear Followers,
today another awesome Swing and Scalping Trading Strategy indicator, runnable on a bot , which works great on many timeframes (from 1h and above is suggested), just write me in order to help you find correct settings).
It must be said that this strategy works even better on 1m Renko chart!
If you are a scalper or you are a swing trader, you will love suggested entries for fast and long-lasting profit.
Keep in mind that a proper trailing stop strategy and risk management and money management strategies are very important (DM me if you need any clarification on these points).
This is not an evolution of "ALGO Trading V1" or "ALGO Trading V2" , but a twin sister of them.
For your reference, here it is the "ALGO Trading V1" indicator
and here the "ALGO Trading V2"
This strategy has the following options:
enable/disable signals on chart
enable/disable bars and background coloring based on trend
enable/disable a "filter noise" option , which try to reduce overtrading (you can easily check it on backtesting)
enable/disable a Take Profit / Stop Loss option (you can easily check it on backtesting too)
enable/disable a secret SmartOption which may improve profit on your chart (again, check it on you chart if it helps or not)
This strategy only trigger 1 buy or 1 sell. If you enable Take Profit / Stop Loss option, consider that many TP can be triggered before trend reversal, so take partial profit on every TP an eventually buy/sell back lower/higher to maximize your profit.
This script will let you set all notifications you may need in order to be alerted on each triggered signals.
The one for backtesting purpose can be found by searching for the astropark's "ALGO Trading V3" and then choosing the indicator with "strategy" suffix in the name, or you can find here below
Strategy results are calculated on the time window from 1995 to now, so on more than 15 years, using 1000$ as initial capital and working at 1x leverage (so no leverage at all! If you like to use leverage, be sure to use a safe option, like 3x or 5x at most in order to have liquidation price very far).
This is not the "Holy Grail", so use a proper risk management strategy.
This script will let you backtest how the indicator will perform on any chart and timeframe you may like to test and/or trade. Of course results will be very different depending on the chart and timeframe you will open. I tested a lot of charts and always you can find a combination that keep this strategy in profit on swing trading style (and this means that if you can have a daily look at the chart you can always manage to maximize your profit on each trade!)
This is a premium indicator , so send me a private message in order to get access to this script.

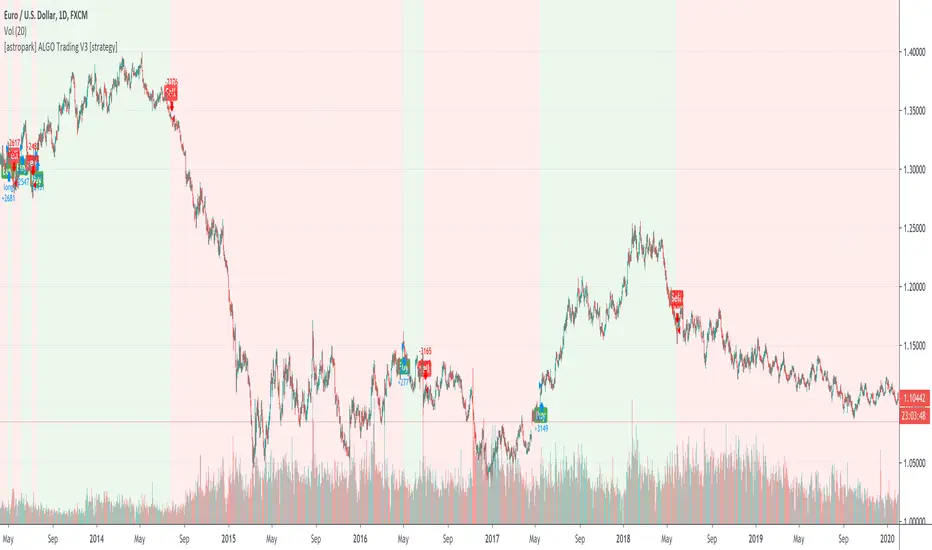
[astropark] ALGO Trading V3 [strategy]Dear Followers,
today another awesome Swing and Scalping Trading Strategy indicator, runnable on a bot , which works great on many timeframes (from 1h and above is suggested), just write me in order to help you find correct settings).
It must be said that this strategy works even better on 1m Renko chart!
If you are a scalper or you are a swing trader, you will love suggested entries for fast and long-lasting profit.
Keep in mind that a proper trailing stop strategy and risk management and money management strategies are very important (DM me if you need any clarification on these points).
This is not an evolution of "ALGO Trading V1" or "ALGO Trading V2" , but a twin sister of them.
For your reference, here it is the "ALGO Trading V1" indicator
and here the "ALGO Trading V2"
This strategy has the following options:
enable/disable signals on chart
enable/disable bars and background coloring based on trend
enable/disable a "filter noise" option , which try to reduce overtrading (you can easily check it on backtesting)
enable/disable a Take Profit / Stop Loss option (you can easily check it on backtesting too)
enable/disable a secret SmartOption which may improve profit on your chart (again, check it on you chart if it helps or not)
This strategy only trigger 1 buy or 1 sell. If you enable Take Profit / Stop Loss option, consider that many TP can be triggered before trend reversal, so take partial profit on every TP an eventually buy/sell back lower/higher to maximize your profit.
In order to get notified when a signal is triggered, you need to use the "alarms" version of this indicator (just search for astropark's "ALGO Trading V3" indicator and choose the one with "alarms" suffix).
Strategy results are calculated on the time window from 1995 to now, so on more than 15 years, using 1000$ as initial capital and working at 1x leverage (so no leverage at all! If you like to use leverage, be sure to use a safe option, like 3x or 5x at most in order to have liquidation price very far).
This is not the "Holy Grail", so use a proper risk management strategy.
This script will let you backtest how the indicator will perform on any chart and timeframe you may like to test and/or trade. Of course results will be very different depending on the chart and timeframe you will open. I tested a lot of charts and always you can find a combination that keep this strategy in profit on swing trading style (and this means that if you can have a daily look at the chart you can always manage to maximize your profit on each trade!)
This is a premium indicator , so send me a private message in order to get access to this script.
[astropark] ALGO Trading V2 [alarms]Dear Followers,
today another awesome Swing and Scalping Trading Strategy indicator, runnable on a bot , which works great on many timeframes (ones between 1h and 1D are suggested, but just write me in order to help you find correct settings).
It must be said that this strategy works even better on 1m Renko chart!
If you are a scalper or you are a swing trader, you will love suggested entries for fast and long-lasting profit.
Keep in mind that a proper trailing stop strategy and risk management and money management strategies are very important (DM me if you need any clarification on these points).
This is not an evolution of "ALGO Trading V1" or "ALGO Trading V3" , but a twin sister of them. Search them on TradingView to know them better.
Here you can find ALGO Trading V1
This strategy has the following options:
enable/disable signals on chart
enable/disable bars and background coloring based on trend
enable/disable a "filter noise" option , which try to reduce overtrading (you can easily check it on backtesting)
enable/disable a Take Profit / Stop Loss option (you can easily check it on backtesting too)
enable/disable a secret SmartOption which may improve profit on your chart (again, check it on you chart if it helps or not)
This strategy only trigger 1 buy or 1 sell. If you enable Take Profit / Stop Loss option, consider that many TP can be triggered before trend reversal, so take partial profit on every TP an eventually buy/sell back lower/higher to maximize your profit.
This script will let you set all notifications you may need in order to be alerted on each triggered signals.
The one for backtesting purpose can be found by searching for the astropark's "ALGO Trading V2" and then choosing the indicator with "strategy" suffix in the name, or you can find here below
Strategy results are calculated on the time window from January 2018 to now, so on more than 2 years, using 1000$ as initial capital and working at 1x leverage (so no leverage at all! If you like to use leverage, be sure to use a safe option, like 3x or 5x at most in order to have liquidation price very far).
This is not the "Holy Grail", so use a proper risk management strategy.
This is a premium indicator , so send me a private message in order to get access to this script.

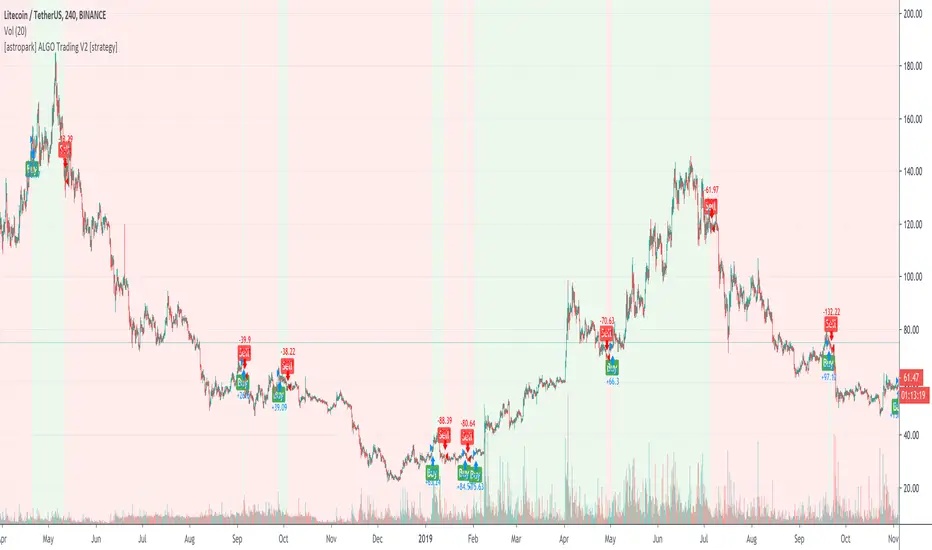
[astropark] ALGO Trading V2 [strategy]Dear Followers,
today another awesome Swing and Scalping Trading Strategy indicator, runnable on a bot , which works great on many timeframes (ones between 1h and 1D are suggested, but just write me in order to help you find correct settings).
It must be said that this strategy works even better on 1m Renko chart!
If you are a scalper or you are a swing trader, you will love suggested entries for fast and long-lasting profit.
Keep in mind that a proper trailing stop strategy and risk management and money management strategies are very important (DM me if you need any clarification on these points).
This is not an evolution of "ALGO Trading V1" or "ALGO Trading V3" , but a twin sister of them. Search them on TradingView to know them better.
Here you can find ALGO Trading V1
This strategy has the following options:
enable/disable signals on chart
enable/disable bars and background coloring based on trend
enable/disable a "filter noise" option , which try to reduce overtrading (you can easily check it on backtesting)
enable/disable a Take Profit / Stop Loss option (you can easily check it on backtesting too)
enable/disable a secret SmartOption which may improve profit on your chart (again, check it on you chart if it helps or not)
This strategy only trigger 1 buy or 1 sell. If you enable Take Profit / Stop Loss option, consider that many TP can be triggered before trend reversal, so take partial profit on every TP an eventually buy/sell back lower/higher to maximize your profit.
In order to get notified when a signal is triggered, you need to use the "alarms" version of this indicator (just search for astropark's "ALGO Trading V2" indicator and choose the one with "alarms" suffix).
Strategy results are calculated on the time window from January 2019 to now, so on more than 1 year, using 1000$ as initial capital and working at 1x leverage (so no leverage at all! If you like to use leverage, be sure to use a safe option, like 3x or 5x at most in order to have liquidation price very far).
This is not the "Holy Grail", so use a proper risk management strategy.
This script will let you backtest how the indicator will perform on any chart and timeframe you may like to test and/or trade. Of course results will be very different depending on the chart and timeframe you will open. I tested a lot of charts and always you can find a combination that keep this strategy in profit on swing trading style (and this means that if you can have a daily look at the chart you can always manage to maximize your profit on each trade!)
This is a premium indicator , so send me a private message in order to get access to this script.
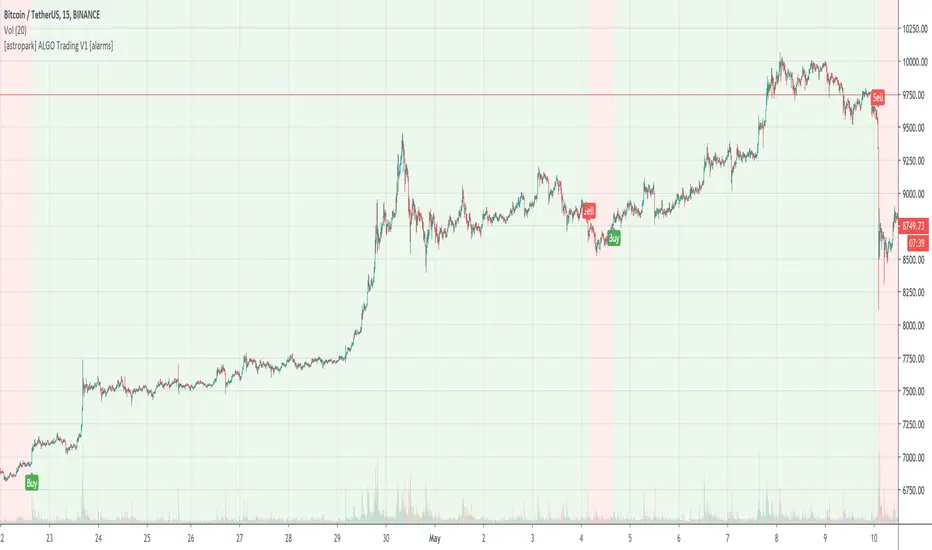
[astropark] ALGO Trading V1 [alarms]Dear Followers,
today another awesome Swing and Scalping Trading Strategy indicator, runnable on a bot , which works great on Low Timeframes (1h is suggested) but also on even lower ones (till 15m) and on higher ones (no further than 1D), just write me in order to help you find correct settings).
It must be said that this strategy works even better on 1m Renko chart!
If you are a scalper or you are a swing trader, you will love suggested entries for fast and long-lasting profit.
Keep in mind that a proper trailing stop strategy and risk management and money management strategies are very important (DM me if you need any clarification on these points).
This is not an evolution of "ALGO Trading V2" or "ALGO Trading V3" , but a twin sister of them. Search them on TradingView to know them better.
This strategy has the following options:
enable/disable signals on chart
enable/disable bars and background coloring based on trend
enable/disable a "filter noise" option , which try to reduce overtrading (you can easily check it on backtesting)
enable/disable a Take Profit / Stop Loss option (you can easily check it on backtesting too)
enable/disable a secret SmartOption which may improve profit on your chart (again, check it on you chart if it helps or not)
This strategy only trigger 1 buy or 1 sell. If you enable Take Profit / Stop Loss option, consider that many TP can be triggered before trend reversal, so take partial profit on every TP an eventually buy/sell back lower/higher to maximize your profit.
This script will let you set all notifications you may need in order to be alerted on each triggered signals.
The one for backtesting purpose can be found by searching for the astropark's "ALGO Trading V1" and then choosing the indicator with "strategy" suffix in the name, or you can find here below
Strategy results are calculated on the time window from January 2019 to now, so on more than 1 year, using 1000$ as initial capital and working at 1x leverage (so no leverage at all! If you like to use leverage, be sure to use a safe option, like 3x or 5x at most in order to have liquidation price very far).
This is not the "Holy Grail", so use a proper risk management strategy.
This is a premium indicator , so send me a private message in order to get access to this script.
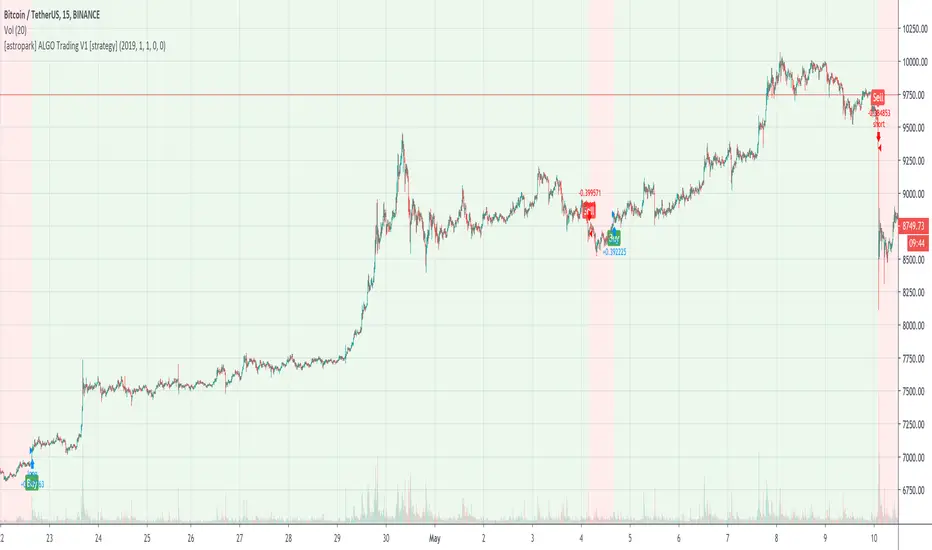
[astropark] ALGO Trading V1 [strategy]Dear Followers,
today another awesome Swing and Scalping Trading Strategy indicator, runnable on a bot , which works great on Low Timeframes (1h is suggested) but also on even lower ones (till 15m) and on higher ones (no further than 1D), just write me in order to help you find correct settings).
It must be said that this strategy works even better on 1m Renko chart!
If you are a scalper or you are a swing trader, you will love suggested entries for fast and long-lasting profit.
Keep in mind that a proper trailing stop strategy and risk management and money management strategies are very important (DM me if you need any clarification on these points).
This is not an evolution of "ALGO Trading V2" or "ALGO Trading V3" , but a twin sister of them. Search them on TradingView to know them better.
This strategy has the following options:
enable/disable signals on chart
enable/disable bars and background coloring based on trend
enable/disable a "filter noise" option, which try to reduce overtrading (you can easily check it on backtesting)
enable/disable a Take Profit / Stop Loss option (you can easily check it on backtesting too)
enable/disable a secret SmartOption which may improve profit on your chart (again, check it on you chart if it helps or not)
This strategy only trigger 1 buy or 1 sell. If you enable Take Profit / Stop Loss option, consider that many TP can be triggered before trend reversal, so take partial profit on every TP an eventually buy/sell back lower/higher to maximize your profit.
In order to get notified when a signal is triggered, you need to use the "alarms" version of this indicator (just search for astropark's "ALGO Trading V1" indicator and choose the one with "alarms" suffix).
Strategy results are calculated on the time window from January 2019 to now, so on more than 1 year, using 1000$ as initial capital and working at 1x leverage (so no leverage at all! If you like to use leverage, be sure to use a safe option, like 3x or 5x at most in order to have liquidation price very far).
This is not the "Holy Grail", so use a proper risk management strategy.
This script will let you backtest how the indicator will perform on any chart and timeframe you may like to test and/or trade. Of course results will be very different depending on the chart and timeframe you will open. I tested a lot of charts and always you can find a combination that keep this strategy in profit on swing trading style (and this means that if you can have a daily look at the chart you can always manage to maximize your profit on each trade!)
This is a premium indicator , so send me a private message in order to get access to this script.
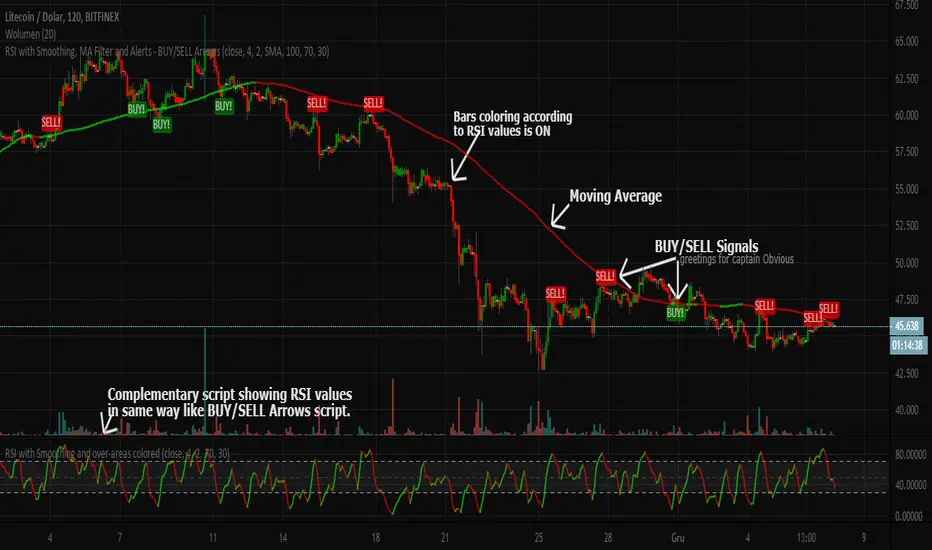
RSI with Smoothing, MA Filter and Alerts - BUY/SELL ArrowsEnglish description:
Here you have kind of better RSI (with smoothing) that can improve your decision-making process when you would like to trade.
Script has the following characteristics:
- Candles colorization
- RSI length
- RSI smoothing
- Moving Average Filter
- Moving Average to choose between: SMA and EMA
- Few differents methods of BUY/SELL signals to choose from and combine together
- Possibility to set Upper/Lower bands for over-bought/sold areas
This BUY/SELL Arrows script is invite-only for the members of our trading group (info in signature).
If you would like to have the oscillator visible on chart above, here is the complementary script:
Polish description:
Niniejszy skrypt, dzięki nieco ulepszonym wskaźniku RSI (z opcją wygładzenia jego linii sygnałowej) ma za zadanie wspomóc proces decyzyjny przy zakładaniu pozycji na giełdzie.
Możliwości są następujące:
- Kolorowanie świec na wykresie zgodnie z kierunkiem danych ustaleń wskaźnika RSI
- Długość/okres RSI
- Wygładzenie RSI
- Filtrowanie sygnałów Średnią Kroczącą
- Wybór pomiędzy dwoma rodzajami średnich kroczących: SMA i EMA
- Kilka różnych metod generowania sygnałów KUPNA/SPRZEDAŻY, które można włączać/wyłączać lub łączyć razem
- Możliwość ręcznego ustawienia domyślnych wartości górnej i dolnej bandy wskaźnika RSI, czyli stref wykupienia/wyprzedania.
Skrypt jest publikowany na zasadzie invite-only(zasada przydzielania dostępu na TradingView), a zatem dostępny jest tylko dla aktywnych użytkowników naszej grupy traderskiej, do której link można znaleść w mojej sygnaturze poniżej.
Jeśli chciałbyś również mieć na wykresie oscylator widoczny w oknie powyżej, tutaj jest odnośnik do skryptu uzupełniającego:
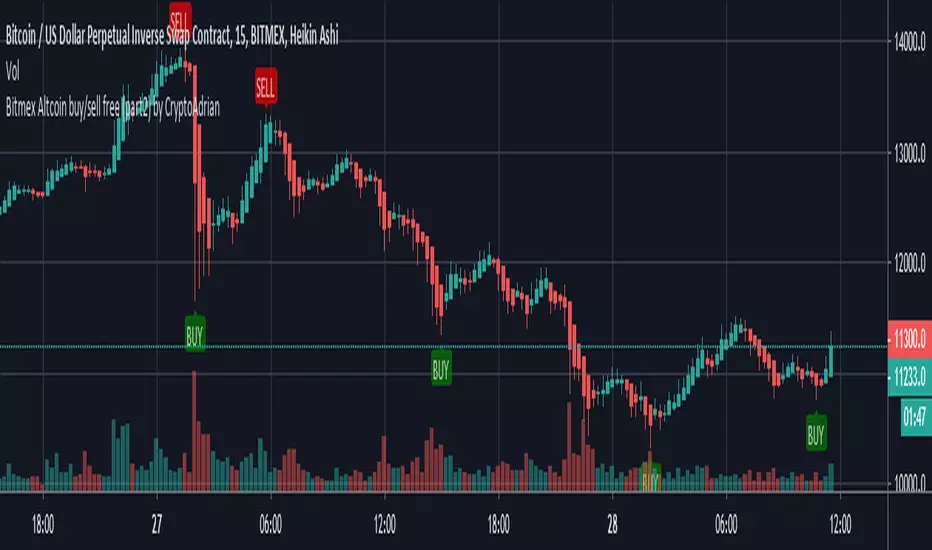
Bitmex Altcoin buy/sell free (part2) by CryptoAdrianThis script has two parts Bitmex Altcoin buy/sell free (part1) by CryptoAdrian and Bitmex Altcoin buy/sell free (part2) by CryptoAdrian
Combination of two will give you better results with clarification.
(soon will be published as one script)
For better results observe it for some time. If you didn't get how to use it PM me I will brief you :)
Hope you will like this. For any detail or doubts you can PM me on TV. I will try to reach you out ASAP .
Part-1
Part-2
Part-1 + Part-2
Please add this script to your fav so incase you find it difficult to find it can be seen in your fav and you will get it.
Thank You and happy trading :)

[astropark - Premium] Long-Short Strategy V3This indicator is not holy grail , but it is an amazing trend finder and works nicely between 3m and 1W timeframes :)))
With this indicator you can enjoy its trading signal and backtest the strategy.
In order to check how much you could have been profitable with this script if you started trading from a specific timestamp, please use this nice website to get the integer number representing in seconds the date-time you want to start from: www.unixtimestamp.com
If you want to set alerts on both buy, sell, take profit and stop-loss signals you must use this not-strategy indicator version
HOW TO USE THIS INDICATOR
Buy/Long when you see a green "B" label on the chart at best price you can, you have time till next candle's open price , trying to buy as low as possible near the green cloud or below it. Green cloud acts like a moving support for price, so use it for more buys/longs. The bigger the cloud, the stronger the bull-trend and so the support.
Sell/Short when you see a red "S" label on the chart at best price you can, you have time till next candle's open price , trying to sell as high as possible near the red cloud or over it. Red cloud acts like a moving resistance for price, so use it for more sells/shorts. The bigger the cloud, the stronger the bear-trend and so the resistance.
This indicator suggests some TP (Take Profit) for both longs (in green color) and shorts (in red color): you can start (at least partially!) closing the current trade (eventually you start new longs/shorts at cloud touch if you are a bold trader!).
Keep in mind that the lower the timeframe you work on, the easier is the trend to change rapidly, so always set a -2% / -5% stop-loss on trades and follow the trend with a nice trailing stop strategy.
Of course, as said at the beginning, this indicator suggests some TPs (Take Profits) for both longs (in green color) and shorts (in red color) operations: when you see a TP, you can start (at least partially!) taking profits over the current trade and move stop-loss higher (at least at break-even).
This is a premium indicator , so send me a private message in order to get access to this script.
Do you like my free scripts? Offer me a coffee, a beer, a pizza or whatever :)
BTC jar: 1K5kuYQPEqoNo6GRmJbHWMPmqwKM5S3oRR
ETH jar: 0x091b541a6dd6fe08c4e7bd909baafb2fce9b975e
LTC jar: LSVoAChsZrVsvbNyUfdpxtFpDAUSaUTUig
XRP jar: (XRP deposit tag) 103997763 (XRP deposit address) rEb8TK3gBgk5auZkwc6sHnwrGVJH8DuaLh
PS: Do you need a customization or do you need a dev who implements your strategy? send me a private message ;-)

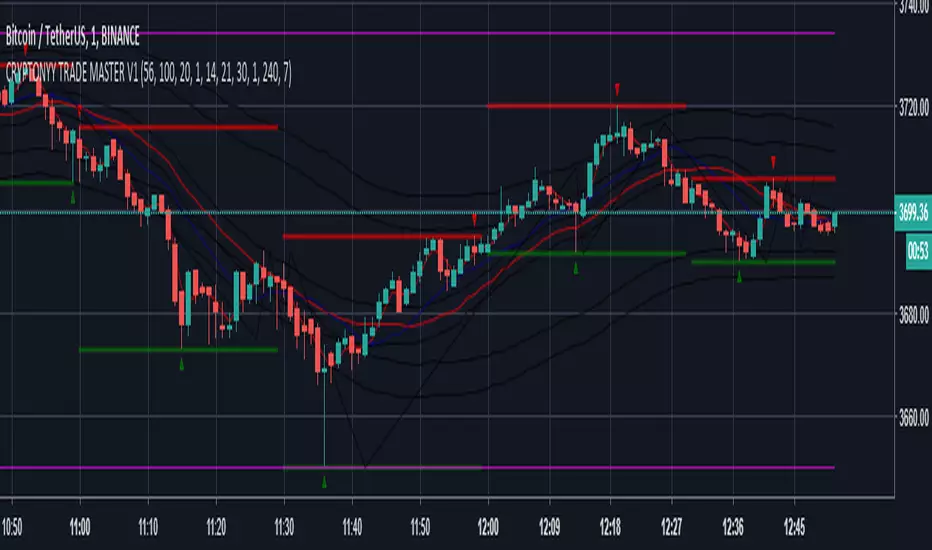
CRYPTONYY TRADE MASTER V1THIS SCRIPT IS ONLY MADE FOR BITMEX TRADERS.
IT WORKS ON 1MINUTE TIMEFRAME SMOOTHLY.
ADVANTAGES:
1. AUTO BUY/SELL SIGNALS.
2. 95% ACCURACY.
3. U WILL NEVER BE IN LOSS BECAUSE WE DEVELOPED THIS WITH OUR PERSONAL VOLATILITY INDICATOR.SO IF MARKET GOES OPPOSITE IT WILL GIVE U THE SIGNAL BEFORE YOUR LAST ENTRY PRICE.
4. DOUBLE CROSS INDICATOR.
5. MUCH VOLATILE=INCREASE THE SIGNAL ACCURACY.
6. 1MINUTE TIMEFRAME IS BEST TO TRADE WITH THIS SOFTWARE.
THOSE WHO WANT TO BUY THIS OR WANT DEMO COMMENT BELOW,I WILL MESSAGE YOU.

Strategy Testing Advanced Buy/Sell SignalsThis is strategy testing my Advanced Buy/Sell Signal script found here
TradingView is limited to strategy testing based on close price, so this is actually buying/selling a day later than each arrow. This does not repaint- arrows appear in realtime on the actual script, which is nice because that makes it useful.
