AuriumFlowAURIUM (GOLD-Weighted Average with Fractal Dynamics)
Aurium is a cutting-edge indicator that blends volume-weighted moving averages (VWMA), fractal geometry, and Fibonacci-inspired calculations to deliver a precise and holistic view of market trends. By dynamically adjusting to price and volume, Aurium uncovers key levels of confluence for trend reversals and continuations, making it a powerful tool for traders.
Key Features:
Dynamic Trendline (GOLD):
The central trendline is a weighted moving average based on price and volume, tuned using Fibonacci-based fast (34) and slow (144) exponential moving average lengths. This ensures the trendline adapts seamlessly to the flow of market dynamics.
Formula:
GOLD = VWMA(34) * Volume Factor + VWMA(144) * (1 - Volume Factor)
Fractal Highs and Lows:
Detects pivotal market points using a fractal lookback period (default 5, odd-numbered). Fractals identify local highs and lows over a defined window, capturing the structure of market cycles.
Trend Background Highlighting:
Bullish Zone: Price above the GOLD line with a green background.
Bearish Zone: Price below the GOLD line with a red background.
Buy and Sell Alerts:
Generates actionable signals when fractals align with GOLD. Bullish fractals confirm continuation or reversal in an uptrend, while bearish fractals validate a downtrend.
The Math Behind Aurium:
Volume-Weighted Adjustments:
By integrating volume into the calculation, Aurium dynamically emphasizes price levels with greater participation, giving traders insight into zones of institutional interest.
Formula:
VWMA = EMA(Close * Volume) / EMA(Volume)
Fractal Calculations:
Fractals are identified as local maxima (highs) or minima (lows) based on the surrounding bars, leveraging the natural symmetry in price behavior.
Fibonacci Relationships:
The 34 and 144 EMA lengths are Fibonacci numbers, offering a natural alignment with price cycles and market rhythms.
Ideal For:
Traders seeking a precise and intuitive indicator for aligning with trends and detecting reversals.
Strategies inspired by Bill Williams, with added volume and fractal-based insights.
Short-term scalpers and long-term trend-followers alike.
Unlock deeper market insights and trade with precision using Aurium!
Recherche dans les scripts pour "Cycle"

AMD-PO3-Goldbach levels [promuckaj]This script is developed on time & price, algorithmic market theory that is well explained in the book "Demystifying ICT" by Hopiplaka.
Indicators main features:
*PO3 - Goldbach(IPDA) levels which is based on the size of a price range (dealing range) as a factor of power of three (3^n).
There is PO3 numbers starting from 3 to 177147 as predefined, but also there is field for custom one so that users can experiment.
By selecting the PO3 number script calculate range low and range high using PO3 formula based on the current price and represent it on the chart into multiple levels of Goldbach numbers. At each this levels it is expected to see price that form block, fair value gap etc..., as defined in concept by ICT.
Levels:
Ext => External range
Low => Range low
High => Range high
FVG => Fair value gap
RB => Rejection block
OB => Order block
LV => Liquidity void
BR => Breaker
MB => Mitigation block
*AMD (Accumulation, Manipulation, Distribution) cycles, that can be modified by changing timings and colors.
Using PO3-Goldbach levels to identify where at the current time profile price is, there can be done trades in line with AMD cycles.
Default timings are set for Forex pairs.
*FVG, HIPPO, Displacement is well known parts of a market structure, so those three are also implemented here with some possible changes for them (colors, extension, labels...).
FVG => Fair value gap, imbalances in the market, or when buying and selling are not equal, in most cases can become a magnet for the price.
HIPPO => Hidden interbank price point objective, invention by Hopiplaka to demonstrate meaning of this "hidden" order block. It basically take the wicks of 2 consecutive bars that create a fair value gap.
DISPLACEMENT => It is practically similar to FVG but with option to measure length and strength, where in combination it will calculate and mark candle by looking back to the bars to determine the candle range standard deviation.
FEATURES:
-Multiple PO3 numbers, including special option to set your custom one
-Color and style customization
-Main levels mode, only Low, High and Equilibrium levels
-PO3 table with all PO3 calcs from multiple numbers, and mark the same levels from multiple
-Option to shift DR up or down
-Option to show you always upper/lower main DR levels (Low/High/Eq.)
NOTE:
-First of all special thanks to fxdmn that gives me idea from his indicator, how to present this through my own script.
-GB levels requires the correct symbols price calculation to work properly, everything is done by auto calc, tested well on EURUSD,SP500,DXY,Gold and BTC.

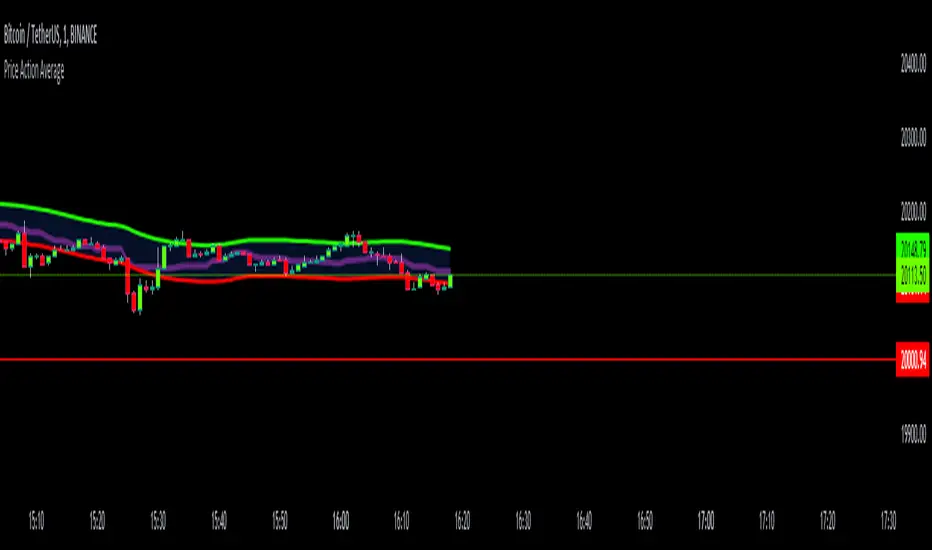
Price Action AverageThis indicator is perfect for scalping in 1 minute, it consists of a channel and a line that is made up of the average of the highs and lows of the price in 12 and 64 cycles.
The channel has as its center a 7 cycles SMA, when the average line (Called Signal, the purple one) crosses the upper band it is time to make a Long.
If it crosses the lower band it is time to make a short, if the line returns to the channel a signal appears to close the operation.
The indicator works with all timeframes, I use it on the 1 hour chart and I do the trades in 1 minute.
PA-Adaptive TRIX Log [Loxx]PA-Adaptive TRIX Log is a Phase Accumulation Adaptive TRIX Log indicator. This adaptation smooths the signal to catch larger trends.
What is TRIX?
TRIX is a momentum oscillator that displays the percent rate of change of a TEMA . It was developed in the early 1980's by Jack Hutson, an editor for "Technical Analysis of Stocks and Commodities" magazine. With its triple smoothing, TRIX is designed to filter insignificant price movements. In his article he uses a logarithm of a price (which is in many versions, left out).
What is the Phase Accumulation Cycle?
The phase accumulation method of computing the dominant cycle is perhaps the easiest to comprehend. In this technique, we measure the phase at each sample by taking the arctangent of the ratio of the quadrature component to the in-phase component. A delta phase is generated by taking the difference of the phase between successive samples. At each sample we can then look backwards, adding up the delta phases.When the sum of the delta phases reaches 360 degrees, we must have passed through one full cycle, on average.The process is repeated for each new sample.
The phase accumulation method of cycle measurement always uses one full cycle’s worth of historical data.This is both an advantage and a disadvantage.The advantage is the lag in obtaining the answer scales directly with the cycle period.That is, the measurement of a short cycle period has less lag than the measurement of a longer cycle period. However, the number of samples used in making the measurement means the averaging period is variable with cycle period. longer averaging reduces the noise level compared to the signal.Therefore, shorter cycle periods necessarily have a higher out- put signal-to-noise ratio.
Included
Bar coloring
2 signal options
Alerts

Planetary Signs█ OVERVIEW
This script is designed to highlight planetary signs. All 12 signs on all planets going from Mercury to Pluto on both Geocentric and Heliocentric settings.
If you are an astrology trader or if you do trade cycles, this script might be great for you because it highlights all these cycles automatically.
You can select one sign or multiple signs at once, you are also able to change the color of the cycle. It should work on all time frame but with future dates it's only set to daily resolution at the moment. Current time is in sync perfectly to the minute when the sign change.
█ Future Plans and upgrades to this script may include :
1. Increase future resolution; it's set to 120 days into the future with daily resolution.
2. More styling and labeling options
And more! Feel free to contact me with any feature that you would like to see in this script
█ How to use :
1. Open the settings.
2. Select the planet.
3. Enable your favorite sign or signs.
Then Press OK & give the script a few seconds and you should be set. You can add this script to your chart more than once!
This script is coded as an addon to the Gann ToolBox package/scripts.

Half-Pi Cycle CKB top indicator (insanely experimental)This is an insanely experimental script. It's a modified version of the Bitcoin pi-cycle top indicator.
It changes the Bitcoin pi-cycle top formula by halving the number of days in the two DMAs used in calculation, from 350/111 to 175/56. So I call it the half-pi cycle. It correctly picked the top of CKB (Nervos Network) vs USDT on Huobi in spring 2021 within three days.
It probably is a coincidence, and could very easily not pick the next cycle peak correctly at all. Using such a short number of days makes it a little dubious, but I had no choice since there's only so much price history for this coin. I strongly advise you to not make any trades based on this script ! I cannot be held accountable if you lose money due to this script. It hasn't been shown to be accurate multiple times like the Bitcoin pi-cycle top indicator. I simply find this interesting and want to see if it works next time.

Morphed Sine WaveIntroduction
If you rescale a sine wave to the price you will need to correlate it with it in order to show good results, today i present a different method that does not involve correlation to "morph" a sine wave to the price in order to provide forecast's and highlight market periodic patterns.
Parameters
length control the period of the sine wave, power control the "morphing" amount, if you see for example that the results are going nuts try to increase power , if the results are just the price and the delayed price try to decrease power .
power = 1
power = 100
Those settings might be different depending on which market you are in.
Various Uses
You can do a lot of things with this indicator, use filters as source :
Use the indicator as source for oscillators in order to create cycles indicators :
And certainly many more things
Conclusion
I presented a way to morph a sine wave to the price i order to highlight cycles. You can use any function that return a value between -1 and 1 instead of sin , this can be a scaled rsi/stochastic or correlation coefficient, its up to you :)
If you need help don't hesitate to commend or pm me. I hope you will like the indicator and that it will inspire you to make great things.
Thanks for reading !

BTC - VDD Multiple (Approx)Overview & Philosophy
⚠️ Note: This indicator is optimized for the Daily (1D) Timeframe. Please switch your chart to 1D for accurate signal reading.
The BTC – VDD Multiple (Approx) is an advanced oscillator designed to identify market overheating and cycle tops by analyzing the velocity of value moving through the market.
In traditional On-Chain Analysis, Value Days Destroyed (VDD) is a premier metric for spotting macro tops. It multiplies the coin age (how long a coin was held) by the price at which it was moved. When old coins (HODLer money) move at high prices, VDD spikes, signaling massive profit-taking.
The Problem: Real "Coin Days Destroyed" (CDD) data is typically locked behind institutional paywalls or unavailable on standard TradingView plans.
The Solution: This script calculates a Deterministic Proxy. By analyzing the relationship between Exchange Volume, Price, and a Dormancy Constant, we can approximate the structure of the VDD Multiple without needing a premium data feed.
Methodology
The VDD Multiple works by comparing short-term market velocity against a long-term baseline.
1. The Proxy Calculation
Since we cannot directly access the age of coins on TradingView, we model the economic weight of the move:
Proxy Value = Exchange Volume * Price * Dormancy Factor
This creates a synthetic representation of "Value Throughput."
2. The Multiple
We compare the immediate heat of the market against the yearly trend:
• Short-Term MA (2 Days): Captures flash spikes and sudden liquidity exit events.
• Long-Term MA (365 Days): Represents the baseline "hum" of network activity.
VDD Multiple = Short Term MA / Long Term MA
How to Read the Chart
The indicator plots the Multiple as a line and uses background highlighting to signal extreme regimes.
🔴 The Red Zone (Overheated > 2.9)
Meaning: Current value transfer is ~3x higher than the yearly average.
Interpretation: Historically, sharp spikes into the Red Zone correlate with Local or Cycle Tops. This indicates that massive volume is changing hands at high prices—typically a sign of "Smart Money" distributing into "Dumb Money" FOMO.
Note: In strong bull runs, price can push higher even after a VDD spike, but the risk/reward ratio is extremely poor here.
🟢 The Green Zone (Undervalued < 0.75)
Meaning: Market activity is quiet and below the yearly baseline.
Interpretation: These are periods of apathy or accumulation. Historically, extended time spent in the Green Zone (the "flatline") has offered the best asymmetric buying opportunities.
🟠 The Orange Line (Neutral)
Meaning: The market is in transition or equilibrium.
Strategy & Context
This indicator is best used as a Macro Cycle Tool, not a day-trading signal.
• Exit Strategy: Look for "Clusters" of Red Spikes. A single spike often marks a local correction, but a cluster of intense spikes while price makes new highs (Divergence) is a strong Cycle Top warning.
• Entry Strategy: Historically the best entries occur when the indicator flattens out in the Green Zone for weeks or months. This suggests sellers are exhausted and the market has reached a floor.
Credits
This script is an approximation of the original VDD Multiple concept. Full credit for the underlying on-chain theory goes to the pioneers of this metric:
• Concept: The original Value Days Destroyed metric was popularized by Hans Hauge and Glassnode.
• The Multiple: The specific application of a Short/Long MA Multiple on VDD is widely attributed to analysts like TXMC and Bitbo.
This script adapts these concepts for the free TradingView environment using exchange volume proxies.
Settings
• Data Source: Defaults to BINANCE:BTCUSDT to capture high-volume liquidity.
• Short MA: Default is 2 Days to capture rapid velocity spikes.
• Long MA: Default is 365 Days to track the annual trend.
Disclaimer
This tool is an approximation based on exchange volume, not raw blockchain data. While exchange volume and on-chain volume are highly correlated during cycle extremes, they are not identical. This script is for educational and research purposes only. Past performance does not guarantee future results.
Tags
bitcoin, btc, onchain, vdd, cdd, valuation, cycle, top, bottom, Rob Maths

PyraTime Harmonic 369Concept and Methodology PyraTime Harmonic 369 is a quantitative time-projection tool designed to apply Modular Arithmetic to market analysis. Unlike linear time indicators, this tool projects non-linear integer sequences derived from Digital Root Summation (Base-9 Reduction).
The core logic utilizes the mathematical progression of the 3-6-9 constants. By anchoring to a user-defined "Origin Pivot," the script projects three distinct harmonic triads to identify potential Temporal Confluence—moments where mathematical time cycles align with price action.
Technical Features This script focuses on the Standard Scalar (1x) projection of the Digital Root sequence:
The Root-3 Triad (Red): Projects intervals of 174, 285, 396. (Mathematical Sum: 1+7+4=12→3)
The Root-6 Triad (Green): Projects intervals of 417, 528, 639. (Mathematical Sum: 4+1+7=12→3, inverted)
The Root-9 Triad (Blue): Projects intervals of 741, 852, 963. (Mathematical Sum: 7+4+1=12→3... completion to 9)
How to Use
Set Anchor: Input the time of a significant High or Low in the settings.
Select Resolution: This tool is optimized for 1-minute (Micro-Harmonics) and 15-minute (Intraday Harmonics) charts.
Analyze Clusters: The vertical lines represent calculated harmonic intervals. Traders look for "Clusters" where a Root-3 and Root-9 cycle land on adjacent bars, indicating a high-probability pivot.
System Architecture & Version Comparison This script represents the foundational layer of the PyraTime ecosystem.
This Script (PyraTime Harmonic 369):
Scalar: Standard 1x Multiplier only.
Focus: Intraday & Micro-structure (1m, 15m).
Engine: Core Digital Root Integers.
PyraTime Harmonic Matrix (Advanced Edition):
Scalar Engine: Unlocks Quad-Fractal (4x), Tri-Fractal (3x), and Bi-Fractal (2x) multipliers for institutional cycle analysis.
Apex Logic: Auto-detection of the "963" Completion Sequence (Gold Highlight).
Event Horizon: Includes a live Predictive Dashboard that calculates the time-delta to the next harmonic event across all scalar groups.
Disclaimer This tool is for the educational analysis of Number Theory in financial markets. It projects time intervals and does not predict price direction. Past performance does not guarantee future results.

Sunday Open & Friday Close LinesSunday Open & Friday Close Lines — © Erica Lorrai | Trade Tribe HQ
A clean weekly anchor tool for traders who love simple, high-signal charting.
Clean charts, clean mind, clean trades.
This script marks the two most important moments of every trading week:
where the market closed… and where it truly reopened.
Designed for traders who use dealer-cycle logic, market structure, or BTMM-style timing, these lines help you instantly:
Spot weekend gaps
Identify weekly narrative shifts
See where the dealers reset liquidity
Anchor your weekly analysis with precision
Track the beginning of new cycles and the end of old ones
No clutter. No noise. Just two high-value levels that quietly run your entire week.
Customize the color, width, and line type to match your chart style and make weekly transitions impossible to miss.
Whether you're new to trading or deep into pattern-cycle logic, this little tool becomes one of those “how did I trade without this?” markers.
© Erica Lorrai — Trade Tribe HQ
Aloha & welcome to the Tribe. 🌺
How to Use
Add the script to your chart on any timeframe.
The indicator automatically detects each new trading week.
Two vertical lines will appear:
Friday Close Line – last candle before the weekend
Sunday Open Line – first candle of the new week
Use the settings panel to customize color, width, and line style.
These weekly anchors help you identify weekend gaps, weekly resets, and structural shifts in real time.
If you’re new here — welcome to the Tribe. 🌺
This little tool is one of the first things I teach my traders:
“See the week clearly, and the trades get clearer too.”
If you want more BTMM-style tools, weekly breakdowns, or want to learn the system behind these levels, come hang out at Trade Tribe HQ.
Happy trading.
— Erica Lorrai

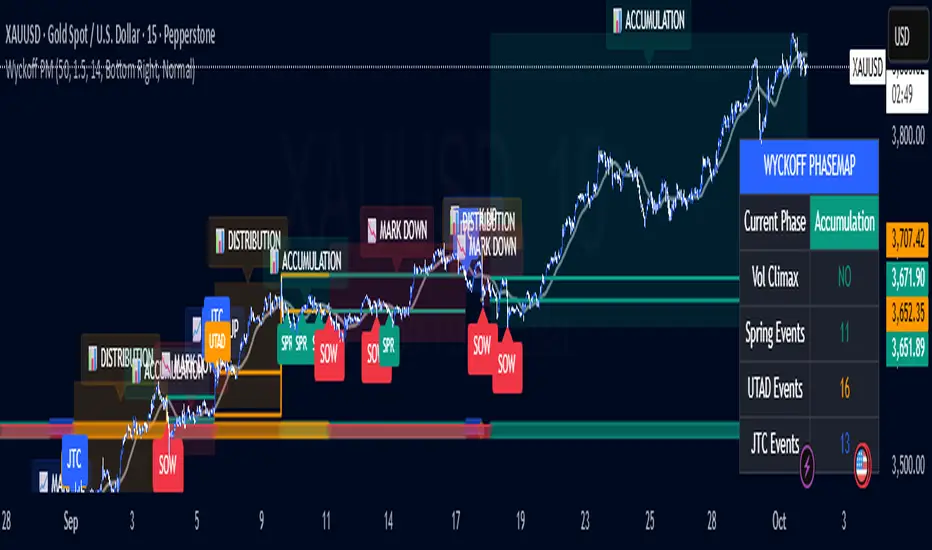
Wyckoff PhaseMap Overlay [FxalgoxPro]📊 Wyckoff PhaseMap Overlay
Professional Wyckoff Market Cycle Indicator for TradingView
━━━━━━━━━━━━━━━━━━━━━━━━━━━━━━━━━━━━━━━━
🎯 OVERVIEW
The Wyckoff PhaseMap Overlay is a sophisticated indicator that automatically identifies and visualizes the four phases of the Wyckoff Market Cycle on your price chart, combining price action analysis with volume confirmation to detect:
Phase 1: Accumulation (Cause)
Phase 2: Mark Up (Effect)
Phase 3: Distribution (Cause)
Phase 4: Mark Down (Effect)
━━━━━━━━━━━━━━━━━━━━━━━━━━━━━━━━━━━━━━━━
🔑 KEY FEATURES
📈 Phase Detection
Accumulation : Identifies selling climax (SC), automatic rally (AR), secondary tests (ST), and springs
Mark Up : Detects sustained uptrend with higher highs/higher lows structure
Distribution : Recognizes buying climax (BC), UTAD (upthrust after distribution), and range formation
Mark Down : Confirms breakdown with volume and downtrend structure
🎨 Visual Elements
Phase Background Colors : Optional color-coded backgrounds for each phase
Range Lines : Dynamic support/resistance levels during accumulation and distribution
Event Markers : Clear labels for Spring, UTAD, JTC (Jump the Creek), and breakdowns
Trend MA Overlay : Moving average for trend confirmation
Phase Labels : Large, descriptive labels when phases change
📊 Dashboard
Real-time phase status
Volume climax indicator
Event counters (Spring, UTAD, JTC)
Customizable position and size
🔔 Alerts
Phase change notifications
Spring detection
UTAD detection
Jump the Creek confirmation
Breakdown signals
━━━━━━━━━━━━━━━━━━━━━━━━━━━━━━━━━━━━━━━━
⚙️ CONFIGURATION
Wyckoff Phases (Main Settings)
Parameter | Default | Description
---------------------------- | ------- | -------------
Trend MA Length | 50 | Moving average for trend detection
Volume Climax Threshold | 1.5 | Multiplier for average volume to detect climax events
Range Detection Length | 14 | Lookback period for range identification
Phase 1: Accumulation
Toggle accumulation phase display
Show/hide Spring events
Show/hide AR (Automatic Rally) and ST (Secondary Test)
Customize phase and spring colors
Phase 2: Mark Up
Toggle mark up phase display
Show/hide Jump The Creek (JTC) events
Customize phase and JTC colors
Phase 3: Distribution
Toggle distribution phase display
Show/hide UTAD events
Show/hide BC (Buying Climax)
Customize phase and UTAD colors
Phase 4: Mark Down
Toggle mark down phase display
Customize phase and breakdown colors
Visual Settings
Show Phase Labels : Display large phase transition labels
Show Event Markers : Display Spring, UTAD, JTC markers
Show Phase Background : Color-code background by current phase
Dashboard
Show Dashboard : Toggle statistics panel
Position : Top Right / Bottom Right / Bottom Left
Size : Tiny / Small / Normal
━━━━━━━━━━━━━━━━━━━━━━━━━━━━━━━━━━━━━━━━
🧠 HOW IT WORKS
Phase Detection Logic
1️⃣ Accumulation (Cause)
Triggers:
- Selling climax detected (high volume + down move)
- Price enters range-bound consolidation
- Low volume compression
- Spring: False breakdown below support with low volume
2️⃣ Mark Up (Effect)
Triggers:
- Jump The Creek (JTC): Breakout from accumulation range
- Volume confirms breakout (>1.3x average)
- Higher highs and higher lows structure
- Price above trend MA
3️⃣ Distribution (Cause)
Triggers:
- Buying climax detected (high volume + up move)
- Price enters range-bound consolidation after uptrend
- UTAD: False breakout above resistance with volume
- Range compression
4️⃣ Mark Down (Effect)
Triggers:
- Breakdown from distribution range
- Volume confirms breakdown (>1.3x average)
- Lower lows and lower highs structure
- Price below trend MA
━━━━━━━━━━━━━━━━━━━━━━━━━━━━━━━━━━━━━━━━
📝 EVENT DEFINITIONS
Event | Phase | Description | Visual
-------- | ------------- | ------------------------------------------------ | -------------------------
SC | Accumulation | Selling Climax - panic selling with high volume | Volume spike + price drop
AR | Accumulation | Automatic Rally - bounce from oversold | Recovery move
ST | Accumulation | Secondary Test - retest of lows | Low volume test
Spring | Accumulation | False breakdown below support | 🟢 Label below
JTC | Mark Up | Jump The Creek - confirmed breakout | 🔵 Label (transition)
BC | Distribution | Buying Climax - euphoric buying with high volume | Volume spike + price rise
UTAD | Distribution | Upthrust After Distribution - false breakout | 🟠 Label above
SOW | Mark Down | Sign of Weakness - confirmed breakdown | 🔴 Label (transition)
━━━━━━━━━━━━━━━━━━━━━━━━━━━━━━━━━━━━━━━━
🎯 USE CASES
For Traders
Identify accumulation zones for potential long entries
Recognize distribution zones for potential short entries or exits
Confirm trend changes with phase transitions
Avoid false breakouts (Springs and UTADs)
Time entries using Jump The Creek signals
For Analysts
Market structure analysis across multiple timeframes
Volume-price divergence identification
Institutional behavior tracking (accumulation/distribution)
Cycle completion analysis
━━━━━━━━━━━━━━━━━━━━━━━━━━━━━━━━━━━━━━━━
🎨 RECOMMENDED SETTINGS
For Swing Trading (Daily/4H)
Trend MA Length: 50
Volume Climax Threshold: 1.5
Range Detection Length: 14
For Intraday Trading (1H/15m)
Trend MA Length: 20
Volume Climax Threshold: 2.0
Range Detection Length: 10
For Long-term Investors (Weekly)
Trend MA Length: 100
Volume Climax Threshold: 1.3
Range Detection Length: 20
━━━━━━━━━━━━━━━━━━━━━━━━━━━━━━━━━━━━━━━━
📚 WYCKOFF METHOD RESOURCES
The indicator is based on Richard Wyckoff's market cycle theory:
Accumulation → Smart money accumulates while retail panics
Mark Up → Price rises as smart money distributes to late buyers
Distribution → Smart money exits while retail buys
Mark Down → Price falls as retail holds losing positions
Learn More:
Wyckoff Analytics
Market cycle analysis
Volume Spread Analysis (VSA)
━━━━━━━━━━━━━━━━━━━━━━━━━━━━━━━━━━━━━━━━
⚠️ IMPORTANT NOTES
Volume Required : Indicator requires volume data (won't work on some Forex brokers without volume)
Timeframe : Best results on 1H, 4H, Daily, Weekly
Confirmation : Always combine with other analysis methods
Context : Phase detection improves with clean, trending markets
━━━━━━━━━━━━━━━━━━━━━━━━━━━━━━━━━━━━━━━━
🐛 TROUBLESHOOTING
Q: Why aren't any phases showing?
Ensure volume data is available for your symbol
Try adjusting Volume Climax Threshold (lower = more sensitive)
Check if Show Phase Background is enabled
Q: Too many false signals?
Increase Volume Climax Threshold for stricter detection
Increase Range Detection Length for better range identification
Use higher timeframes (4H/Daily)
Q: Dashboard not showing?
Check Show Dashboard is enabled in settings
Ensure panel isn't off-screen (try different position)
━━━━━━━━━━━━━━━━━━━━━━━━━━━━━━━━━━━━━━━━
👨💻 CREDITS
Developer : Fxalgox
Method : Richard Wyckoff Market Cycle Theory
━━━━━━━━━━━━━━━━━━━━━━━━━━━━━━━━━━━━━━━━
💡 TIPS FOR BEST RESULTS
Combine with Market Context : Use alongside market structure analysis
Multi-timeframe Confirmation : Check higher timeframe phase alignment
Volume is Key : Pay attention to volume climax indicators in dashboard
Be Patient : Wait for phase confirmations before taking action
Use Alerts : Set up alerts for phase changes and key events
━━━━━━━━━━━━━━━━━━━━━━━━━━━━━━━━━━━━━━━━
Happy Trading! 📈
Remember: This indicator is a tool for analysis, not financial advice. Always manage risk appropriately.
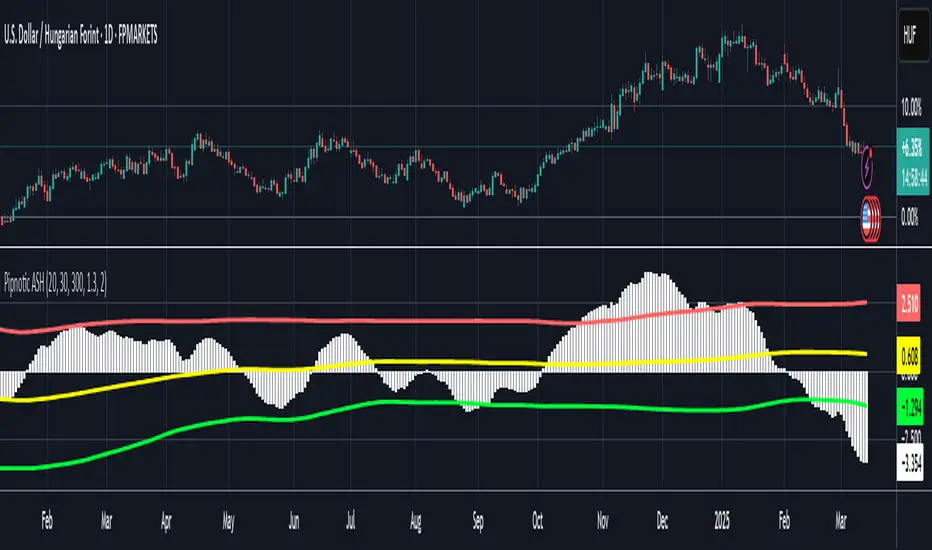
Pipnotic Asset Strength HistogramDescription
The Pipnotic Asset Strength Histogram (ASH) was originally developed to provide traders with a structured approach to identifying market cycles and momentum shifts. Due to increasing demand, it has been adapted for TradingView, ensuring traders can leverage its insights directly on their charts. This tool is particularly useful for spotting divergences, trend reversals, and price imbalances, making it an essential addition for traders who rely on momentum and strength-based analysis. We will continue to actively develop this indicator to enhance its functionality and accuracy.
How It Works
The ASH follows a systematic approach to analyse price movements and highlight key market dynamics:
Momentum & Cycle Analysis
Evaluates price movements using a dual-smoothing methodology.
Identifies shifts in momentum that indicate potential reversals or trend continuations.
Divergence Detection
Highlights instances where price action diverges from underlying momentum, signalling potential trading opportunities.
Helps confirm trade setups based on hidden and regular divergences.
Dynamic Visualization & Alerts
Plots a histogram to provide a clear visual representation of market strength.
Identifies buy and sell zones based on historical price deviations.
Updates dynamically, adapting to changing market conditions to maintain relevance.
Key Features & Inputs
Customizable Sensitivity: Traders can fine-tune cycle smoothing values to match different trading styles.
Clear Buy & Sell Zones: Highlights potential high-probability trading areas based on historical deviations.
Flexible Visualization: Adjustable histogram colours, line width, and mean deviation settings for optimal clarity.
Adaptability Across Markets: Works effectively on stocks, forex, crypto, and commodities.
Compatible with Various Trading Strategies: Can be used alongside trend-following, breakout, and reversal strategies for enhanced trade confirmation.
Benefits of Using the Pipnotic ASH Indicator
Market Timing: Helps traders identify optimal entry and exit points based on momentum shifts.
Reduces Subjectivity: Automates the detection of market strength and divergence, ensuring consistency.
Adapts to Market Conditions: Adjusts dynamically to price changes, ensuring relevant signals.
Saves Time & Effort: Eliminates the need for manual divergence analysis.
Works on All Timeframes: Suitable for scalping, swing trading, and long-term investing.
The Pipnotic Asset Strength Histogram is designed to streamline market analysis by providing clear, actionable insights into momentum shifts and divergences. Whether you're a day trader or a long-term investor, this tool helps refine your decision-making and enhance your trading strategy.
Adaptive Fisherized CMOIntroduction
Heyo, here is another no-repaint adaptive fisherized indicator.
I added Inverse Fisher Transform, Ehlers dominant cycle analysis and smoothing to the Chande Momentum Oscillator (CMO).
Usage
The CMO is a momentum oscillator which shows the usual movement of an asset.
I recommend to use it from a lower timeframe with a higher timeframe set.
Signals
(Signal mode will come soon.)
Zero Line
CMO crosses above zero line => enter long
CMO cross below zero line => ente short
Overbought/Oversold
CMO crosses above bottom band => enter long
CMO crosses under top band => enter short
MA (Maybe this signals will vary. Then, check update notes.)
CMO crosses above MA => enter long
CMO crosses below MA => enter short
Enjoy and share your experience with it!
More to read: CMO Explanationsp

Pi Cycle indicator for Bitcoin bull market cyclesA simple implementation of the Pi cycle indicator for BTC. Plots the 111 days SMA and 2*(350 days SMA).
When the 111 days MA reaches above the 350 one, we can consider the market got too high too fast.
Checked for the last cycles of BTC.

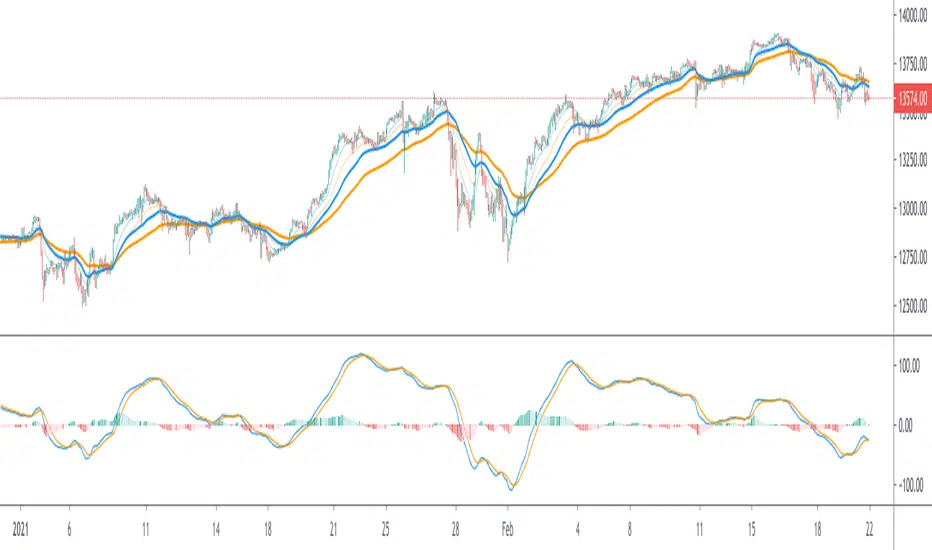
Dominant Cycle Adaptive MACDThis Indicator is based on classic MACD but with an exceptional smoothing.
This smoothing eliminates the noise of the classic MACD as you see in the Chart
Adaptive MACD is compiled using with two adaptive moving averages, one adaptive to the dominant cycle and the other adaptive to twice the dominant cycle. As the basic behind the MACD is the difference of two moving averages we cannot find much difference between the conventional MACD (12, 26) and the adaptive MACD. However the adaptive MACD is less prone for less whipsaws and it catches the trends very well at the same time the catches the turning points in time. The Adaptive MACD is definite one notch better than the conventional MACD.
Dominant Cycle Period is calculated using Ehler's Method {Mentioned in the code}
This is how the Adaptiveness Impacts the Price Chart
1. (12, 26 EMA) VS Adaptive Dominant Cycle EMA
2. See how the Adaptive Lengths {both FastLength and SlowLength changes with time!}
Enjoy!
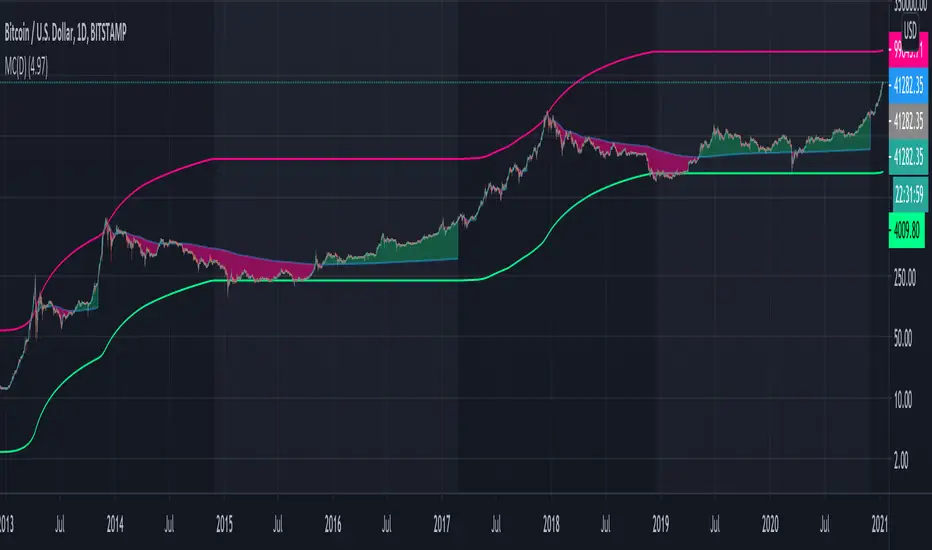
Macro Cycles (Daily)Macro Cycles (Daily) is an indicator meant to show long-term cyclic trends on a daily scale
- Red line: Cycle Top
- Green line: Cycle Bottom
- Red Area: Bearish
- Green Area: Bullish
- No Area: Price Discovery
- Grey Background: Accumulation Zone
- Range Input: Lets you fine tune the placement of the Red and Green lines
* This is not financial advice. Proceed with caution friend
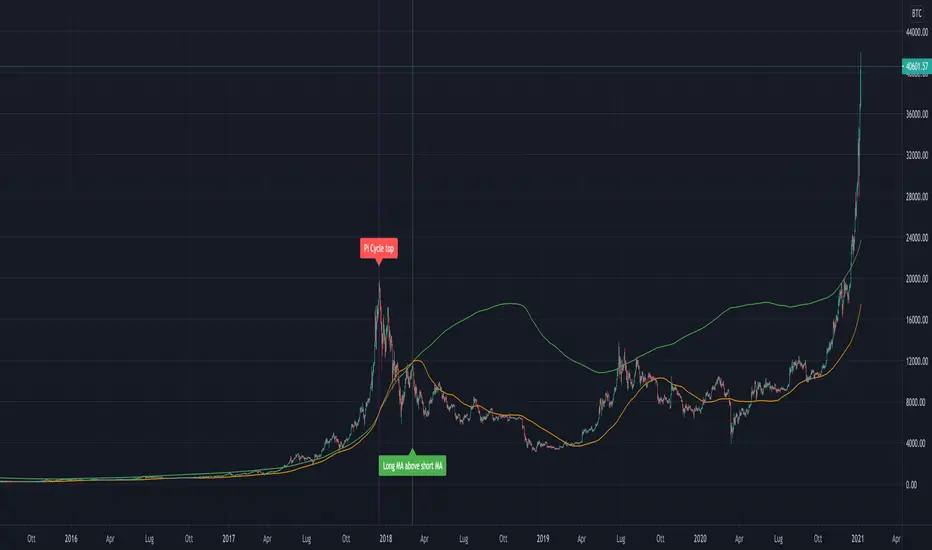
Pi Cycle Bitcoin Top IndicatorThe script implements the Pi Cycle Top indicator
This indicator identifies tops in the bitcoin market cycle. Historically, the Pi Cycle Top indicator has called out tops in the price of bitcoin within three days.
The script is very easy to use and it is possible to change the following parameters:
the time interval (default value is day);
the days of long moving average (default value is 365)
the days of short moving average (default value is 111)
show the moving average plots
show the Pi Cycle Top label highlighting the cross-point
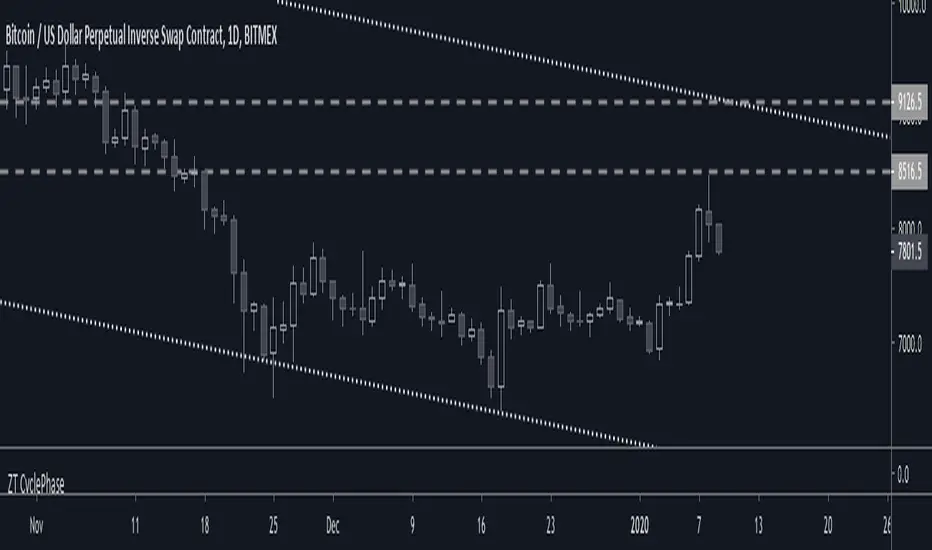
Zentrading Trend Indicator v3.1This is a script for beta testing only.
Based on ichimoku, but with slightly different behaviour, with many added features such as : trend detection, momentum detection, multiple time frame support/resistance levels, exhaustion/reversal signals.
Used in conjunction with the other ZT indicators (ZT momentum, ZT CyclePhase, and ZT Volumebars) the strategy provides very distinct setups to trade for reversals, breakouts and pullbacks.

ZenTrading CyclePhaseThis is a script for beta testing only.
Used to mainly to spot (short-term) divergences
Enhanced Autocorrelation Periodogram RasterChart - EhlersFirstly, this is NOT an indicator. It's an advanced cycle period detector for advanced developers OR scripts providing a "Period Source" they may have developed that can utilize this detector. Be forewarned! I would only recommend this for advanced developers, not novice. If you are up to the challenge of manually altering period adjustments on the daily chart of an indicator by hand in real time, you may still obtain this indicator after negotiating a proper request for access, but I will say this, it is NOT suitable for all indicators.
Understand all of the above aforementioned? Proceed...
For those of you wondering how I did it without Pine support for arrays, I had to emulate them, totaling over 600+ lines of code. This was a formidable task to achieve. This may be the hardest task I have ever accomplished, as of yet, in Pine.
Now, on to the Description...
This is my enhanced and heavily* modified version of Dr. John Ehlers' autocorellation periodogram for detecting dominant cycles(frequencies) in an asset using Pine Script version 4.0. The original concept comes from chapter 8 of his book "Cycle Analytics for Traders" and may also be found in TASC magazine in the September 2016 issue. I did heavily modify the original computations for the purpose of providing the "maximum" amount of adjustability there is to possibly offer, but left the original settings intact. I also provided an assortment of vibrant color changing techniques to choose from for anyone who may have vision impairments. This also displays that color scheming is VERY possible in Pine ...if only I could get "chart.theme" for auto-detection.
I once again would personally like to thank the talented individuals at TV for providing a platform that embraces an initial free membership, which I first obtained myself, for individuals like me to freely code in Pine with mathemagical ideas and mental wizardry, creating ultimately, inventions like this eye candy display above.
Features List Includes:
"Source" Selection
Color schemes (displayed above)
Transparency for the heat map to reduce or intensify color brightness ( Thank you TV! For this feature...)
The detected dominant cycle can be 'Sourced' by another specially** modified script providing an integer, float, or a rounded float.
Resolution enhancement has 3 settings
Smoother period control
Highpass period control
Pearson correlation period control
Minimal Power Threshold Tweak(Experimental***)
Adjustment for the smoothing coefficients of the Fourier Transforms(Experimental!)
This is not a freely available indicator, FYI. To witness my Pine poetry in action, properly negotiated requests for unlimited access, per indicator, may ONLY be obtained by direct contact with me using TV's "Private Chats" or by "Message" in my member name above. The comments section below is solely just for commenting and other remarks, ideas, compliments, etc... If you do have any questions or comments regarding this indicator, I will consider your inquiries, thoughts, and ideas presented below in the comments section, when time provides it. As always, "Like" it if you simply just like it, and also return to my scripts list occasionally for additional postings. Have a profitable future everyone!
* This has additional features/tweaks not included in the original.
** Many Pine built-in functions WILL NOT support the use of this detector if 'Sourced' to control a period setting. You have to totally rewrite those built-in Pine functions in Pine script. Yes, it is very possible! BUT ...in many cases, not all.
*** This "modification" reduces large spikes in the detected dominant cycle period with increased adjustment. Increasing this value may reduce dominant cycle spikes around 0.3-ish
Financial Freedom WaveRider - Cycling MulticatorIn the Spirit of '76 commemorating this day on July 4th, this is my second indicator released using Pine Script version 4.0, something I contributed to often in a small role, and will continue to do, in my free time. Without revealing my secret sauce , this indicator resembles what appears to look like multi Hilbert complex traces combined with Fourier transforms, but i assure you it uses neither technique of extrapolation. It's characteristics display tendencies portraying blatant cycles and strengths in an asset. Regarding the use of this script, the bright yellow line has a period of 4 and the longest adjustable period is 65.
My idea initially was, while there is great "one liner indicators" to use, I thought, why not multi-line "multicators" with little to adjust concerning dominant cycle fluctuations in the market. And voila, a random experiment, turned visually compelling similar to ocean waves. This was followed by adding some colorized banding later to add separation to the color, and I realized this looks like a flag rippling in the wind. Living in America, I then was determined to attain a replica of "Old Glory" in an actual multicator. It's embedded artwork, making it an articator too. Which is why I waited to release it appropriately on July 4th, a day of celebration of freedom, an empowering idea that has reached dessimenation world wide to so many other nations and peoples.
I would personally like to thank the talented individuals at TV for providing a platform that embraces an initial free membership, which I first obtained myself, for people like me to freely code in Pine with mathemagical ideas and mental wizardry, creating ultimately, inventions like this eye candy display above.
Features List Includes:
Enable/disable dark background for enhanced visibility
Longest period adjustment providing any adjustable period setting
A small adjustment tweak for the underlying linear regression
Minimalized enable/disable adjustment for the theme
This is not a freely available indicator, FYI. To witness my Pine poetry in action, properly negotiated requests for unlimited access, per indicator, may ONLY be obtained by direct contact with me using TV's "Private Chats" or by "Message" in my member name above. The comments section below is solely just for commenting and other remarks, ideas, compliments, etc... If you do have any questions or comments regarding this indicator, I will consider your inquiries, thoughts, and ideas presented below in the comments section, when time provides it. As always, "Like" it if you like it, and also return to my scripts list occasionally for additional postings. Have a profitable future everyone!

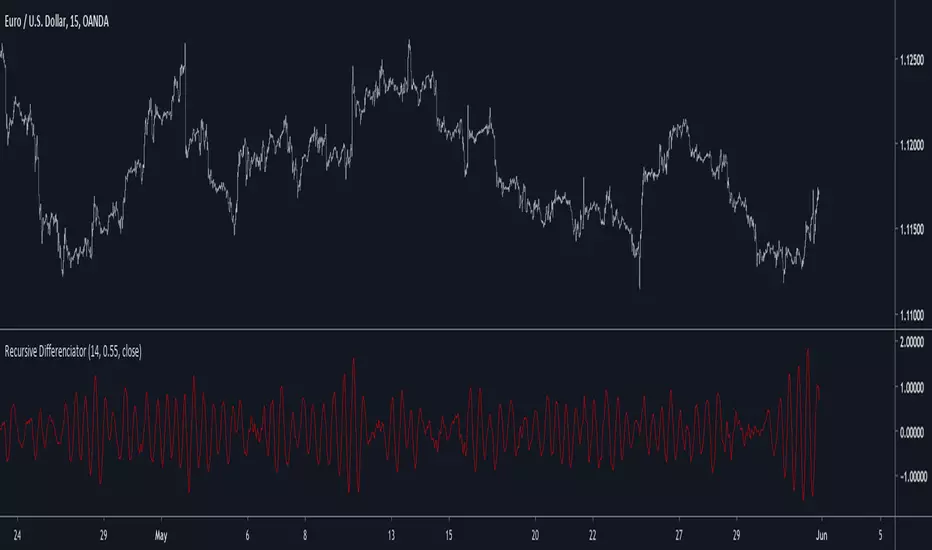
Recursive DifferenciatorIntroduction
Cycles can be spotted by using a wide range of methods, most of them will involve bandpass filtering, here i will show a method using recursion with the change() function.
The Indicator
As i explained in other indicators using recursion i posted rescaling the input is important, i will use the rsi of an exponential moving average as input. alpha control the amount of output the indicator will use as input, values closer to 0.5 will use more input resulting in more periodic results.
Lowering alpha when length is higher can help get more periodic results.
Conclusion
I have showed a new cycle indicator using recursion. Recursion with oscillators can highlights cycles in price thus being easier to predict.
Thanks for reading !
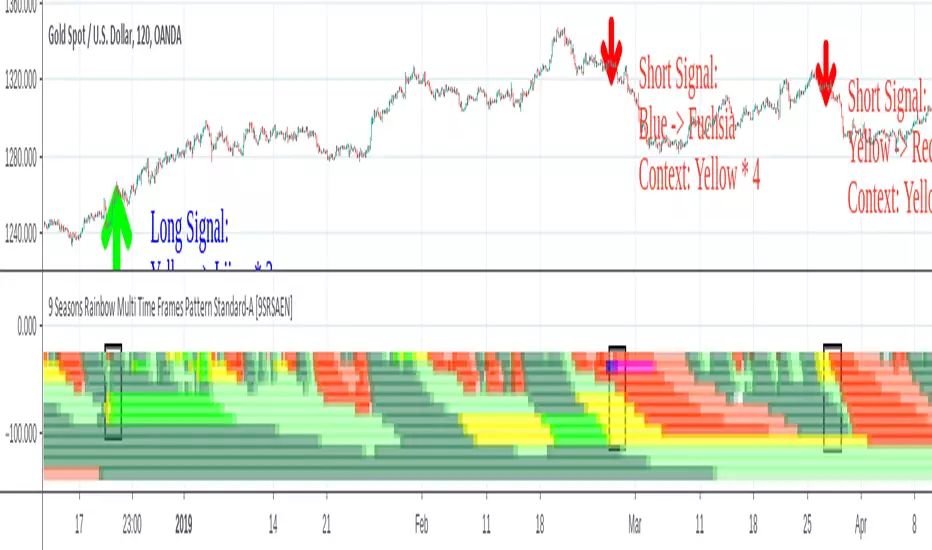
9 Seasons Rainbow Multi TimeFrames Pattern Standard-A [9SRSAEN]The indicator discovers profitable patterns by associating Price Season of multiple timeframes.
Full Name: 9 Seasons Rainbow - Multiple TimeFrames Associated Price Wave Pattern Indicator
Version: Invite-Only STANDARD-A
This is a sibling version OF “9 Seasons Rainbow Multi TimeFrames Pattern Standard ” with some functions for developing needs, without update notice function.
Language: English
Copyright: 2019
---------- How to use the indicator ----------
Go through the manual and related ideas underneath or follow the tutorials list. Look through the profitable patterns and related cases, wait for or set alert for specific profitable pattern.
---------- Definition: 9 Seasons ----------
A life cycle of Price Wave is divided into 9 Seasons. Each time frame, from 5 minute to 1 month, has 9 seasons, Independent of each other:
Bull (Green)
Bull Pullback (Light Green): a pullback or retracement
Resistance / Overbought (Yellow): a resistance area , may become a Top, or be broken through.
Crazy Bought (Lime): Price is going up in a high volatility , could be a valid breakout, or a Bull Trap.
Neutral (White): a wandering season without direction, evolves into Bull or Bear
Bear (Red)
Bear Bounce (Light Red): Price bounces
Support / Oversold (Blue): a support area , may become a Bottom, or be broken through.
Crazy Sold (Fuchsia): Price is going down in a high volatility , could be a valid breakdown, or a Bear Trap.
---------- Some important evolution between seasons ----------
Resistance / Overbought (Yellow) -> Crazy Bought (Lime):
Bull is breaking through a resistance.
Crazy Bought (Lime) -> Resistance / Overbought (Yellow):
This normally indicates a failed breakout, Price goes back to the resistance.
Crazy Bought (Lime) -> Bull Pullback (Light Green):
This normally indicates Price has risen to a new level
Support / Oversold (Blue) -> Crazy Sold (Fuchsia):
Bear is breaking through a support.
Crazy Sold (Fuchsia) -> Support / Oversold (Blue):
This normally indicates a failed breakdown, Price recovers to the support.
Crazy Sold (Fuchsia) -> Bear Bounce (Light Red):
This normally indicates price has dropped to a new level
---------- Rainbow Ribbons for Multiple TimeFrames ----------
Each ribbon of a rainbow represents a time frame.
The uppermost ribbon represents the shortest-term time frame - current time period of the chart, which is the time frame for trading.
The lowermost ribbon represent longest-term time frame, which work as environment, together with the other medium-term and long-term time frames.
The difference between two frames is 1.4142 fold (square root of 2), if level 1 is 15 minute, level 2 is 15 minute * (square root of 2) .
Examples of time frames in a rainbow:
For STANDARD in 15M: 15M - 21M - 30M - 42M - 60M(1H) - 85M - 120M(2H) - 170M
For PRO in 15M: 15M - 21M - 30M - 42M - 60M(1H) - 85M - 120M(2H) - 170M - 240M(4H) - 339M - 480M(8H) - 679M
---------- Trading Methods ----------
How to open a Long position?
When a profitable Long pattern appears, open small position first based on signal on shortest-term time frame; after retesting and confirming the support, open 2nd position; when it breaks through the resistance, pullbacks and confirms the breakout, open 3rd position.
How to exit a Long position?
Lift the Stop to a confirmed higher low, so that to take advantages of the bull run as possible.
How to open a Short position?
When a profitable Short pattern appears, open small position first based on signal on shortest-term time frame; after retesting and confirming the resistance, open 2nd position; when it breaks through the support, bounces and confirms the breakdown, add 3rd position.
How to exit a Short position?
Lower the Stop to a confirmed lower high, so that to take advantages of the bear run as possible.
---------- Versions Description ----------
The author reserves the right to change the features without advance notice.
PRO:
Invite-Only, with the following advanced features:
12 Ribbons Rainbow displays 9 Seasons of 12 time frames on a chart.
Advanced alert sets allows set alerts on short-term, medium-term, and long-term time frames.
Capability to input different trading instrument to compare with the current ticker.
Full time periods access allows apply it to broadest time periods, from 1 minute to 1 week (if history data is enough)
More new features in updates.
STANDARD:
Invite-Only, with the following advanced features:
8 Ribbons Rainbow displays 9 Seasons of 8 time frames on a chart.
Advanced alert sets allows set alerts on upper and lower frames.
Broad time periods access allows apply it to the most popular time periods, from 15 minute to 1 week (if history data is enough)
More new features in updates.
DEMO:
DEMO version is for trial purpose, having most of the features.
It is applicable to a list of trading instruments and specific time periods (1 hour to 1 day), which may change later without advance notice.
---------- Access to Indicators ----------
Please use DEMO version for Trial
Asking access to Invite-Only PRO and STANDARD versions:
9seasonsrainbowindicator.blogspot.com
Or contact the author.
---------- Install Invite Only: STANDARD & PRO Version----------
Ask access to STANDARD or PRO version
Open the chart -> Indicators (On the Top) -> Invite-Only Scripts (2nd button of the left bar)
Like/Favorite the indicator
Click to install on the chart
---------- About Loading Time ----------
It may take up to 2 minutes for your browser to load a new setting, depending on the your computer and network speed.
---------- List of the author's Indicators ----------
www.tradingview.com
---------- Disclaimer ----------
By using or requesting access to the indicator, you acknowledge that you have read and accepted that the indicator and any related content, including but not limited to: user manual, tutorials, ideas, videos, chats, emails, blog, are for the purpose of trading strategies studying and paper trading.
If a customer or user uses the indicator or related content mentioned above for live trading or investment, she/he should take all risks and be responsible for her/his own trading and investment activities.
---------- Updates ----------
The latest updates override the previous description.
To activate a update: Close the browser, Reopen the chart and apply the indicator.