Recherche dans les scripts pour "adx"

ADX Suavizado + DMI com Periodo RDNAdicione rafdourado para maiores informações de uso ou dicas para aprimoramento


ADX Crossover + BarColor v0.1Цвет бара показывает текущий тренд. Красный - падающий, зеленый - растущий. Желтый знак показывает начало или усиление тренда, флаг - завершение тренда, начало консолидации или следующего тренда

ADX/DI Trend Strengthpink line = directional with price, bull strength
black line = counter-directional with price, bear strength
histogram = trend strength confirmation
high pink + high histogram = strong bull
high pink + low histogram = weak bull
high black+ high histogram = strong bear
high black + low histogram = weak bear


ADX Volatility Moving AverageThe ADXVMA is a volatility based moving average with the volatility being determined by the value of the ADX. The ADXVMA provides levels of support during uptrends and resistance during downtrends. Original NT indicator by Fat Tails on futures.io, just ported it to pinescript

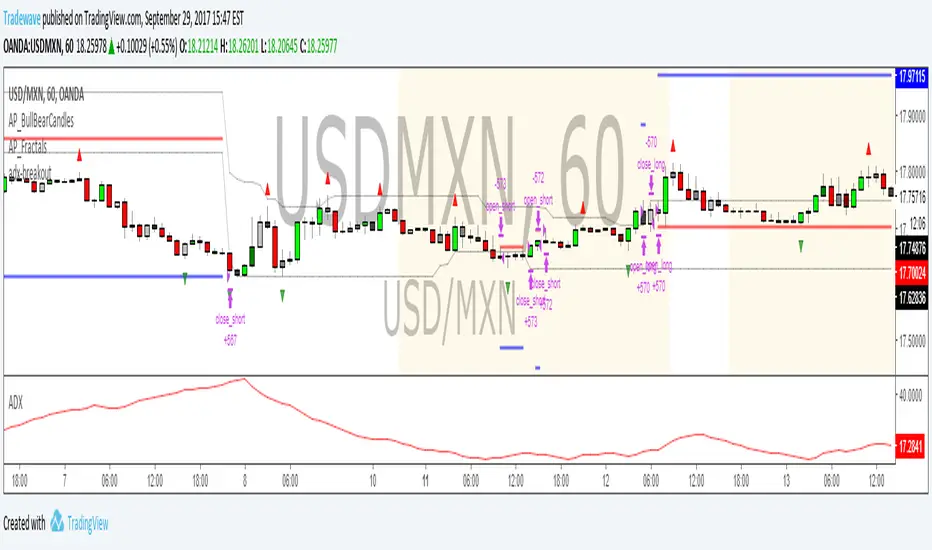
adx-breakout-rbDeveloper: Andrew Palladino
Creator: Rob Booker
Date: 9/29/2017
Description: Coming Soon.


HYBRID MARKET SCORE SUITE - Context Engine🔬 HYBRID MARKET SCORE SUITE - Context Engine — Algorithmic Imbalance Scoring & Compact 37-Indicator Dashboard
Monitoring regular divergences, OB/OS zones, statistical deviations, and 37 metrics simultaneously is impractical to do manually. HMSS - Context Engine updates them every tick in one compact dashboard, with an optional scoring layer.
━━━━━━━━━━━━━━━━━━━━━━━━━━━━━━━━━
🎯 WHAT IS THIS
HMSS - Context Engine
Performs **Real-Time Monitoring** of 37 technical metrics across 4 fixed timeframes ( 1H / 4H / 1D / 1W ) simultaneously, plus 3 cumulative tools that operate independently of timeframe selection.
It processes market data on a **tick-by-tick** basis without lookahead, designed to detect developing structural imbalances and major trend exhaustion points as they unfold.
Since the indicator analyzes fixed multi-timeframe streams, it is chart TF-independent : switching your main chart timeframe does not affect the internal logic or scoring.
━━━━━━━━━━━━━━━━━━━━━━━━━━━━━━━━━
🔧 "SWISS ARMY KNIFE" — Structural Context Tool
A compact table with extensive data for understanding where you are in the bigger picture:
34 MTF indicators across 4 timeframes (1H / 4H / 1D / 1W):
Divergences (13): RSI DIV, MFI DIV, CCI DIV, CMF DIV, MACD DIV, OBV DIV, Delta DIV, CVD DIV, DRSI DIV, ADX DIV, Elder DIV, Hull MA DIV, Stoch DIV
OB/OS (5): RSI OB/OS, MFI OB/OS, CCI OB/OS, Stoch OB/OS, DRSI OB/OS
Z-Score (9): RSI Z-Score, MFI Z-Score, CCI Z-Score, Stoch Z-Score, DRSI Z-Score, Delta Z-Score, CVD Z-Score, MACD Z-Score, OBV Z-Score
Other (7): CMF Zone, ADX Exhaustion, Elder Force, Williams VixFix (WVF), Volume Climax, ZMO EXT, NW ENV
3 Cumulative Tools (TF-independent): Basis, Williams A/D, PIV DIST (Pivot Distance)
A few "Special" metrics may be less familiar than classic oscillators, so here are quick notes on what they flag (not "better" indicators — just more niche tools):
NW ENV (Nadaraya–Watson Envelope): A kernel-smoothed price envelope (period 8) with deviation multipliers 2.25 (inner) and 7.75 (extreme). Labels reflect band breaches: !! = price outside the inner band (strong extension), !!! = outside the upper extreme band (rare upside extension), !!!! = outside the lower extreme band (rare downside extension). These are context tags for extension/mean-reversion risk, not trade commands.
Volume Climax: A Z-Score of volume over 20 periods. Flags unusually high volume above about 1.9σ . In practice, it helps highlight “crowd intensity” moments: heavy volume on a down candle can resemble panic-like supply; heavy volume on an up candle can resemble aggressive chasing. Treat it as context, not a directional guarantee.
ZMO EXT: normalized via Z-Score over a 100 -bar history. It highlights statistically stretched momentum when it deviates beyond roughly 2.0σ from its mean — a way to spot overheated acceleration.
Basis: Z-Score of the spread between perpetual futures and spot (Binance Futures Premium Index). High positive Z-Score = buyer overheating, deep negative = panic / liquidity deficit.
Williams A/D: Cumulative Williams Accumulation/Distribution indicator — tracks structural accumulation and distribution patterns.
PIV DIST (Pivot Distance): Percentage distance to the nearest significant Pivot level (weekly or monthly). Includes current, previous, and prior periods. Default is Camarilla (pivot type selectable in settings). Calculates extreme S6/R6 levels via progression. Cell highlights in counter-trend color when distance ≤0.5%. Extreme levels (5, 6) are colored unconditionally; Major levels (3, 4) — only when confirmed by score (|Score| > 1600). Does NOT participate in scoring — visual tool only.
All of this — across multiple timeframes simultaneously, in one compact table, without cluttering your chart with a dozen oscillators below. Works on any chart TF — your timeframe selection does not affect calculations.
Each block can be toggled in settings:
Divergence Block — forming regular divergences across oscillators/flows
OB/OS Block — overbought/oversold zones (RSI/MFI/CCI/Stoch etc.)
Z-Score Block — statistical deviations in sigmas (σ)
Special Indicators Block — special indicators and regime filters
Cumulative Block — Basis, Williams A/D, Pivot Distances
Scoring Block — Hybrid Engine (Score, Pattern, Breakdown, Attention, Trade Type, Veto)
Candle Coloring — optional highlighting of closed candles based on score level (threshold adjustable, off by default)
Use it as a dashboard for structural market assessment — a macro lens for trend context and positioning.
━━━━━━━━━━━━━━━━━━━━━━━━━━━━━━━━━
🧠 SCORING SYSTEM — For Structural Imbalances
An innovative data-driven engine that activates during moments of structural imbalance :
• Calibrated using 380,000+ historical market data records
• Compares current indicator combinations with historical patterns
• Assigns a Score when significant combinations are detected
Think of the scoring system as a Seismograph — it monitors deep market structure, not surface noise. Elevated readings indicate tectonic pressure building up. When it reaches extreme levels, it signals accumulated stress that historically precedes structural shifts — like seismic tension that eventually releases.
It is designed to assist in identifying the broader trend context and potential structural pivot points, if that aligns with your approach.
The system is calibrated on a multi-month historical dataset of 380,000+ records collected minute-by-minute from cryptocurrency markets (BTC, ETH, SOL). During this period, the market showed both multi-month lows and several ATH (All-Time High) events. Statistical dependencies and indicator combination patterns were identified from this data.
━━━━━━━━━━━━━━━━━━━━━━━━━━━━━━━━━
🧠 SCORING ENGINE ARCHITECTURE
Concept & Logic:
This system utilizes a hybrid approach, combining classical technical analysis with statistical profiling. Instead of simply summing up indicator signals, the algorithm compares the current market state against a proprietary database of historical patterns ("Profiles") collected for specific assets.
The calculation logic is layered:
1. Base Layer (Indicator Analysis):
The system monitors 34+ metrics (RSI, MFI, Z-Scores, CVD, OBV, ADX, VixFix, etc.).
Standard Deviation (25 pts, Dim Cell): Occurs when an indicator exceeds a standard volatility threshold (e.g., Z-Score > 1.5). This registers as a common local anomaly.
Profile Alignment (50 pts, Bright Cell): Occurs when a value hits specific historical thresholds recorded in the Asset Profile. These are values where structural shifts occurred in the past data samples.
2. The Core Pattern Recognition (compressed historical scenarios):
The system scans for ~14 compressed market scenarios (Patterns). A pattern becomes active only when its specific "Kernel" of indicators fires simultaneously with a Coverage Ratio > 70%.
3. Confluence & Weighting:
The final score reflects the density of these matches. It identifies the "Winning Side" (Long vs. Short bias) based on the accumulated weight of base and profile scores.
Score Breakdown (The "X-Ray" Row):
The dashboard displays a breakdown row ( L:… S:… C:… A:… K:… ) to visualize the components of the Total Score:
L / S (Baseline): Cumulative weight of active indicators for Long or Short bias.
C (Core Multiplier): A dynamic coefficient applied when the match with a historical pattern "Kernel" is high.
A (AddSig): Points for secondary confirming factors that reinforce the active pattern.
K (Key Features): Internal code for High-Impact Anomalies . These are rare statistical outliers (e.g., extreme Z-Scores > 3.0) that carry significant weight due to their historical correlation with structural expansion.
System States (Dashboard Output):
The text labels on the UI represent the statistical context of the market, not direct trade commands:
NEUTRAL: Balanced market, no dominant patterns.
SIGNAL FORMING: Early detection of potential accumulation or distribution structures.
TREND — WAIT: Market is in a directional phase; algorithm is monitoring for exhaustion or pivot points.
ON WATCH: High statistical confluence detected.
MAYBE LONG/SHORT: Directional statistical bias is present.
MAX SCORE: Indicates an "Extreme Score" condition. Historically, such values appear during significant structural extensions (Global Lows/Highs) where pattern coverage can approach 100% alongside statistical anomalies.
BREAKOUT: Context suggests structural continuation or level breach.
Disclaimer: This tool provides a statistical context assessment based on historical pattern matching. "Global Lows/Highs" / "New Low/High" are dataset-derived pattern names, not a directional claim. "Max Score" and "Key Features" describe rarity levels, not guaranteed outcomes. Past market behavior is not indicative of future performance.
━━━━━━━━━━━━━━━━━━━━━━━━━━━━━━━━━
🛡️ DRSI VETO — SAFETY MECHANISM
Sometimes "the setup exists by score", but the market is structurally overextended — which can make positioning riskier. This is where DRSI Veto comes in:
If the system indicates LONG , but DRSI Z-Score shows extreme overbought conditions (or vice versa for SHORT), the VETO activates, significantly reducing the final Score.
This helps filter out overextended "exhaustion" setups — technically valid by score, but stretched enough to increase mean-reversion risk without proper context. A clear VETO label appears in the table.
━━━━━━━━━━━━━━━━━━━━━━━━━━━━━━━━━
🎯 USE CASES — WHEN IT WORKS BEST
Dual Purpose: Efficiency & Detection
While the Scoring Engine identifies structural imbalances, the dashboard serves as your primary context workstation . It replaces the need for multiple oscillator panes, keeping your charts clean while providing a "Heads-Up Display" for Oscillators, Money Flow, and Statistical Anomalies across four timeframes at once.
Understanding "Where You Are":
The Context Engine is designed for positional awareness — understanding the broader trend structure before making decisions. It answers the question: "What is the macro context right now?"
Elevated Score (Not MAX):
An elevated score in the Context Engine often indicates that a strong trend is developing . This is valuable information for avoiding counter-trend positioning during powerful directional moves.
MAX Score — Rare Structural Events:
The scoring system fires less frequently than its companion (HMSS - Impulse Monitor), but when it does reach MAX Score levels, it indicates extreme structural tension — the kind that historically precedes major pivots. These are rare events measured in hours or days, not minutes.
When NOT to expect detections:
Markets can and often WILL pivot without the indicator firing. This tool is designed for major structural transitions . Smaller corrections and intraday reversals may occur without elevated readings — that's what HMSS - Impulse Monitor is for.
This is intentional: higher-score conditions are designed to be relatively rare, not a daily occurrence. If your approach values selectivity, it may help to treat elevated readings as “patient-wait” moments — markets often reward waiting for cleaner, high-confluence regimes rather than forcing a setup every session.
Think of the scoring system as a tectonic pressure gauge — most of the time it shows normal readings, but when stress accumulates to extreme levels, it provides valuable context for understanding structural risk. It's your seismograph: particularly useful when markets approach rare structural thresholds.
━━━━━━━━━━━━━━━━━━━━━━━━━━━━━━━━━
💡 FORMING DIVERGENCES — Real-Time Monitoring
Important note for experienced traders:
The indicator shows divergences that are CURRENTLY FORMING , not confirmed ones. This is Real-Time Monitoring mode — scoring updates every tick , allowing you to see the situation as it develops.
⚠️ No lookahead / no future leak: This script strictly uses lookahead=barmerge.lookahead_off (no future data is used in calculations).
On historical data, scores are displayed based on closed candles. For better historical detail, use lower timeframe candles.
If a "forming" pattern disappears — this is a normal part of real-time monitoring: the market changes, and the assessment/confluence recalculates accordingly.
━━━━━━━━━━━━━━━━━━━━━━━━━━━━━━━━━
📈 DIVERGENCE PERCENTAGES — WHAT THEY MEAN
Percentages next to divergences show "Divergence Intensity" — how strongly price and oscillator have diverged between points.
Note: The presence of a divergence itself is factored into the scoring system. However, the percentage values (intensity) are currently NOT included in Score calculation. We may add them in the future if we accumulate sufficient data confirming their statistical significance. For now, percentages serve as a visual hint for your own analysis — an additional confirmation filter.
Note: The indicator also draws forming divergence lines directly on the price chart — for 6 key oscillators (RSI, MACD, MFI, CCI, DRSI, CVD).
━━━━━━━━━━━━━━━━━━━━━━━━━━━━━━━━━
🔧 SCORING SYSTEM COMPATIBILITY
Statistical data profiles are available for: BTC, ETH, and SOL
• Default mode is AUTO : BTC/ETH/SOL detected automatically; all other assets use 'ALTS' (ETH-based) profile
• Manual Override: You can select a specific profile in settings if Bar Replay testing shows it tracks your asset's volatility better
• Indicator readings as tools work on ANY assets and markets
• For non-crypto instruments (Forex, Stocks): if alerts trigger too often or too rarely, adjust MAX SCORE Thresholds in settings
Note: Alert threshold settings (Base, Total, MAX SCORE) also affect "Attention Level" and "Trade Type" display in the UI.
━━━━━━━━━━━━━━━━━━━━━━━━━━━━━━━━━
🔔 ALERT SYSTEM (4-STEP)
The alert system is tiered (each step can be toggled on/off):
Step 1: Base Score — Triggers when mathematical confluence reaches base threshold
Step 2: Core Pattern — Triggers when algorithmic pattern is detected (Breakout/Formation)
Step 3: Total Score — Triggers when total Score reaches threshold
Step 4: MAX SCORE Alert — Final high-score alert (individual thresholds for BTC/ETH/SOL/ALT)
Important: Alert thresholds simultaneously calibrate Attention and Trade Type in the UI.
For automation (bots / webhook-based tools): use Webhook URL. Keep in mind that maximum score is often reached at the wick tip, not at candle close — backtesting on longer TFs may show delayed data.
━━━━━━━━━━━━━━━━━━━━━━━━━━━━━━━━━
🧩 HMSS ECOSYSTEM: HMSS - Context Engine vs. HMSS - Impulse Monitor
This script (HMSS - Context Engine) is one half of a specialized two-module system. It is designed to work either as a standalone tool or alongside its companion, HMSS - Impulse Monitor.
Why separate scripts? To maximize responsiveness and detail without hitting Pine Script resource limits (memory/execution time), the ecosystem is split into two specialized engines. Merging them would compromise real-time performance.
Note: HMSS - Impulse Monitor is not a different preset of the same script — it is a separate engine with its own indicator set, pattern library, and calibration profiles designed for a different purpose and a different analytical scope.
Key Differences & Synergy:
Distinct Purpose (Macro vs. Micro): HMSS - Context Engine (This Script): Designed for "Market Context." It analyzes 1H/4H/1D/1W structures to identify global trends and major structural pivots. HMSS - Impulse Monitor (Companion): Designed for "Market Reaction." It monitors 5m/15m/30m specifically to detect local exhaustion, liquidation wicks, and immediate imbalances.
Distinct Indicator Sets: Each engine includes components better suited for its timeframe domain. HMSS - Context Engine features structure-oriented indicators: ADX Exhaustion, OBV Divergence & Z-Score, Delta Histograms, VixFix (WVF), Basis, Williams A/D, and Pivot Distances. HMSS - Impulse Monitor incorporates VWAP Deviation and ATR Spikes — metrics more relevant for intraday dynamics.
Distinct Calibration Profiles: While both engines are developed using historical market observations, their pattern libraries and threshold values are calibrated independently for their respective metric sets and use-cases. The same market event may register as "Extreme" on HMSS - Context Engine while appearing "Neutral" on HMSS - Impulse Monitor if local momentum remains stable — and vice versa.
💡 Synergy Scenarios (How to use them together): Experienced traders often combine both modules to refine market context and decision-making:
• Trend Pullback: If HMSS - Context Engine indicates a strong Trend, but HMSS - Impulse Monitor shows "Extreme Overbought/Oversold" (correction against trend) — this often highlights a short-term counter-trend move within a larger structural trend.
• Major Reversal Risk: If BOTH HMSS - Context Engine and HMSS - Impulse Monitor indicate "Max Score" / "Extreme Imbalance" simultaneously — this is a rare statistical event (confluence of macro and micro exhaustion) that historically correlates with significant structural reversals.
━━━━━━━━━━━━━━━━━━━━━━━━━━━━━━━━━
⚙️ TECHNICAL NOTES
🕰️ Real-Time Monitor (No Past Labels):
Crucial Concept: This tool is a Real-Time Monitor , not a "signal painter." It shows the market state HERE AND NOW — it does NOT draw historical Buy/Sell arrows or preserve past dashboard states. The only elements drawn on the chart are currently forming divergence lines.
Calculation Heavy:
We utilize maximum Pine Script limits for calculations. Initial loading may take up to 12-15 seconds — this reflects the precision and volume of processed data. After loading, the indicator operates without noticeable delays, processing data every tick .
Chart TF Independence:
The indicator analyzes fixed MTF streams, so your chart timeframe selection does not affect results. For reduced load and faster response, 5-60 minute charts are preferred.
Recommended Chart Timeframe:
For speed and lower load: 5–60 minutes (optimal)
For detailed history, you can go down to lower timeframes, but this is a performance/memory tradeoff
Bar Replay — How to See Past Performance:
To understand how the Scoring Engine reacted to specific market moves (e.g., a past crash or pump), use Bar Replay Mode :
1s to 30s: Best accuracy (precise tick-emulation)
1 min: Acceptable (if your plan lacks seconds-based intervals)
Higher TFs: Works, but for best detail — especially to see MAX Score events — lower TFs are recommended
To manage the extensive database of pattern weights and profiles while maintaining high performance, this engine utilizes a custom optimized data structure. This ensures the script operates smoothly within Pine Script's resource limits without compromising the depth of historical analysis.
━━━━━━━━━━━━━━━━━━━━━━━━━━━━━━━━━
🔬 TECHNICAL APPROACH (for the curious)
The indicator uses a proprietary compact data encoding system that allows transmitting information about divergences, their type, length, and intensity in a single numeric value. This enables efficient aggregation of data from multiple timeframes without exceeding Pine Script limits.
The scoring system is built on the Statistical Pattern Matching principle: current indicator combinations are compared against a library of statistically significant patterns, each with its own weight and type (Formation/Breakout).
━━━━━━━━━━━━━━━━━━━━━━━━━━━━━━━━━
🚀 QUICK START
Add HYBRID MARKET SCORE SUITE - Context Engine to your chart.
Position table (recommended: bottom-right ) and adjust Offset / Spacer so it doesn't overlap price action.
In settings, toggle blocks by groups: Divergences / OB-OS / Z-Score / Special / Cumulative / Scoring — to match your trading style and load preferences.
For comfortable operation, use chart TF 5–60m .
━━━━━━━━━━━━━━━━━━━━━━━━━━━━━━━━━
🔄 DEVELOPMENT
The indicator receives periodic updates, including statistical pattern refinements as new market data is accumulated, to maintain relevance with current market conditions. Update schedule is not guaranteed.
━━━━━━━━━━━━━━━━━━━━━━━━━━━━━━━━━
🛡️ DISCLAIMER
This script is provided for informational and educational purposes only and does NOT constitute financial advice, investment advice, or a recommendation to buy/sell any asset.
All examples, descriptions, and statistics are based on historical observations. Market conditions can change, patterns can fail, and signals/labels may disappear or update in real time. No results are guaranteed.
Use this tool as one input among many. Always apply your own judgment, risk management, and independent verification (DYOR). Trading — especially with leverage — involves substantial risk, including the risk of total loss. You are solely responsible for your decisions and outcomes.

Color Candles - Didi's Needles setup [HeegerBot]Coloration Indicator based on Didi Aguiar's needle setup.
Indicador de Coloração baseado no setup de agulhadas do Didi Aguiar.
The setup consists of the crossover of three moving averages, along with the analysis of an ascending trend in the ADX and the opening of Bollinger Bands.
The setup involves the crossing of three moving averages, along with the trend analysis in the ADX and the open Bollinger Bands.
The moving averages will be named "Didi Index". We will have the 3-period average as "Fast Average", the 8-period average as "Median Average", and the 20-period average as "Slow Average". When the Fast Average crosses the Median Average, we will have an alert, and when the Slow Average crosses the Median Average, we will have a confirmation. To adjust the Didi Index in the signals, the Median Average was normalized, that is, it will always be equal to 0. For the Slow and Fast Average, we will only consider the percentage difference in relation to the Median Average.
In addition to the moving averages, we analyze whether the ADX is rising, with DI+ above DI- to indicate an uptrend, or if the ADX is rising, with DI- above DI+ to indicate a downtrend. We also check if the Bollinger Bands are open. With these conditions, we will have a Needle.
Now I'm going to detail how I set this up on the indicator and some filters that I inserted for my personal use, along with some additional signals from the setup.
# Needle Alert
Firstly, we have the "Needle Alert" signal. This signal occurs when the Fast Average crosses the Median Average, along with the trend confirmation in the ADX and the opening of the Bollinger Bands. The filter is set at "1", which means we will only consider the needle alert when the percentage difference between the Slow Average and the Median Average is below 1%. This signal can be used as an entry point or to monitor the asset. Let's go through the examples:
• For a "Buy Alert", the Fast Average must cross the Median Average from bottom to top, and the percentage difference between the Slow Average and the Median Average should be less than +1% and greater than 0, as indicated by the Didi Index.
• For a "Sell Alert", the Fast Average must cross the Median Average from top to bottom, and the percentage difference between the Slow Average and the Median Average should be greater than -1% and less than 0, as indicated by the Didi Index.
We also have the alert projection, which serves as a signal to attract attention and monitor the asset. I use a "0.1" filter, which means that the percentage difference between the Fast Average and the Median Average must be equal to or less than 0.1%. Let's look at the example:
• For a "Buy Alert Projection", the Fast Average should be below the Median Average, and the percentage difference between the Fast Average and the Median Average should be greater than -0.1% and less than 0. In addition, the Slow Average should be above the Median Average in the Didi Index.
• For a "Buy Alert Projection", the Fast Average should be below the Median Average, and the percentage difference between the Fast Average and the Median Average should be greater than -0.1% and less than 0. In addition, the Slow Average should be above the Median Average in the Didi Index.
# Needle
After the Needle Alert, we have the Needle Confirmation, which occurs when the Slow Average crosses the Median Average after the alert. This signal is used to enter the operation. Let's divide this signal into two parts:
1. Needle: We use a filter of "3" (adjustable). This means that, to be considered a "Needle", the candle distance between the Alert (crossing of the Fast Average with the Median Average) and the Confirmation (crossing of the Slow Average with the Median Average) must be equal to or less than 3 candles. Also, there needs to be a trend on the ADX and the Bollinger Bands should be open.
2. Queijo Minas Needle (QM): Essentially, it's a Needle that occurs outside of the filter, with a candle distance between the Alert and the Confirmation above "3" candles. A trend on the ADX and open Bollinger Bands are also necessary.
To anticipate the Needle Confirmation, we use the "Needle Projection" signal. This signal has two filters: the "Needle Projection with Alert", set as "0.1%", and the "Needle Projection after the Alert", set as "0.3%".
1. The "Needle Projection with Alert" generates the signal when the "Needle Alert" occurs (crossing of the Fast Average with the Median Average), as long as the difference between the Slow Average and the Median Average is less than 0.1%.
2. The "Needle Projection after the Alert" generates the signal when the Fast Average has already crossed the Median Average, and the difference between the Slow Average and the Median Average should be less than 0.3%.
# BJMA (Spider Woman's Kiss)
There is another variation of the needle called BJMA. Essentially, it occurs when the Fast Average and the Slow Average approach the Median Average (each on one pole), but do not cross the Median and return to where they came from. In this signal, we have two filters: "Delta BJMA previous candle" and "Delta BJMA current candle". Let's see an example:
• Buy BJMA: First, we observe the previous candle, where the Fast Average must be above 0 (above the Median Average) and the percentage difference should be less than 0.02. In relation to the Slow Average, the configuration is the same, but in the negative sense, that is, it should be below 0 and above -0.02. Now, in the current candle, the Fast Average should be above 0 and below 0.05, while the Slow Average should be below 0 and above -0.05.
• Sell BJMA: First, we observe the previous candle, where the Fast Average must be below 0 (below the Median Average) and the percentage difference should be greater than -0.02. In relation to the Slow Average, the configuration is the same, but in the positive sense, that is, it should be above 0 and below 0.02. Now, in the current candle, the Fast Average should be below 0 and above -0.05, while the Slow Average should be above 0 and below 0.05.
Now, let's look at two signals that are commonly used to stay in a position.
# Fake Point
The Fake Point is primarily used to identify retracements before a continuation of the prevailing trend. Typically, it is preceded by a Needle Confirmation or BJMA signal. Here are some examples:
• Fake Sell (Signal to Maintain a Buy Position): The Fast Average crosses the Median from top to bottom (entering the negative pole of the Didi Index), while the Slow Average, which is already below the Median (below 0), continues to decline further, increasing the percentage difference between the Fast and Slow Averages in the negative pole.
• Fake Buy (Signal to Maintain a Sell Position): It is the same as the fake sell scenario but in the positive pole. The Fast Average crosses the Median, entering the positive pole of the Didi Index, while the Slow Average, which was already above the Median, continues to increase the percentage difference with the Median. For example, if the Slow Average was at +1 on the Didi Index, it would now be at +1.3.
There is also another variation of the Fake Breakout that takes into consideration the ADX (Average Directional Index) to confirm the trend direction. In other words, if we have a fake sell signal that suggests a buy position, we want the ADX to indicate a buying trend, and vice versa.
# Bought and Sold
This signal basically checks whether the indicators continue to confirm the previous signals. There are two variations: "Bought/Sold" and "Bought/Sold without Bollinger Bands". Let's see an example:
• Bought: The Didi Index is in the buying position, which means the Fast Average is above the Median Average (above 0), and the Slow Average is below the Median Average. Additionally, the ADX is indicating a buying trend and the Bollinger Bands are open.
• Sold: The Didi Index is in the selling position, which means the Fast Average is below 0 and the Slow Average is above 0. Moreover, the ADX is indicating a selling trend and the Bollinger Bands are open.
• Bought/Sold without Bollinger Bands: It's the same signal, but without considering whether the Bollinger Bands are open or not.
We can also consider the "Bought/Sold" signal based on the Trix and Stochastic, which would be additional confirmations of the movement.
Personally, I do not activate the Bought/Sold signal.
Now we come to signals to exit the position or take partial profits.
# Close
This exit signal is based on the following indicators: ADX, Bollinger Bands, Trix, and Stochastic. We wait for the ADX Kick or the falling ADX, along with the Bollinger Bands closing, and the Trix and Stochastic changing to the opposite side. Let's see some examples:
• Close a Buy: The ADX was in a buying trend (ADX rising and DI+ above DI-), but then the ADX Kick occurs or the ADX starts to fall. In addition, the Bollinger Bands close, and the Trix and Stochastic should switch to the sell signal.
• Close a Sell: The ADX was in a selling trend (ADX rising and DI- above DI+), but then the ADX Kick occurs or the ADX starts to fall. Also, the Bollinger Bands close, and the Trix and Stochastic should switch to the buy signal.
All indicators must provide signals together, but it is not necessary for all to occur in the exact same candle. For example:
1. The ADX Kick may occur, and the Trix and Stochastic switch to the buy signal, but the Bollinger Bands still remain open. In this case, we still do not have the exit signal.
2. In the next candle, the ADX continues to fall (after the Kick), the Trix and Stochastic continue to indicate buying, but this time the Bollinger Bands close. In this case, we have the "Close a Sell" signal.
It is important that all indicators are in accordance with the necessary signals, even if they occur in different candles, in order for the exit signal to be triggered.
# Close with Alert
This signal occurs when the Didi Index switches to the opposite side from where it was, along with a trend on the ADX, provided it's not a fake point. Let's see some examples:
• Close Buy - Sell Alert: Suppose we were in a buy position on the previous candle. In the current candle, the Fast Average crosses the Median Average from top to bottom, and the ADX indicates a sell trend. In this case, we completely close our buy position or make a partial realization.
• Close Sell - Buy Alert: Suppose we were in a sell position on the previous candle. In the current candle, the Fast Average crosses the Median Average from bottom to top, and the ADX indicates a buy trend. In this case, we completely close our sell position or make a partial realization.
# Divergence in Didi Index and Stochastic.
The signal of divergence in the Didi Index and the Stochastic is used to identify situations where there is a divergence in one of these indicators. When identified, a box will be drawn in the region where the divergence occurred. This region is considered an area of conflict or strength.
Depending on the context of the chart, these regions can be used as points for total or partial exit of positions. This happens because there may be a correction of the movement after these divergences occur. In some cases, if there is an ignition candle that breaks through this region, it can be used as a possible entry point into the position, taking advantage of a possible pullback.
It is recommended to wait for the candle to close before considering the signals, as this allows for a more solid confirmation.
---------------------------------------------------------------------------------------------------------------------
Indicador de Coloração baseado no setup de agulhadas do Didi Aguiar.
O setup consiste no cruzamento de 3 médias móveis, juntamente com a análise da tendência no ADX e das bandas de Bollinger abertas.
As médias móveis serão nomeadas "Didi Index". Teremos a média de 3 períodos como "Média Rápida", a média de 8 períodos como "Média Mediana" e a média de 20 períodos como "Média Lenta". Quando a Média Rápida cruzar a Média Mediana, teremos um alerta e, quando a Média Lenta cruzar a Média Mediana, teremos uma confirmação. Para ajustar o Didi Index nos sinais, a Média Mediana foi normalizada, isto é, ela sempre será igual a 0. Para a Média Lenta e a Média Rápida, levaremos em consideração apenas a diferença percentual em relação à Média Mediana.
Além das médias móveis, analisamos se o ADX está em ascensão, com o DI+ acima do DI- para indicar uma tendência de alta, ou se o ADX está subindo, com o DI- acima do DI+ para indicar uma tendência de baixa. Também verificamos se as bandas de Bollinger estão abertas. Com essas condições, teremos uma Agulhada.
Agora vou detalhar como estabeleci isso no indicador e alguns filtros que inseri para o meu uso pessoal, além de alguns sinais adicionais do setup.
# Alerta de Agulhada
Primeiramente, temos o sinal de "Alerta de Agulhada". Este sinal acontece quando a Média Rápida cruza a Média Mediana, junto com a confirmação da tendência no ADX e a abertura das Bandas de Bollinger. O filtro está ajustado em "1", o que significa que só levaremos em consideração o alerta de agulhada quando a diferença percentual entre a Média Lenta e a Média Mediana estiver abaixo de 1%. Esse sinal pode ser utilizado como um ponto de entrada ou para monitorar o ativo. Vamos aos exemplos:
• Para um "Alerta de Compra", a Média Rápida deve cruzar a Média Mediana de baixo para cima, e a diferença percentual entre a Média Lenta e a Média Mediana deve ser menor que +1% e maior que 0, conforme indicado pelo Didi Index.
• Para um "Alerta de Venda", a Média Rápida deve cruzar a Média Mediana de cima para baixo, e a diferença percentual entre a Média Lenta e a Média Mediana deve ser maior que -1% e menor que 0, conforme indicado pelo Didi Index.
Também temos a projeção do alerta, que serve como um sinal para chamar atenção e monitorar o ativo. Eu uso um filtro de "0.1", o que significa que a diferença percentual entre a Média Rápida e a Média Mediana deve ser igual ou menor que 0.1%. Vamos ver o exemplo:
• Para uma "Projeção de Alerta de Compra", a Média Rápida deve estar abaixo da Média Mediana, e a diferença percentual entre a Média Rápida e a Média Mediana deve ser maior que -0.1% e menor que 0. Além disso, a Média Lenta deve estar acima da Média Mediana no Didi Index.
• Para uma "Projeção de Alerta de Compra", a Média Rápida deve estar abaixo da Média Mediana, e a diferença percentual entre a Média Rápida e a Média Mediana deve ser maior que -0.1% e menor que 0. Além disso, a Média Lenta deve estar acima da Média Mediana no Didi Index.
# Agulhada
Após o Alerta de Agulhada, temos a confirmação da Agulhada, que ocorre quando a Média Lenta cruza a Média Mediana após o alerta. Esse sinal é utilizado para entrar na operação. Vamos dividir esse sinal em duas partes:
1. Agulhada: Utilizamos um filtro de "3" (ajustável). Isso significa que, para ser considerada uma "Agulhada", a distância em velas entre o Alerta (cruzamento da Média Rápida com a Média Mediana) e a Confirmação (cruzamento da Média Lenta com a Média Mediana) deve ser igual ou menor que 3 velas. Além disso, é necessário ter uma tendência no ADX e as Bandas de Bollinger devem estar abertas.
2. Agulhada Queijo Minas (QM): Basicamente, é uma agulhada que ocorre fora do filtro, com uma distância em velas entre o Alerta e a Confirmação acima de "3" velas. Também é necessário ter uma tendência no ADX e as Bandas de Bollinger devem estar abertas.
Para antecipar a confirmação da Agulhada, utilizamos o sinal de "Projeção de Agulhada". Esse sinal possui dois filtros: o "Projeção de Agulhada com Alerta", configurado como "0.1%", e o "Projeção de Agulhada após o Alerta", configurado como "0.3%".
1. "Projeção de Agulhada com Alerta" gera o sinal quando ocorre o "Alerta de Agulhada" (cruzamento da Média Rápida com a Média Mediana), desde que a diferença entre a Média Lenta e a Média Mediana seja menor que 0.1%.
2. "Projeção de Agulhada após o Alerta" gera o sinal quando a Média Rápida já cruzou a Média Mediana, e a diferença entre a Média Lenta e a Média Mediana deve ser menor que 0.3%.
# BJMA (Beijo da Mulher Aranha)
Existe uma outra variação da agulhada chamada BJMA. Essencialmente, ocorre quando a Média Rápida e a Média Lenta se aproximam da Média Mediana (cada uma em um polo), mas não cruzam a Mediana e voltam para o lado de onde vieram. Nesse sinal, temos dois filtros: "Delta BJMA vela anterior" e "Delta BJMA vela atual". Vejamos um exemplo:
• BJMA de Compra: Primeiramente, observamos a vela anterior, onde a Média Rápida deve estar acima de 0 (acima da Média Mediana) e a diferença percentual deve ser menor que 0.02. Em relação à Média Lenta, a configuração é a mesma, porém no sentido negativo, ou seja, ela deve estar abaixo de 0 e acima de -0.02. Agora, na vela atual, a Média Rápida deve estar acima de 0 e abaixo de 0.05, enquanto a Média Lenta deve estar abaixo de 0 e acima de -0.05.
• BJMA de Venda: Primeiramente, observamos a vela anterior, onde a Média Rápida deve estar abaixo de 0 (abaixo da Média Mediana) e a diferença percentual deve ser maior que -0.02. Em relação à Média Lenta, a configuração é a mesma, porém no sentido positivo, ou seja, ela deve estar acima de 0 e abaixo de 0.02. Agora, na vela atual, a Média Rápida deve estar abaixo de 0 e acima de -0.05, enquanto a Média Lenta deve estar acima de 0 e abaixo de 0.05.
Agora vamos abordar dois sinais que são normalmente utilizados para manter uma posição.
# Ponto Falso (Fake Point)
O Ponto Falso é usado para identificar uma retração antes de retomar o movimento. Geralmente, ele ocorre após um sinal de Agulhada ou BJMA. Vejamos exemplos:
• Venda Falsa (sinal para manter uma posição de compra): A Média Rápida cruza a Média Mediana de cima para baixo (entrando no polo negativo do Didi Index), enquanto a Média Lenta, que já está abaixo da Média Mediana (abaixo de 0), continua caindo, aumentando assim a diferença percentual entre a Média Lenta e a Média Mediana no polo negativo.
• Compra Falsa (sinal para manter uma posição de venda): O cenário é semelhante, mas no polo positivo. A Média Rápida cruza a Média Mediana, passando para o lado positivo do Didi Index, enquanto a Média Lenta, que já estava acima da Média Mediana, continua aumentando a diferença percentual em relação à Média Mediana. Por exemplo, se a Média Lenta estava em +1 no Didi Index, agora ela está em +1.3.
Também existe uma variação do Ponto Falso em que verificamos se a tendência no ADX está se mantendo na mesma direção. Ou seja, se tivermos uma Venda Falsa (que seria um sinal para permanecermos em uma posição de compra), é importante que o ADX esteja indicando uma tendência de compra, e vice-versa. Dessa forma, consideramos não apenas o cruzamento das médias, mas também a confirmação da tendência no ADX. Essa variação é chamada de Ponto Falso com Tendência (Fake Point with Trend).
# Comprado e Vendido
Esse sinal, essencialmente, verifica se os indicadores estão mantendo a confirmação dos sinais anteriores. Existem duas variações: "Comprado/Vendido" e "Comprado/Vendido sem Bandas de Bollinger". Vejamos um exemplo:
• Comprado: O Didi Index está em compra, o que significa que a Média Rápida está acima da Média Mediana (acima de 0) e a Média Lenta está abaixo da Média Mediana. Além disso, o ADX está indicando uma tendência de compra e as Bandas de Bollinger estão abertas.
• Vendido: O Didi Index está em venda, o que significa que a Média Rápida está abaixo de 0 e a Média Lenta está acima de 0. Além disso, o ADX está indicando uma tendência de venda e as Bandas de Bollinger estão abertas.
• Comprado/Vendido sem Bollinger: É o mesmo sinal, porém sem considerar se as Bandas de Bollinger estão abertas ou não.
Podemos também considerar o "Comprado/Vendido" com base no Trix e no Estocástico, que seriam confirmações adicionais do movimento.
Eu, pessoalmente, não deixo ativado o sinal de Comprado/Vendido.
Agora chegamos aos sinais de saída da posição ou de realização parcial.
# Fechar (Close)
Este sinal de saída baseia-se nos seguintes indicadores: ADX, Bandas de Bollinger, Trix e Estocástico. Aguardamos o Kick do ADX ou o ADX em queda, juntamente com as Bandas de Bollinger se fechando, e o Trix e o Estocástico mudando para o lado oposto. Vamos ver alguns exemplos:
• Fechar uma Compra (Close Buy): O ADX estava em uma tendência de compra (ADX subindo e DI+ acima do DI-), mas em seguida ocorre o Kick do ADX ou o ADX começa a cair. Além disso, as Bandas de Bollinger se fecham e o Trix e o Estocástico devem mudar para o sinal de venda.
• Fechar uma Venda (Close Sell): O ADX estava em uma tendência de venda (ADX subindo e DI- acima do DI+), mas em seguida ocorre o Kick do ADX ou o ADX começa a cair. Além disso, as Bandas de Bollinger se fecham e o Trix e o Estocástico devem mudar para o sinal de compra.
Todos os indicadores devem fornecer os sinais em conjunto, mas não é necessário que todos ocorram exatamente na mesma vela. Por exemplo:
1. Pode ocorrer o Kick do ADX e o Trix e o Estocástico mudarem para o sinal de compra, mas as Bandas de Bollinger ainda permanecerem abertas. Nesse caso, ainda não teremos o sinal de saída.
2. No candle seguinte, o ADX continua caindo (após o Kick), o Trix e o Estocástico continuam indicando compra, mas desta vez as Bandas de Bollinger se fecham. Nesse caso, teremos o sinal de "Fechamento de uma Venda".
É importante que todos os indicadores estejam em conformidade com os sinais necessários, mesmo que ocorram em velas diferentes, para que seja acionado o sinal de saída.
# Fechar com Alerta (Close with Alert)
Esse sinal ocorre quando o Didi Index muda para o lado oposto do que estava, juntamente com uma tendência no ADX, desde que não seja um ponto falso. Vejamos exemplos:
• Fechar Compra - Alerta de Venda: Suponha que estávamos em uma posição de compra no candle anterior. No candle atual, a Média Rápida cruza a Média Mediana de cima para baixo, e o ADX indica uma tendência de venda. Nesse caso, encerramos completamente nossa posição de compra ou realizamos uma realização parcial.
• Fechar Venda – Alerta de Compra: Suponha que estávamos em uma posição de venda no candle anterior. No candle atual, a Média Rápida cruza a Média Mediana de baixo para cima, e o ADX indica uma tendência de compra. Nesse caso, encerramos completamente nossa posição de venda ou realizamos uma realização parcial.
# Divergência no Didi Index e no Estocástico.
O sinal de divergência no Didi Index e no Estocástico é usado para identificar situações onde há uma divergência em um desses indicadores. Quando identificada, uma caixa será desenhada na área onde a divergência ocorreu. Essa área é considerada uma zona de briga ou força.
Dependendo do contexto do gráfico, essas zonas podem ser usadas como pontos de saída total ou parcial das posições. Isso acontece porque pode haver uma correção do movimento após a ocorrência dessas divergências. Em alguns casos, se houver uma vela de ignição que quebre essa zona, ela pode ser usada como um possível ponto de entrada na posição, aproveitando um possível pullback.
É recomendado aguardar o fechamento do candle para levar os sinais em consideração, pois isso permite obter uma confirmação mais sólida.
FibPulse144 [CHE] FibPulse144 — ADX-gated 13/21 crossover with 144-trend regime and closed-bar labels
Summary
FibPulse144 combines a fast moving-average crossover with a 144-period trend regime and an ADX strength gate. Signals are confirmed on closed bars only and drawn as labels on the price chart, while an ADX line in a separate pane provides context. Color gradients are derived from normalized ADX, so visual intensity reflects trend strength without changing the underlying logic. The approach reduces false flips during weak conditions and keeps entries aligned with the dominant trend.
Motivation: Why this design?
Traditional crossover signals can flip repeatedly during sideways phases and often trigger against the higher-time regime. By requiring alignment with a slower trend proxy and by gating entries through a rising ADX condition, FibPulse144 favors structurally cleaner transitions. Gradient coloring communicates strength visually, helping users temper aggressiveness without additional indicators.
What’s different vs. standard approaches?
Baseline: Classic dual-MA crossover with unconditional signals.
Architecture differences:
Two-bar regime confirmation against a 144-period trend average.
Pending-signal logic that waits for regime and optional ADX approval.
ADX strength gate using the prior reading relative to a user threshold and earlier value.
Gradient colors scaled by an ADX window with gamma controls.
Price-chart labels enforced via overlay on an otherwise pane-based indicator.
Practical effect: Fewer signals during weak or choppy conditions, labels that appear only after a bar closes, and color intensity that mirrors trend quality.
How it works (technical)
The script computes fast and slow moving averages using the selected method and lengths. A separate 144-length average defines the regime using a two-bar confirmation above or below it. Crossovers are observed on the previous bar to avoid intrabar ambiguity; once a prior crossover is detected, it is stored as pending. A pending long requires regime alignment and, if enabled, an ADX condition based on the previous reading being above the threshold and greater than an earlier reading. The state machine holds neutral, long, or short until an exit condition or ADX reset is met. ADX is normalized within a user window, scaled with gamma, and mapped to up and down color palettes to render gradients. Labels on the price panel are forced to overlay, while the ADX line and threshold guide remain in a separate pane.
Parameter Guide
Source — Input data for all calculations. Default: close. Tip: keep consistent with your chart.
MA Type — EMA or SMA. Default: EMA. EMA reacts faster; SMA is smoother.
Fast / Slow — Fast and slow lengths for crossover. Defaults: 13 and 21. Shorter reacts earlier; longer reduces noise.
Trend — Regime average length. Default: 144. Larger values stabilize regime; smaller values increase sensitivity.
Use 144 as trend filter — Enables regime gating. Default: true. Disable to allow raw crossovers.
Use ADX filter — Requires ADX strength. Default: true. Disable to allow signals regardless of strength.
ADX Len — DI and ADX smoothing length. Default: 14. Higher values smooth strength; lower values react faster.
ADX Thresh — Minimum strength for signals. Default: 25. Raise to reduce flips; lower to capture earlier moves.
Entry/Exit labels (price) — Price-panel labels on state changes. Default: true.
Signal labels in ADX pane — Small markers at the ADX value on entries. Default: true.
Label size — tiny, small, normal, large. Default: normal.
Enable barcolor — Optional candle tint by regime and gradient. Default: false.
Enable gradient — Turns on ADX-driven color blending. Default: true.
Window — Bars used to normalize ADX for colors. Default: 100; minimum: 5.
Gamma bars / Gamma plots — Nonlinear scaling for bar and line intensities. Default: 0.80; between 0.30 and 2.00.
Gradient transp (0–90) — Transparency for gradient colors. Default: 0.
MA fill transparency (0–100) — Fill opacity between fast and slow lines. Default: 65.
Palette colors (Up/Down) — Dark and neon endpoints for up and down gradients. Defaults as in the code.
Reading & Interpretation
Fast/Slow lines: When the fast line is above the slow line, the line and fill use the long palette; when below, the short palette is used.
Trend MA (144): Neutral gray line indicating the regime boundary.
Labels on price: “LONG” appears when the state turns long; “SHORT” when it turns short. Labels appear only after the bar closes and conditions are satisfied.
ADX pane: The ADX line shows current strength. The dotted threshold line is the user level for gating. Optional small markers indicate entries at the ADX value.
Bar colors (optional): Candle tint intensity reflects normalized ADX. Higher intensity implies stronger conditions.
Practical Workflows & Combinations
Trend following: Use long entries when fast crosses above slow and price has held above the trend average for two bars, with ADX above threshold. Mirror this for shorts below the trend average.
Exits and stops: Consider reducing exposure when price closes on the opposite side of the trend average for two consecutive bars or when ADX fades below the threshold if the ADX filter is enabled.
Structure confirmation: Combine with higher-timeframe structure such as swing highs and lows or a simple market structure overlay for confirmation.
Multi-asset/Multi-TF: Works across liquid assets. For lower timeframes, consider a slightly lower ADX threshold; for higher timeframes, maintain or raise the threshold to avoid unnecessary flips.
Behavior, Constraints & Performance
Repaint/confirmation: Signals are based on previous-bar crossovers and are confirmed on bar close. No higher-timeframe or security calls are used. Intrabar markers are not relied upon.
Resources: The script declares `max_bars_back` of 2000, uses no loops or arrays, and employs persistent variables for pending signals and state.
Known limits: Crossover systems can lag after sudden reversals. During tight ranges, disabling the ADX filter may increase flips; keeping it enabled may skip early transitions.
Sensible Defaults & Quick Tuning
Starting point: EMA, 13/21/144, ADX length 14, ADX threshold 25, gradients on, barcolor off.
Too many flips: Increase ADX threshold or length; increase trend length; consider SMA instead of EMA.
Too sluggish: Lower ADX threshold slightly; shorten fast and slow lengths; reduce the trend length.
Colors overpowering: Increase gradient transparency or reduce gamma values toward one.
What this indicator is—and isn’t
This is a visualization and signal layer that combines crossover, regime, and strength gating. It does not predict future movements, manage risk, or execute trades. Use it alongside clear structure, risk controls, and a defined position management plan.
Disclaimer
The content provided, including all code and materials, is strictly for educational and informational purposes only. It is not intended as, and should not be interpreted as, financial advice, a recommendation to buy or sell any financial instrument, or an offer of any financial product or service. All strategies, tools, and examples discussed are provided for illustrative purposes to demonstrate coding techniques and the functionality of Pine Script within a trading context.
Any results from strategies or tools provided are hypothetical, and past performance is not indicative of future results. Trading and investing involve high risk, including the potential loss of principal, and may not be suitable for all individuals. Before making any trading decisions, please consult with a qualified financial professional to understand the risks involved.
By using this script, you acknowledge and agree that any trading decisions are made solely at your discretion and risk.
Do not use this indicator on Heikin-Ashi, Renko, Kagi, Point-and-Figure, or Range charts, as these chart types can produce unrealistic results for signal markers and alerts.
Best regards and happy trading
Chervolino

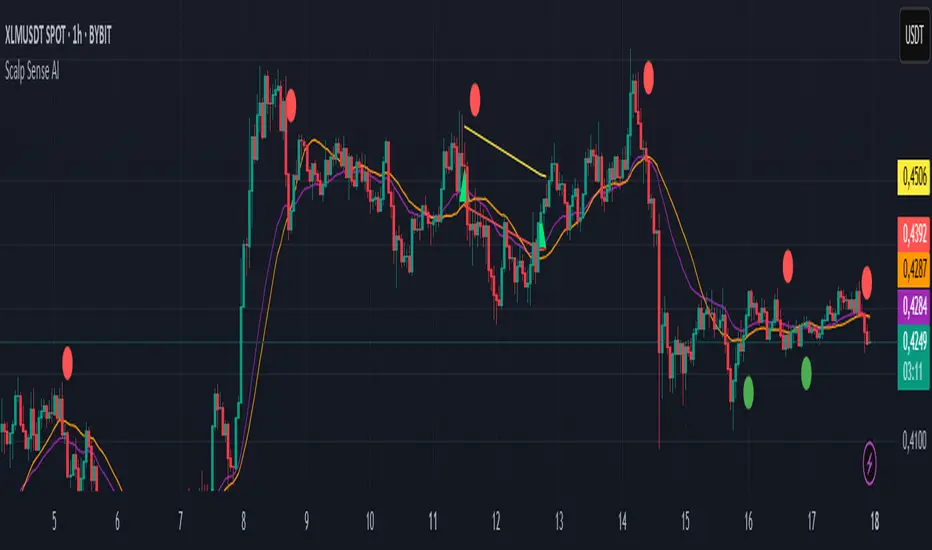
Scalp Sense AI# Scalp Sense AI (No Repaint)
**Adaptive trend & reversal detector with an AI-driven score, multi-timeframe confirmations, robust volume filters, and a purpose-built Scalping Mode.**
Signals are generated **only on bar close** (no repaint), include structured alert payloads for webhooks, and come with optional ATR-based TP/SL visualization for study and validation.
---
## What it is (in one paragraph)
**Scalp Sense AI** combines classic market structure (DI/ADX, EMA, SMA, Keltner, ATR) with a continuous **AI Score** that fuses RSI normalization, EMA distance (in ATR units), and DI edge into a single, volatility-aware signal. It adaptively gates **trend** and **reversal** entries, applies **HTF confirmation** without lookahead, and enforces **guard rails** (e.g., strong-trend reversal blocking) unless a high-confidence AI override and volume confirmation are present. **Scalping Mode** compresses reaction times and adds micro price-action cues (wick rejections, micro-EMA crosses, small engulfing) to surface more—but disciplined—opportunities.
---
## Non-Repainting Design
* All signals, markers, state, and alerts are computed **after bar close** using `barstate.isconfirmed`.
* HTF data are requested with `lookahead_off`.
* No “future-peeking” constructs are used.
* Result: signals do **not** change after the candle closes.
---
## How the engine works (pipeline overview)
1. **Base metrics**
* **RSI**, **EMA**, **ATR** (+ ATR SMA for regime/volatility), **SMA long & short**, **Keltner** (EMA ± ATR×mult).
* **Manual DI/ADX** for fine control (DM+, DM−, true range smoothing).
2. **Volatility regime**
* Compares ATR to its SMA and scales thresholds by √(ATR/ATR\_SMA) → robust “high\_vol” gating.
3. **Volume & flow**
* **Volume Z-score**, **OBV slope**, and **MFI** (all computed manually) to confirm impulses and filter weak reversals.
4. **Higher-Timeframe confirmation (optional)**
* Imports HTF **PDI/MDI/ADX** and **SMA** (no lookahead) to require alignment when enabled.
5. **AI Score**
* Weighted fusion of **RSI (normalized around 0)**, **EMA distance (in ATR)**, and **DI edge**.
* Smoothed; then its **mean (μ)** and **volatility (σ)** are estimated to form **adaptive bands** (hi/lo), with optional **hysteresis**.
* **Debounce** (M in N bars) avoids flicker; **bias state** persists until truly invalidated.
6. **Signal logic**
* **Trend entries** require AI bias + trend confirmations (DI/ADX/SMA, HTF if enabled), volatility OK, and **anti-breakout** filter.
* **Reversal entries** come in **core**, **early**, and **scalp** flavors (progressively more frequent), guarded by strong-trend blocks that an **AI+volume+ADX-cooling override** can bypass.
7. **Scalping Mode**
* Adaptive parameter contraction (shorter lengths), gentler guards, micro-patterns (wick/engulf/micro-EMA cross), and reduced cooldown to increase high-quality opportunities.
8. **Cooldown & state**
* One signal per side after a configurable spacing in bars; internal “last direction” avoids clustering.
9. **Visualization & alerts**
* **Triangles** for trend, **circles** for reversals (offset by ATR to avoid overlap).
* **Single-line alert payload** (BUY/SELL, reason, AI, volZ, ADX) ready for webhooks.
---
## Signals & visualization
* **Trend Long/Short** → triangle markers (above/below) when:
* AI bias aligns with trend confirmations (DI edge, ADX above threshold, price vs long SMA, optional HTF alignment).
* Volatility regime agrees; **anti-breakout** prevents entries exactly at lookback highs/lows.
* **Reversal Long/Short** → circular markers when:
* **Core**: AI near “loose” band, OBV/MFI/volZ supportive, ADX cooling, DI spread relaxed, PA confirms (crosses/div).
* **Early**: anticipatory patterns (Keltner exhaustion, simple RSI “quasi-divergence”).
* **Scalp**: micro-EMA cross, wick rejection, mini-engulfing, with relaxed guards but AI/volume still in the loop.
* **Markers appear only on the bar that actually emitted the signal** (no repaint); offsets use ATR so shapes don’t overlap.
---
## Alerts (ready for webhooks)
Enable “**Any alert() function call**” and you’ll receive compact, single-line payloads once per bar:
```
action=BUY;reason=reversal-early;ai=0.1375;volZ=0.82;adx=27.5
action=SELL;reason=trend;ai=-0.2210;volZ=0.43;adx=31.9
```
* `action`: BUY / SELL
* `reason`: `trend` | `reversal-core` | `reversal-early` | `reversal-scalp`
* `ai`: current smoothed AI Score at signal bar
* `volZ`: volume Z-score
* `adx`: current ADX
---
## Inputs (exhaustive)
### 1) Core Inputs
* **RSI Length (Base)** (`rsi_length_base`, int)
Base RSI lookback. Shorter = more reactive; longer = smoother.
* **RSI Overbought Threshold** (`rsi_overbought`, int)
Informational for context; RSI is used normalized in the AI fusion.
* **RSI Oversold Threshold** (`rsi_oversold`, int)
Informational; complements visual context.
* **EMA Length (Base)** (`ema_length_base`, int)
Primary adaptive mean; also used for Keltner mid and distance metric.
* **ATR Length (Base)** (`atr_length_base`, int)
Volatility unit for Keltner, SL/TP (debug), and regime detection.
* **ATR SMA Length** (`atr_sma_len`, int)
Smooth baseline for ATR regime; supports “high\_vol” logic.
* **ATR Multiplier Base** (`atr_mult_base`, float)
Scales volatility gating (sqrt-scaled); higher = tighter high-vol requirement.
* **Disable Volatility Filter** (`disable_volatility_check`, bool)
Bypass volatility gating if true.
* **Price Change Period (bars)** (`price_change_period_base`, int)
Simple momentum check (+/−% over N bars) used in trend validation.
* **Base Cooldown Bars Between Signals** (`signal_cooldown_base`, int ≥ 0)
Minimum bars to wait between signals (per side).
* **Trend Confirmation Bars** (`trend_confirm_bars`, int ≥ 1)
Require persistence above/below long SMA for this many bars.
* **Use Higher Timeframe Confirmation** (`use_higher_tf`, bool)
Turn on/off HTF alignment (no repaint).
* **Higher Timeframe for Confirmation** (`higher_tf`, timeframe)
E.g., “60” to confirm M15 with H1; used for HTF PDI/MDI/ADX and SMA.
* **TP as ATR Multiple** (`tp_atr_mult`, float)
For **visual debug** only (drawn after entries); not an order manager.
* **SL as ATR Multiple** (`sl_atr_mult`, float)
For visual debug only.
* **Enable Scalping Mode** (`scalping_mode`, bool)
Compresses lengths/thresholds, unlocks micro-PA modules, reduces cooldown.
* **Show Debug Lines** (`show_debug`, bool)
Plots AI bands, DI/ADX, EMA/SMA, Keltner, vol metrics, and TP/SL (debug).
### 2) AI Score & Thresholds
* **AI Score Smooth Len** (`ai_len`, int)
EMA smoothing over the raw fusion.
* **AI Volatility Window** (`ai_sigma_len`, int)
Window to estimate AI mean (μ) and standard deviation (σ).
* **K High (sigma)** (`ai_k_hi`, float)
Upper band width (σ multiplier) for strong threshold.
* **K Low (sigma)** (`ai_k_lo`, float)
Lower band width (σ multiplier) for loose threshold.
* **Debounce Window (bars)** (`ai_debounce_m`, int ≥ 1)
Rolling window length used by the confirm counter.
* **Min Bars>Thr in Window** (`ai_debounce_n`, int ≥ 1)
Minimum confirmations inside the debounce window to validate a state.
* **Use Hysteresis Thresholds** (`ai_hysteresis`, bool)
Requires crossing back past a looser band to exit bias → fewer whipsaws.
* **Weight DI Edge (0–1)** (`ai_weight_di`, float)
Importance of DI edge within the fusion.
* **Weight EMA Dist (0–1)** (`ai_weight_ema`, float)
Importance of EMA distance (in ATR units).
* **Weight RSI Norm (0–1)** (`ai_weight_rsi`, float)
Importance of normalized RSI.
* **Sensitivity (0–1)** (`sensitivity`, float)
Contracts/expands bands (higher = more sensitive).
### 3) Volume Filters
* **Volume MA Length** (`vol_ma_len`, int)
Baseline for volume Z-score.
* **Volume Z-Score Window** (`vol_z_len`, int)
Std-dev window for Z-score; larger = fewer volume “spikes”.
* **Reversal: Min Volume Z for confirm** (`vol_rev_min_z`, float)
Minimum Z required to validate reversals (adaptively relaxed in scalping).
* **OBV Slope Lookback** (`obv_slope_len`, int)
Rising/falling OBV over this window supports bull/bear confirmations.
* **MFI Length** (`mfi_len`, int)
Money Flow Index lookback (manual calculation).
### 4) Filters (Breakout / ADX / Reversal)
* **Enable Breakout Filter** (`enable_breakout_fil`, bool)
Avoid trend entries at lookback highs/lows.
* **Breakout Lookback Bars** (`breakout_lookback`, int ≥ 1)
Window for the anti-breakout guard.
* **Base ADX Length** (`adx_length_base`, int)
Lookback for DI/ADX smoothing (also adapted in Scalping Mode).
* **Base ADX Threshold** (`adx_threshold_base`, float)
Minimum ADX to validate trend context (scaled in Scalping Mode).
* **Enable Reversal Filter** (`enable_rev_filter`, bool)
Master switch for reversal logic.
* **Max ADX for Reversal** (`rev_adx_max`, float)
Hard cap: above this ADX, reversals are blocked (unless overridden by AI if allowed in Guards).
### 5) Reversal Guard (regime protection & overrides)
* **Strong Trend: ADX add-above Thr** (`guard_adx_add`, float)
Extra ADX above `adx_threshold` to mark “strong” trend.
* **Strong Trend: min DI spread** (`guard_spread_min`, float)
Minimum DI separation to consider a trend “dominant”.
* **Require ADX drop from window max (%)** (`guard_adx_drop_min_pct`, float 0–1)
ADX must drop at least this fraction from its window maximum to consider “cooling”.
* **Regime Window (bars)** (`guard_regime_len`, int ≥ 10)
Window over which ADX max is measured for the “cooling” check.
* **EMA Slope Lookback** (`guard_slope_len`, int ≥ 2)
EMA slope horizon used alongside Keltner for strong-trend identification.
* **Keltner Mult (ATR)** (`guard_kc_mult`, float)
Keltner width for strong trend bands and exhaustion checks.
* **HTF Reversal Block Mode** (`htf_block_mode`, string: `Off` | `On` | `AI-controlled`)
* `Off`: never block by HTF.
* `On`: block reversals whenever HTF is strong.
* `AI-controlled`: block **unless** AI+volume+ADX-cooling override criteria are met.
* **AI-controlled: allow AI override** (`ai_htf_override`, bool)
Enables the override mechanism in `AI-controlled` mode.
* **AI override multiplier (vs band\_hi)** (`ai_override_mult`, float)
Strength needed beyond the high band to count as “strong AI”.
* **AI override: min bars beyond strong thr** (`ai_override_min_bars`, int ≥ 1)
Debounce on the override itself.
### 6) Markers
* **Reversal Circle ATR Offset** (`rev_marker_offset_atr`, float ≥ 0)
Vertical offset for reversal circles; trend triangles use a separate (internal) offset.
### 7) Scalping Mode Tuning
* **Reversal aggressiveness (0–1)** (`scalp_rev_aggr`, float)
Higher = looser guards and stronger AI sensitivity.
* **Wick: body multiple (bull/bear)** (`scalp_wick_body_mult`, float)
Wick must be at least this multiple of body to count as rejection.
* **Wick: ATR multiple (min)** (`scalp_wick_atr_mult`, float)
Minimal wick length in ATR units.
* **Micro EMA factor (vs EMA base)** (`scalp_ema_fast_factor`, float 0.2–0.9)
Fast EMA length = base EMA × factor (rounded/int).
* **Relax breakout filter in scalping** (`scalp_breakout_relax`, bool)
Lets more trend entries through in scalping context.
### 8) ICT-style SMA (bases)
* **ICT SMA Long Length (Base)** (`sma_long_len_base`, int)
Long-term baseline for regime/trend.
* **ICT SMA Short1 Length (Base)** (`sma_short1_len_base`, int)
Short baseline for price-action crosses.
* **ICT SMA Short2 Length (Base)** (`sma_short2_len_base`, int)
Companion short baseline used in PA cross checks.
> **Adaptive “effective” values:** When **Scalping Mode** is ON, the script internally shortens multiple lengths (RSI/EMA/ATR/ADX/μσ windows, SMAs) and gently relaxes guards (ADX drop %, DI spread, volume Z, override thresholds), reduces cooldown/confirm bars, and optionally relaxes the breakout filter—so you get **more frequent but still curated** signals.
---
## Plots & debug (optional)
* DI+/DI−, ADX (curr + HTF), EMA, long SMA, Keltner up/down (when strong), AI Score, AI mean, AI bands (hi/lo; low plots only when hysteresis is on), Volume MA and Z-score, and ATR-based TP/SL guide (after entries).
* These are **study aids**; the indicator does not manage trades.
---
## Recommended use
* **Timeframes**:
* Scalping Mode: M1–M15.
* Standard Mode: M15–H1 (or higher).
* **Markets**: Designed for liquid FX, indices, metals, and large-cap crypto.
* **Chart type**: Standard candles recommended (Heikin-Ashi alters inputs and hence signals).
* **Alerts**: Use “Any alert() function call”. Parse the key/value payloads server-side.
---
## Good to know
* **Why some alerts don’t draw shapes retroactively**: markers are drawn **only on** the bar that emitted the signal (no repaint by design).
* **Why a reversal didn’t fire**: strong-trend guards + HTF block may have been active; check ADX, DI spread, Keltner position, EMA slope, and whether AI override criteria were met.
* **Too many / too few signals**: tune **Scalping Mode**, `signal_cooldown_base`, AI bands (`ai_k_hi/lo`, `sensitivity`), volume Z (`vol_rev_min_z`), and guards (`rev_adx_max`, `guard_*`).
---
## Disclaimer
This is an **indicator**, not a strategy or an execution system. It does not place, modify, or manage orders. Markets carry risk—validate on historical data and demo before any live decisions. No performance claims are made.
---
### Version
**Scalp Sense AI v11.5** — Adaptive AI bands with hysteresis/debounce, HTF no-lookahead confirmations, guarded reversal logic with AI override, full volume suite (Z, OBV slope, MFI), anti-breakout filter, and a dedicated Scalping Mode with micro-PA cues.