Hardwaybets Strat Market Checklist Trading## **Hardwaybets TheStrat Market Checklist Engine**
**A Checklist-Driven TheStrat Trading**
---
### **Overview**
This script is an **informational market context and permission framework** designed to help users **organize structural and liquidity information** in a clear, checklist-based format.
It evaluates **price context only** and displays the results in a table.
It does **not** generate trade signals or trading instructions.
---
### **What This Script Does**
The indicator evaluates and displays:
* Nearest prior **Area of Interest (AOI)**
(Previous Day High/Low or Previous Week High/Low)
* Higher-timeframe structural bias (Daily & Weekly)
* Proximity to liquidity
* Liquidity behavior (acceptance vs rejection)
* **Strat pattern classification only** (12 canonical patterns)
* A final **permission state** based on the above conditions
All information is presented as **contextual reference data**, not execution guidance.
---
### **What This Script Does NOT Do**
* ❌ No buy or sell signals
* ❌ No arrows, markers, or execution prompts
* ❌ No entries, exits, stops, or targets
* ❌ No performance metrics or profitability claims
* ❌ No strategy or backtesting logic
The word **“TRADE”** in the dashboard refers to **permission status only**, not a recommendation to trade.
---
### **Dashboard Modes**
* **Full Mode**: displays AOI price and distance (points & ticks)
* **Compact Mode**: minimal checklist view for reduced screen usage
Both modes are **informational only**.
---
### **Pattern Classification**
The script identifies and labels Strat candle pattern **types only**, including:
* Reversal patterns
* Continuation patterns
* Compression patterns
* Expansion patterns
Pattern labels are **descriptive classifications**, not signals or instructions.
---
### **Intended Use**
This script is intended to be used as a **contextual reference tool** alongside a user’s own analysis, rules, or education.
It may be useful for:
* Market structure study
* Liquidity behavior observation
* Pattern classification review
* Educational purposes
---
### **Technical Notes**
* Pine Script® v6
* Uses completed candles only
* No repainting logic
* No future data access
* Table-based UI only
---
### **Disclaimer**
This indicator is provided **for educational and informational purposes only**.
The author does not provide financial advice, trading recommendations, or execution guidance.
All trading decisions remain the sole responsibility of the user.
---
### **Conceptual Attribution**
This script is inspired by publicly available market structure concepts commonly referred to as “The Strat” methodology.
No proprietary or paid content is included.
---
### **Feedback**
Constructive feedback and suggestions are welcome.
Please note that this script is intentionally **non-signaling by design**.
Recherche dans les scripts pour "backtest"

Gann Octave 8 Ver.2.0Gann Octave 8 Ver.2.0 - Complete Trading Guide
Overview
This indicator combines W.D. Gann's time-tested principles of market geometry with modern technical analysis. It identifies key market structures and projects precise support/resistance levels along with angular momentum lines to help traders identify high-probability trading opportunities.
________________________________________
Core Concepts
1. Gann's Octave Division (The Rule of 8)
W.D. Gann discovered that markets move in harmonic divisions based on the number 8. This indicator divides any swing movement into 8 equal parts (octaves):
• 0% - Swing extreme (High for bearish, Low for bullish)
• 12.5% - First octave
• 25% - Quarter level
• 37.5% - Three-eighths level
• 50% - Midpoint (most critical level)
• 62.5% - Five-eighths level
• 75% - Three-quarter level
• 87.5% - Seventh octave
• 100% - Swing extreme (opposite end)
Why 8? Gann believed natural market cycles follow mathematical harmonics. The octave division provides precise entry and exit points that frequently act as support/resistance zones.
2. Gann Angles (Price-Time Relationship)
Gann angles represent the relationship between price movement and time. Each angle shows different momentum levels:
• 1x1 (Black) - 45° angle, perfect balance between price and time. Most important Gann angle. Represents the natural trend line.
• 2x1 (Red) - Steeper angle, 2 units of price per 1 unit of time. Shows strong momentum.
• 1x2 (Red) - Flatter angle, 1 unit of price per 2 units of time. Shows weak momentum.
• 4x1 & 1x4 (Blue) - Even more extreme angles indicating very strong or very weak trends.
• 8x1 & 1x8 (Orange) - Most extreme angles, parabolic moves or complete consolidation.
Key Principle: When price is above the 1x1 angle = bullish. Below 1x1 = bearish. When price crosses from one angle to another, it signals a change in momentum.
________________________________________
How the Indicator Works
Structure Detection
The indicator automatically identifies market swings using pivot points:
1. Bullish Structure (Green): Detected when price makes a higher high
o Octave levels calculated from swing low (0%) to swing high (100%)
o Gann angles project upward from the swing low
2. Bearish Structure (Red): Detected when price makes a lower low
o Octave levels calculated from swing high (0%) to swing low (100%)
o Gann angles project downward from the swing high
Dynamic Updates
• Swing Tracker ON: Levels update continuously as the swing evolves
• Swing Tracker OFF: Levels lock at the initial swing detection (cleaner charts)
Historical Structures
The indicator maintains previous swing structures based on "Number of Swings to Show":
• Set to 1: Only current structure (cleanest)
• Set to 2-3: Current + recent history (recommended for context)
• Set to 4+: Multiple historical structures (may overlap but shows pattern)
________________________________________
Trading Strategy
Entry Signals
BUY SIGNALS (Green Triangle Up ▲)
Signal 1: Bounce from Support Levels
• Price drops to 0%, 50%, or 100% level and reverses
• Best when combined with bullish candlestick pattern (hammer, engulfing)
• Entry: On signal confirmation
• Stop Loss: Below the support level (0.5-1% below)
• Target: Next octave level up (12.5%, 25%, 50%)
Signal 2: Breakout Above Resistance
• Price breaks above 50% or 100% level with momentum
• Confirms trend continuation or reversal
• Entry: On close above the level
• Stop Loss: Below the breakout level
• Target: Previous swing high or next major level
Signal 3: Gann Angle Support
• Price bounces off 1x1 angle (black line)
• Indicates trend is intact
• Entry: When price respects the angle
• Stop Loss: Below the 1x1 angle
• Target: Next resistance level
SELL SIGNALS (Red Triangle Down ▼)
Signal 1: Rejection from Resistance Levels
• Price rallies to 0%, 50%, or 100% level and reverses
• Best when combined with bearish candlestick pattern (shooting star, bearish engulfing)
• Entry: On signal confirmation
• Stop Loss: Above the resistance level (0.5-1% above)
• Target: Next octave level down (87.5%, 75%, 50%)
Signal 2: Breakdown Below Support
• Price breaks below 50% or 0% level with momentum
• Confirms trend continuation or reversal
• Entry: On close below the level
• Stop Loss: Above the breakdown level
• Target: Previous swing low or next major level
Signal 3: Gann Angle Resistance
• Price fails at 1x1 angle (black line)
• Indicates trend weakness
• Entry: When price rejects the angle
• Stop Loss: Above the 1x1 angle
• Target: Next support level
________________________________________
Advanced Trading Techniques
1. The 50% Rule (Most Powerful)
The 50% octave level is the most critical in Gann theory:
• In Uptrend: Price should not break below 50% retracement. If it holds = trend intact, go long.
• In Downtrend: Price should not break above 50% retracement. If it holds = trend intact, go short.
• Reversal: Breaking and closing beyond 50% often signals trend reversal.
2. Gann Angle Confluence
When multiple Gann angles converge with octave levels = HIGH probability zone:
• Look for price to bounce or reverse at these zones
• Example: 1x2 angle meets 50% level = strong support/resistance
• These zones often become pivot points
3. Multiple Timeframe Analysis
• Use higher timeframe (daily) for major structure
• Use lower timeframe (5min, 15min) for precise entries
• Take trades when both timeframes align
4. Swing Failure Pattern
• Price breaks a key level (e.g., 50%) but quickly reverses back
• This "false breakout" often leads to strong move in opposite direction
• Wait for signal in the reversal direction
________________________________________
Settings Optimization
For Day Trading (Scalping)
• Structure Period: 0-2 (22 bars or less)
• Number of Swings: 1 (only current structure)
• Signal Sensitivity: High
• Swing Tracker: OFF (cleaner)
For Swing Trading
• Structure Period: 4-5 (44-88 bars)
• Number of Swings: 2-3
• Signal Sensitivity: Medium
• Swing Tracker: ON or OFF (preference)
For Position Trading
• Structure Period: 6-8 (176+ bars)
• Number of Swings: 3-5
• Signal Sensitivity: Low
• Swing Tracker: ON
________________________________________
Common Patterns to Watch
Bullish Reversal Setup
1. Price in bearish structure (red levels)
2. Price drops to 100% level (swing low)
3. Buy signal appears (green triangle)
4. Price breaks back above 50% level
5. Action: Go long with stop below 100%
Bearish Reversal Setup
1. Price in bullish structure (green levels)
2. Price rises to 100% level (swing high)
3. Sell signal appears (red triangle)
4. Price breaks back below 50% level
5. Action: Go short with stop above 100%
Trend Continuation
1. Price respects 1x1 Gann angle
2. Small pullback to 25% or 37.5% level
3. Buy/sell signal appears
4. Action: Enter in trend direction
________________________________________
________________________________________
Signal Sensitivity Guide
• Low: Conservative, only major breakouts (3-5 signals per day)
• Medium: Balanced, includes approaches (5-10 signals per day)
• High: Aggressive, includes bounces (10-20 signals per day)
Choose based on your trading style and risk tolerance
________________________________________
Final Words
This indicator is a powerful tool, but remember:
"The market is never wrong. Opinions are." - W.D. Gann
• No indicator is 100% accurate
• Always combine with price action and volume
• Backtest on your instrument and timeframe
• Keep learning and adapting your strategy
• Discipline and risk management are more important than the perfect setup
Happy Trading! 📈

Monday Range - User Defined LookbackEnglish Description
Monday Range Expansion & Multi-Week Projections
This indicator identifies the Monday Range (the price action from Monday's open at 00:00) and projects symmetric expansion levels across the entire trading week. It is designed for traders who use the weekly open and Monday's volatility as a benchmark for the week's price action.
Key Features:
Exact Monday 00:00 Start: Using advanced logic, the indicator pins the starting point precisely to the weekly open (Monday 00:00), ensuring no lag or offset regardless of your timeframe.
Symmetric Expansion Levels: It calculates the Monday High-Low range and projects a +100%, +50%, -50%, and -100% expansion, providing clear support and resistance targets.
User-Defined Lookback: You can choose exactly how many past weeks to display on your chart, keeping your workspace clean and focused.
Force Overlay Technology: All lines and labels use force_overlay, ensuring they always stay on the top layer, above candles and other indicators.
Weekly Freeze: Historical weeks stay "frozen" at their Friday closing points, allowing for clear backtesting of previous weekly levels.

Trinity Swing Trading Buy and SellThis is a simple little Heiken Ashi MA + ADX & MACD trend-following trading system designed to capture medium- to longer-term moves while filtering out noise and weak trends. It combines modified Heiken Ashi candles (for smoother trend detection) with a moving average alignment, plus optional confirmation from ADX (trend strength) and MACD (momentum).
In practice, the indicator works well on higher timeframes (e.g., 1H, 4H, daily) where trends are more sustained. It performs best in trending markets and naturally avoids choppy/range-bound conditions thanks to the ADX filter (requiring ADX > 20 by default). All key components are fully customizable, so you can disable filters or adjust parameters to suit different instruments (stocks, forex, crypto, futures).
Default settings are:
16 HMA
8,17,9 MACD
15,20 ADX
Recommend to add an additional longer term EMA like 200 for long term trend confirmation.
Adjust inputs in the settings panel as needed:
Toggle MA, ADX, or MACD filters on/off.
Change MA type/length, MACD parameters, ADX threshold
- Use the visual blue diamonds (below bars) for long entries and purple diamonds (above bars) for short entries as confirmation of signals.
- Set alerts on the "Buy Alert" and "Sell Alert" conditions if you want real-time notifications.
This setup gives you a complete, rule-based system that avoids emotional trading and repetitive entries, making it suitable for both backtesting and live trading with proper risk management.

Alpha Options System# Apex Options Sniper - Advanced Multi-Signal Day Trading System
## 🎯 Overview
**Apex Options Sniper** is a professional-grade, multi-signal trading indicator specifically engineered for high-probability day trading of weekly options. This comprehensive system combines 10+ technical indicators into a sophisticated scoring algorithm that identifies optimal entry points with institutional-level precision.
Perfect for traders of SPY, QQQ, and high-volume stocks, this indicator eliminates guesswork by providing clear BUY CALLS and BUY PUTS signals based on multiple technical confluences.
---
## 🚀 Key Features
### **Multi-Signal Confluence Engine**
- **10+ Technical Indicators** working in harmony
- **Weighted Scoring System** (0-30+ points) for signal strength
- **Real-time Signal Classification**: Strong vs Moderate signals
- **False Signal Reduction** through multi-confirmation requirements
### **Advanced Momentum Analysis**
- ✅ RSI with Divergence Detection (bullish & bearish)
- ✅ Stochastic Oscillator (oversold/overbought + crossovers)
- ✅ MACD with crossover and momentum confirmation
- ✅ Automatic divergence spotting for reversal trades
### **Sophisticated Trend Detection**
- ✅ Triple EMA System (9/21/50) with alignment scoring
- ✅ SuperTrend Indicator with trend flip alerts
- ✅ VWAP for institutional price levels
- ✅ Multi-timeframe trend confirmation
### **Professional Volume Analysis**
- ✅ Volume Spike Detection (vs 20-period average)
- ✅ OBV (On-Balance Volume) with divergence detection
- ✅ Order Flow Analysis (buy vs sell pressure)
- ✅ Relative volume ratio display
### **Advanced Pattern Recognition**
- ✅ Bollinger Band Squeeze detection (volatility expansion)
- ✅ BB breakout signals (major move initiation)
- ✅ Automatic Support & Resistance levels (pivot-based)
- ✅ Price reaction scoring at key levels
### **Built-in Risk Management**
- ✅ ATR-based Stop Loss calculations
- ✅ Customizable Risk:Reward ratios
- ✅ Position sizing recommendations
- ✅ Real-time profit target calculations
### **Comprehensive Visual Dashboard**
- ✅ Live scoring breakdown for all indicators
- ✅ Individual signal strength display
- ✅ Bull vs Bear score comparison
- ✅ Color-coded signal status
- ✅ Risk management metrics
---
## 📊 How It Works
### **Scoring System**
The indicator assigns points based on technical conditions:
| **Category** | **Max Points** | **Conditions** |
|-------------|---------------|----------------|
| Momentum (RSI/Stoch) | 8 | Oversold/overbought + divergences |
| MACD | 4 | Crossovers + momentum direction |
| Trend (EMAs) | 6 | EMA alignment + SuperTrend |
| Volume | 4 | Spikes + OBV divergences |
| Order Flow | 2 | Buy/sell pressure imbalance |
| Bollinger Bands | 2 | Squeeze + breakouts |
| Support/Resistance | 2 | Price at key levels |
| VWAP | 1 | Above/below institutional level |
### **Signal Thresholds**
- **🚀 STRONG CALLS**: Bull score ≥6, Net score ≥4
- **📈 CALLS**: Bull score ≥4, Net score ≥2
- **🔥 STRONG PUTS**: Bear score ≥6, Net score ≤-4
- **📉 PUTS**: Bear score ≥4, Net score ≤-2
### **Multi-Timeframe Filter**
Optional higher timeframe confirmation reduces false signals by ensuring the broader trend supports your trade direction.
---
## 🎮 How to Use
### **Installation**
1. Open TradingView Pine Editor
2. Paste the complete indicator code
3. Click "Add to Chart"
4. Customize settings to your preference
### **Recommended Settings**
**For SPY/QQQ Day Trading:**
- Timeframe: 1-minute or 5-minute
- Strong Signal Threshold: 6
- Moderate Signal Threshold: 4
- Multi-timeframe Confluence: ON
**For Individual Stocks:**
- Timeframe: 5-minute or 15-minute
- Increase SuperTrend multiplier to 3.5-4.0
- Enable all advanced features
**For Scalping:**
- Timeframe: 1-minute
- Use STRONG signals only (6+)
- Tight stop loss (1.0-1.5 ATR multiplier)
### **Best Trading Times**
- **9:30-11:00 AM EST** - Highest volume, strongest signals
- **2:00-4:00 PM EST** - Afternoon momentum plays
- Avoid 11:30 AM-1:30 PM EST (lunch chop)
---
## 📈 Signal Interpretation
### **What You'll See on Chart:**
**Visual Signals:**
- 🟢 **Green Triangle (CALLS)**: Bullish entry point
- 🟢 **Large Green Triangle (STRONG CALLS)**: High-confidence bullish entry
- 🔴 **Red Triangle (PUTS)**: Bearish entry point
- 🔴 **Large Red Triangle (STRONG PUTS)**: High-confidence bearish entry
- 💎 **Small Diamonds**: RSI/OBV divergences (reversal warning)
**Dashboard Information:**
- Individual indicator values and signals
- Real-time score breakdown
- Bull/Bear score totals
- ATR stop loss levels
### **Entry Rules:**
✅ **High Probability Trades (Take These):**
- Strong signal (6+ score)
- 3+ indicators confirming
- Volume spike present
- SuperTrend aligned
- Higher timeframe confirms
⚠️ **Moderate Trades (Smaller Position):**
- Moderate signal (4-5 score)
- 2+ indicators confirming
- Normal volume
- Mixed trend signals
❌ **Avoid These:**
- Conflicting signals (Bull score ≈ Bear score)
- Low volume
- During major news events
- Bollinger squeeze without breakout direction
---
## 🛡️ Risk Management Guide
### **Position Sizing:**
- **Strong Signals (6+)**: 3-5% of portfolio
- **Moderate Signals (4-5)**: 2-3% of portfolio
- **Low Conviction**: 1-2% or skip
### **Stop Loss Strategy:**
- Use ATR-based stops (displayed in dashboard)
- Default: 1.5x ATR from entry
- Weekly options: 30-50% premium loss maximum
- Never hold through stop loss hoping for recovery
### **Profit Targets:**
- **Quick Scalps**: 25-50% gain (15-30 min)
- **Day Trades**: 50-100% gain (same day exit)
- **Swing**: 100-200% gain (1-2 days max for weeklies)
- **Take partial profits** at first target, let rest run
### **Time Decay Management (Weekly Options):**
- Monday-Wednesday: Hold overnight acceptable on strong signals
- Thursday: Close by EOD unless very strong conviction
- Friday: Avoid holding overnight, theta decay accelerates
---
## 🔔 Alert Configuration
### **Recommended Alerts:**
**Essential Alerts:**
1. 🚀 Strong Buy Calls
2. 🔥 Strong Buy Puts
**Advanced Alerts:**
3. 💎 RSI Bullish Divergence
4. ⚠️ RSI Bearish Divergence
5. 🔶 Bollinger Band Squeeze
6. ✅ SuperTrend Bull Flip
7. ❌ SuperTrend Bear Flip
**Alert Setup:**
- Set frequency: "Once Per Bar Close"
- Enable for all devices
- Use webhook for automation (optional)
---
## 💡 Pro Trading Tips
### **Maximize Win Rate:**
1. **Wait for confluence** - Best trades have 3+ indicators aligned
2. **Respect the dashboard** - Check WHY it's signaling (which indicators)
3. **Volume is king** - Signals with volume spikes are significantly more reliable
4. **Use BB Squeeze** - When squeeze + signal = explosive directional move
5. **SuperTrend flips** - Major trend change confirmations, very powerful
6. **Watch for divergences** - Diamond markers = hidden reversal opportunities
### **Common Mistakes to Avoid:**
❌ Trading every signal (be selective)
❌ Ignoring volume (volume confirms everything)
❌ Fighting the higher timeframe trend
❌ Oversizing positions on moderate signals
❌ Holding weekly options too long (theta decay)
❌ Trading during lunch hour (11:30-1:30 EST)
### **Advanced Techniques:**
- **Divergence + Support/Resistance** = Highest probability reversals
- **BB Squeeze + EMA alignment** = Explosive trend continuations
- **SuperTrend flip + Volume spike** = Major trend change entries
- **Multiple timeframe analysis** - Check 5m signal on 1m chart for precision entries
---
## 📊 Indicator Components Explained
### **RSI (Relative Strength Index)**
- Measures momentum and overbought/oversold conditions
- Divergences signal potential reversals before they happen
- Score: 2-3 points for extremes and divergences
### **Stochastic Oscillator**
- Confirms momentum extremes
- Crossovers provide entry timing
- Score: 1-2 points
### **MACD (Moving Average Convergence Divergence)**
- Trend following momentum indicator
- Crossovers signal momentum shifts
- Score: 1-3 points based on signal strength
### **EMA System (9/21/50)**
- Dynamic support and resistance
- Alignment shows trend strength
- Price position relative to EMAs scores 1-2 points
### **SuperTrend**
- Volatility-based trend indicator
- Reduces whipsaws in choppy conditions
- Trend flips are major signals (2 points)
### **Bollinger Bands**
- Volatility measurement
- Squeeze = calm before the storm
- Breakouts = directional move initiation (2 points)
### **Volume Analysis**
- Confirms price movement legitimacy
- Spikes validate signals (2 points)
- OBV divergences predict reversals (2 points)
### **Order Flow**
- Buy vs sell pressure measurement
- Institutional footprint detection
- Score: 2 points for strong imbalances
---
## 🎓 Learning Path
### **Beginner (Week 1-2):**
- Use STRONG signals only
- Focus on high-volume stocks (SPY/QQQ)
- Trade only first hour of market
- Use paper trading first
### **Intermediate (Week 3-4):**
- Add moderate signals to your arsenal
- Learn to read the dashboard
- Understand why each signal triggers
- Start combining with support/resistance
### **Advanced (Month 2+):**
- Use divergence signals
- Trade BB squeeze breakouts
- Optimize settings for your style
- Develop your own confluence rules
---
## ⚙️ Customization Guide
### **Adjustable Parameters:**
**Momentum Settings:**
- RSI Length (default: 14)
- RSI Oversold/Overbought levels (30/70)
- Stochastic Length (14)
**Trend Settings:**
- EMA periods (9/21/50)
- SuperTrend ATR Length (10)
- SuperTrend Multiplier (3.0)
**Volume Settings:**
- Volume MA Length (20)
- Volume Spike Threshold (1.5x)
**Advanced Settings:**
- Bollinger Band Length (20)
- BB Standard Deviation (2.0)
- Pivot Lookback (10)
**Signal Thresholds:**
- Strong Signal Score (default: 6)
- Moderate Signal Score (default: 4)
**Risk Management:**
- ATR Length (14)
- Stop Loss Multiplier (1.5)
- Risk:Reward Ratio (2.0)
---
## 📈 Performance Optimization
### **For Volatile Markets (VIX > 25):**
- Increase SuperTrend multiplier to 4.0
- Raise signal thresholds (+1 point)
- Tighten stop losses (1.0-1.2 ATR)
### **For Ranging Markets:**
- Focus on RSI extremes and divergences
- Use BB squeeze signals
- Ignore moderate signals
- Wait for support/resistance confirmation
### **For Trending Markets:**
- Follow SuperTrend direction religiously
- Use EMA alignment signals
- Allow wider stops (2.0 ATR)
- Take partial profits, let winners run
---
## 🔍 Troubleshooting
**Too Many Signals:**
- Increase signal thresholds to 7/5
- Enable multi-timeframe filter
- Trade only STRONG signals
**Missing Signals:**
- Decrease thresholds to 5/3
- Disable multi-timeframe filter
- Check that all features are enabled
**Whipsaw in Choppy Markets:**
- Increase SuperTrend multiplier
- Require volume spike confirmation
- Avoid trading 11:30 AM-1:30 PM EST
---
## 🏆 Best Practices
✅ **Always check:**
1. Dashboard shows why signal triggered
2. Volume confirms the move
3. Not during news events
4. Adequate time until expiration
✅ **Risk Management:**
1. Never risk more than 2% per trade
2. Use stops religiously
3. Take profits at targets
4. Don't revenge trade
✅ **Journal Your Trades:**
1. Entry price and signal strength
2. Which indicators triggered
3. Exit price and profit/loss
4. What worked and what didn't
---
## 📞 Support & Updates
This indicator is designed to evolve with market conditions. Recommended to:
- Review settings monthly
- Backtest on your favorite instruments
- Adjust thresholds based on your risk tolerance
- Keep a trading journal to track performance
---
## ⚠️ Disclaimer
This indicator is a tool for technical analysis and should not be used as the sole basis for trading decisions. Options trading involves substantial risk and is not suitable for all investors. Past performance does not guarantee future results. Always:
- Do your own research and due diligence
- Never invest more than you can afford to lose
- Consider consulting with a financial advisor
- Practice with paper trading before using real money
- Understand options Greeks (Delta, Theta, Gamma, Vega)
- Be aware of earnings dates and major news events
**No indicator is 100% accurate. Use proper risk management and trade responsibly.**
---
## 📊 Version History
**v1.0 - Initial Release**
- Multi-signal confluence system
- 10+ technical indicators
- Advanced dashboard
- ATR-based risk management
- Comprehensive alert system
---
## 🎯 Final Thoughts
**Apex Options Sniper** transforms complex technical analysis into clear, actionable signals. By combining multiple proven indicators with sophisticated scoring logic, it helps traders identify high-probability setups while managing risk effectively.
**Success Keys:**
- Quality over quantity (be selective)
- Risk management is everything
- Volume confirms the signal
- Confluence increases probability
- Discipline beats emotion
**Trade smart. Trade with confidence. Trade with Apex Options Sniper.**
---
*For questions, suggestions, or to share your success stories, please comment below or send a message.*
**Happy Trading! 🚀📈**

REM Algo - Earnings AlertsNot everyone wants to hold positions through earnings announcements — and if you’re evaluating a strategy, earnings-related gaps can distort performance metrics and make results harder to interpret.
This script helps you manage earnings risk by triggering alerts during an Earnings Blackout window. You can:
get an alert to close positions the day before earnings, and/or
receive a reminder not to open new positions on blackout days prior to the earnings announcement.
Add alerts to the stocks you trade. When a blackout day occurs, the script triggers at the hour and minute you choose in the settings. The Earnings Blackout period covers the day before and the day of the earnings announcement, adjusted for weekends and market holidays.
Use it as a standalone risk-control tool — or alongside your existing strategy — so earnings gaps don’t interfere with your trading rules or your backtest results.

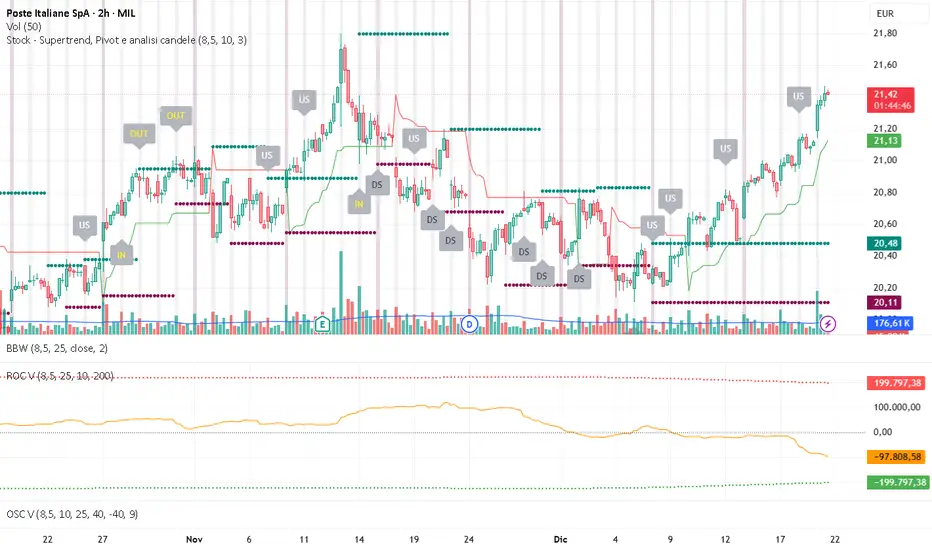
Volume ROC (smoothed)Description
The Volume ROC (Rate of Change) indicator is designed to measure the momentum of trading volume over a user-defined period, adjusted for the trading session length of the symbol (e.g., 8.5 hours for the FTSEMIB index). This makes it particularly useful for intraday charts where standard daily calculations might not align with actual trading days.
By focusing on volume changes rather than price, it helps identify potential shifts in market participation, such as accumulation, distribution, or unusual activity that could precede price movements.
How It Works:
Session Adjustment:
The indicator calculates the number of candles per trading day based on the input session duration (in hours) and the chart's timeframe. This ensures that the ROC and other calculations are based on "trading days" rather than calendar days, making it adaptable to markets with non-standard hours like European indices (e.g., FTSEMIB).
Daily Data Fetch:
It retrieves daily high, low, close, and volume data using "request.security" to ensure consistency across timeframes.
ROC Calculation:
The Rate of Change (ROC) is computed on volume using "ta.change" over the specified length (in days), multiplied by the candles-per-day factor for timeframe independence. By chosing the subtraction method instead of the division method we avoid distortions of the ROC below the zero line (method ok for timespans inferior to two years).
Smoothing with SMA:
A Simple Moving Average (SMA) is applied to the ROC to reduce noise and highlight trends in volume momentum.
Standard Deviation Bands:
The standard deviation of the smoothed ROC is calculated over a lookback period. Bands are plotted at +2σ (overbought) and -2σ (oversold) to provide context for extreme volume changes, similar to Bollinger Bands but applied to volume ROC.
Key Plots:
SMA Line (Orange): The smoothed ROC value. Positive values indicate increasing volume momentum; negative values suggest decreasing momentum.
Zero Line (Black Dotted): A reference line at 0, separating positive and negative ROC territories.
+2σ Band (Red Dotted): Upper overbought threshold. Crossings above this may signal excessive buying volume.
-2σ Band (Green Dotted): Lower oversold threshold. Dips below this could indicate capitulation or low interest.
Usage and Interpretation:
Trend Confirmation:
Use the SMA crossing above/below zero to confirm price trends with volume backing. For example, a rising price with positive Volume ROC suggests strong conviction.
Divergences:
Look for divergences between price and Volume ROC (e.g., price making new highs but ROC weakening), which can signal reversals.
Overbought/Oversold Signals:
The ±2σ bands act as dynamic levels. Volume ROC spiking above +2σ might precede pullbacks, while below -2σ could indicate buying opportunities.
Best Applied To:
European indices (like FTSEMIB or DAX), stocks, or futures with defined session hours. Test on intraday (e.g., 2h) and combine with price-based indicators like RSI or MACD for confluence.
Customization:
Adjust the ROC/SMA lengths for sensitivity (shorter for scalping, longer for swings). The STDEV lookback affects band width—longer periods create smoother bands.
Limitations:
Volume data can be noisy in low-liquidity symbols. This indicator assumes consistent session lengths; irregular holidays may affect accuracy. Always backtest and use with risk management.
This indicator is original and built for educational/trading purposes.
Open Interest Bubbles [BackQuant]Open Interest Bubbles
A visual OI positioning overlay that aggregates futures open interest across major venues, normalizes it into a consistent “signal strength” scale, then plots extreme events as bubbles, labels, and optional horizontal levels directly on price.
What this is for
Open interest is one of the cleanest ways to track when positioning is building, unwinding, or aggressively shifting. The problem is raw OI is noisy, exchange-specific, and hard to compare across time. This script solves that by:
- Aggregating OI across multiple exchanges.
- Letting you choose what “OI signal” you care about (raw, delta, percent versions).
- Normalizing the signal so “big events” are easy to spot.
- Plotting those events as bubbles and levels at the exact price they occurred.
You end up with a clean, fast visual map of where large positioning changes occurred, and where those events may later matter as reaction points.
────────────────────────────────────────────────────────────
Plotting types (what you can display)
Bubbles
This mode plots OI events as size-bucketed circles on the chart. Bigger bubbles represent stronger normalized events. You can tune:
- Bubble sizing by bucket (Tiny → Huge).
- Heatmap vs solid color styling.
- Signed vs unsigned coloring (positive/negative separation or magnitude-only).
Best use:
- Spotting “where something changed” at a glance.
- Identifying clusters of positioning events around key price zones.
- Seeing whether the market is repeatedly building/closing positions at similar levels.
Levels
Levels mode draws a horizontal line at the anchor price when an extreme OI event triggers. These act like “positioning memory” levels:
- They do not claim to be support/resistance by themselves.
- They highlight prices where the derivatives market clearly did something meaningful.
Best use:
- Marking potential reaction zones.
- Combining with your price action tools (structure, OBs, FVGs) to confirm whether an OI level aligns with a technical level.
- Building a “map” of where leverage likely entered or exited.
Modes available in the script:
- Off
- Bubbles
- Bubbles + Labels
- Labels Only
- Levels + Labels
────────────────────────────────────────────────────────────
Aggregated Open Interest source (multi-exchange)
This indicator builds a single aggregated OI series by requesting OI data from multiple exchanges and summing it. You can toggle exchanges on/off:
- Binance, Bybit, OKX, Bitget, Kraken, HTX, Deribit
You can also choose OI units:
- COIN , OI in base units (native sizing)
- USD , converted for a dollar-value representation
Important note:
Not every symbol has OI data on every venue. If the script cannot build an aggregated series for the symbol, it will throw an error rather than quietly plotting garbage.
────────────────────────────────────────────────────────────
OI Source, what the bubbles are measuring
You control what “signal” is normalized and plotted:
- Delta , change in aggregated OI from the prior bar.
Use when you want to highlight bursts of new positioning or sudden unwind events.
- Raw OI , the aggregated open interest level itself.
Use when you want to highlight absolute positioning build-up periods.
- Delta % , percent change in OI.
Use when you want moves normalized to the current OI regime, useful across different market eras.
- Raw OI % , percent change form of the raw series.
Use when you want relative changes rather than absolute size.
Practical guidance:
- Delta modes are best for “event detection”.
- Raw modes are better for “regime context” and whether positioning is structurally rising or fading.
────────────────────────────────────────────────────────────
Normalization (the key to making it readable)
Because OI varies massively across assets and time, the script includes multiple normalization modes to convert your chosen OI source into a comparable “strength” value.
Options:
- ZScore , deviation from a rolling mean in standard deviation units.
- StdNorm , scaled by rolling standard deviation.
- AbsZScore , absolute value version for magnitude-only mapping.
- AbsStdNorm , absolute value version for magnitude-only mapping.
- None , plots raw values (advanced users only, often too noisy visually).
Why this matters:
Normalization makes a “1.5” or “3.0” threshold mean something across different assets and timeframes, instead of being stuck to raw OI units.
────────────────────────────────────────────────────────────
Threshold system (when bubbles/levels trigger)
The plot is driven by two user thresholds:
- Base Threshold
Controls where “meaningful” events start. Raising this reduces noise and focuses on larger deviations.
- Extreme Threshold
Controls what qualifies as a top-tier event. Extreme events are what you typically want to convert into labels and levels.
You also control side filtering:
- Both , show positive and negative events.
- Positive Only , show only increases (or positive signal side depending on source).
- Negative Only , show only decreases (or negative signal side).
In practice:
- Use Base Threshold to tune chart cleanliness.
- Use Extreme Threshold to mark only the “big stuff” that tends to matter later.
────────────────────────────────────────────────────────────
Anchor Source (where the bubble/level is placed)
The indicator places bubbles, labels, and levels at a price anchor you choose:
- HL2, Close, Open, High, Low, VWAP
This is important because “where you pin the event” changes how it reads:
- Close is clean and consistent for backtesting and candle-close logic.
- High/Low can better represent where the fight occurred intrabar.
- VWAP can be useful for “fair price” anchoring in active markets.
────────────────────────────────────────────────────────────
Style system (theme, palette, signed logic)
This script is built to look good and stay readable on busy charts.
Themes
- BackQuant, Classic, Ice, Fire, Mono, Custom
Palette Mode
- Solid , one consistent color
- Heatmap , intensity increases with magnitude
- Single Color Adaptive , adapts to chart background for clarity
Side Coloring
- Signed , positive and negative events can use different ramps
- Unsigned , magnitude-only coloring
Negative theme handling:
- Auto (mirrors your chosen theme),
- Invert (flips the ramp),
- Custom (fully user-defined negative palette).
What this gives you:
- You can run a clean “mono” look for professional charts.
- Or a high-contrast heatmap for fast scanning.
- Or fully custom branding colors for BackQuant-style presentation.
────────────────────────────────────────────────────────────
Labels (what’s inside the label)
When labels are enabled, the script can display:
- OI , the aggregated OI value
- OI + Norm , OI plus normalized strength
- Norm Only , just the normalized strength
- Src + Norm , the selected source value (Delta, Raw, %) plus normalized strength
You can also control:
- Left/Center/Right label alignment
- Number formatting style (Raw, Compact, Volume format)
Best practice:
- Use “Src + Norm” when you want both the raw event size and its rarity.
- Use “Norm Only” when you want a clean, minimal chart.
────────────────────────────────────────────────────────────
Levels and object limits (performance and cleanliness)
Because this script draws objects, it includes a hard cleanup system:
- You set Max Levels / Labels to control chart clutter.
- The script deletes older lines/labels when the limit is exceeded.
This is critical if you trade lower timeframes, where OI events can trigger frequently.
────────────────────────────────────────────────────────────
How to interpret the signals
What a large bubble usually means:
- A statistically large positioning change relative to recent history.
- This can represent fresh leverage entering, forced liquidations, or aggressive de-risking, depending on direction and context.
How to use levels:
- Treat them as “attention levels”, not automatic entries.
- Combine them with structure and liquidity tools:
- If price revisits an OI level and shows rejection, it often confirms that level mattered.
- If price slices through with no reaction, it often indicates the OI event was transitional, not defended.
Common setups:
- Clustered extreme bubbles near a breakout zone, then retest later.
- Extreme negative event at capitulation low, followed by structure flip.
- Extreme positive build into resistance, then unwind and mean reversion.
Also, please check out @NoveltyTrade for the OI Aggregation logic & pulling the data source!
Here is the original script:

Advanced custom multi MA signals (EMA/SMA/VWMA/VWAP) Features of Multi Moving Averages
The biggest enemy in trading is "Noise." If you get swayed by minute fluctuations on the chart, you end up missing the forest for the trees.
This indicator (Advanced Custom Multi MA Signals) is not just a simple line. By combining the three core elements of Price, Time, and Volume, it acts as a navigation system that visualizes the market's "true trend." In particular, the ability to analyze 5 moving averages simultaneously across various timeframes is akin to viewing a 3D map of the battlefield.
Understanding Core Concepts
This indicator supports 4 types of moving averages. It is crucial to clearly understand the nature of each tool.
SMA (Simple Moving Average): The most basic average value. Since it produces fewer whipsaws (false signals), it is used as a baseline to judge the "long-term trend."
EMA (Exponential Moving Average): Places more weight on recent prices. It reacts sensitively to market changes, making it advantageous for identifying "entry points."
VWMA (Volume Weighted Moving Average): Incorporates "volume" into the price calculation. It acts as a "false signal filter," weeding out price moves that aren't backed by trading volume.
VWAP (Volume Weighted Average Price): The benchmark price used by institutional investors for daily trading. It is calculated based on the session, regardless of the period settings. It is considered the "lifeline" of day trading.
Indicator Settings Guide
Open the settings window and tune it to fit your trading style.
MA 01 ~ 05 (Moving Average Settings)
MA Type: Select according to your purpose. (Generally, EMA is recommended for short-term analysis, SMA/VWMA for long-term).
Length: Enter the period you wish to analyze (e.g., 20, 60, 120, 200).
Timeframe: This is the core feature. It allows you to overlay moving averages from a higher timeframe (e.g., 4-hour, Daily) onto the chart you are currently viewing (e.g., 15-minute).
Signal Option (Trading Signals)
Golden Cross (GC) / Death Cross (DC): Captures the moment the short-term line breaks through the long-term line. You can run up to 3 strategies simultaneously.
Ribbon Gradient (Trend Visualization)
Represents the gap between two moving averages with color. As the color deepens and the width expands, it indicates a powerful trend; if the width narrows, it suggests a high probability of a trend reversal.
5 Usage Strategies
The highlight of this indicator is the cross strategy utilizing the "Multi-Timeframe (MTF)" feature. Familiarize yourself with the 5 example strategies below and set up your own strategy based on your expertise.
💡 Tip 1. Do not go against the "Major Trend" (The Authority of the Weekly Candle)
Settings: Set MA5 to .
Interpretation: The Weekly 50 line is the "major trend line" managed by institutions and market makers. If the current price is above this line, maintain only a "Buy (Long)" bias; if below, maintain only a "Sell (Short)" bias. Adhering to this rule alone can help you avoid massive losses.
💡 Tip 2. Highly Reliable "Swing Signal" (Daily Golden Cross)
Settings: In Signal 1, configure the Short MA to and the Long MA to .
Interpretation: A Golden Cross where the 4-Hour 50 EMA breaks above the Daily 50 EMA often signifies a major "trend reversal" rather than a temporary rebound. This provides an ideal entry signal for office workers or swing traders who need high reliability.
💡 Tip 3. 4-Hour Candle as the Standard for "Precision Entry"
Situation: When the Daily trend is rising (Bullish alignment).
Strategy: While watching the 15-minute or 1-hour chart, set the indicator's Signal 2 to the cross of and .
Interpretation: When the Daily chart is in an uptrend, a Golden Cross occurring on the 4-Hour chart marks "the point where a correction (pullback) ends and the rise resumes." This is the entry point with the best risk-to-reward ratio.
💡 Tip 4. Filtering Out "Fake Signals" (The Secret of Volume)
Strategy: When creating a cross signal, try using VWMA (Volume Weighted) for the Long MA, even if you use EMA for the Short MA.
Reason: A Golden Cross caused simply by a rise in price can be a trap. However, if it breaks through the heavy VWMA line accompanied by volume, it is strong evidence that "genuine liquidity" has entered.
💡 Tip 5. Remember the "Hierarchy" (Higher Timeframe Priority Rule)
Principle: If a Golden Cross (Buy Signal) appears on the 4-Hour chart, but the Daily chart is in a Death Cross (Sell Signal) state, do not enter.
Interpretation: A signal from a lower timeframe cannot overcome the power of a higher timeframe. The professional approach is to trade with significant volume only when signals align (Sync) in the order of Weekly > Daily > 4-Hour. Keep this indicator's dashboard feature on and always check the status of higher timeframes.
Signal Generation Principle (Operating Mechanism)
Signals are generated when the set short-term moving average and long-term moving average cross each other.
📈 1. Golden Cross (BUY = Buy Signal)
Situation: The moment the short-term MA crosses upward from below the long-term MA.
Principle: It implies that recent buying pressure has broken through the resistance level accumulated over a long period.
📉 2. Death Cross (SELL = Sell Signal)
Situation: The moment the short-term MA crosses downward from above the long-term MA.
Principle: It implies that recent selling pressure has collapsed the long-term support line.
※ If the candles are not displaying correctly or are flickering, please set the indicator's 'Visual order' to 'Bring to front' as shown in the image below.
Investment Caution and Disclaimer
Before using this indicator for actual trading, please strictly read the contents below.
① Auxiliary indicators are a "Compass," not a "Book of Prophecy."
This indicator is merely a tool that mathematically calculates and visualizes past price data. A "magic indicator" that predicts future price fluctuations 100% accurately or guarantees profit does not exist. The signals provided are for reference only and must never be the sole basis for entry/exit decisions.
② The responsibility for all investments lies with "Yourself."
Financial investment (Cryptocurrencies, Stocks, Futures, etc.) involves high volatility and is a risky activity that can result in the loss of some or all of the principal. The final responsibility for all trading results (profits and losses) incurred by utilizing this indicator lies entirely with the investor. The distributor and developer accept no legal responsibility for investment results under any circumstances.
③ Past data does not guarantee the future.
Even a Golden Cross that fit perfectly in backtesting or past charts may operate differently in tomorrow's market situation (News, Macroeconomics, Unexpected Variables, etc.). Do not rely solely on technical analysis; you must conduct fundamental analysis and risk management in parallel.
④ Risk management is the top priority.
No matter how promising a signal appears, "all-in trading" (investing all assets in a single trade) is a shortcut to bankruptcy. More important than the indicator itself is adhering to the principles of strict scaling in (split buying) and Stop-Loss.

EMA Slope Angle V2 Auto Threshold# EMA Slope Angle Indicator
## Overview
The EMA Slope Angle Indicator visualizes the Exponential Moving Average (EMA) slope as an angle in degrees, providing traders with a clear, quantitative measure of trend strength and direction. The indicator features **automatic threshold calculation based on Gaussian distribution**, making it adaptive to any market and timeframe.
## Key Features
### 🎯 **Automatic Threshold Calculation (NEW!)**
- **Gaussian Distribution-Based**: Automatically calculates optimal thresholds from the 50% interquartile range (IQR) of historical angle data
- **Asset-Adaptive**: Thresholds adjust to each instrument's unique volatility and price characteristics
- **No Manual Tuning Required**: Simply enable "Use Auto Thresholds" and let the indicator optimize itself
### 📊 **Dynamic EMA Coloring**
- **Color Intensity**: EMA line color intensity reflects slope strength
- **Visual Feedback**:
- Green shades for uptrends (darker = stronger)
- Red shades for downtrends (darker = stronger)
- Gray for flat/neutral conditions
### 📈 **Regime Detection**
- **Three Regimes**: RISING, FALLING, and FLAT
- **Smart Classification**: Based on statistical distribution of angles
- **Non-Repainting**: All calculations use confirmed bars only
### 🔔 **Trend-Shift Signals**
- **Visual Arrows**: Automatic signals when transitioning from FLAT to RISING/FALLING
- **Configurable**: Enable/disable signals as needed
- **Reliable**: Only triggers on significant regime changes
### 📋 **KPI Dashboard**
- **Real-Time Metrics**: Current angle, regime, and last signal
- **Auto-Threshold Display**: Shows calculated thresholds when auto-mode is active
- **Statistics**: Optional angle distribution statistics
- **Clean Layout**: Top-right corner, non-intrusive
### 📊 **Angle Statistics (Optional)**
- **Distribution Analysis**: Histogram of angle ranges
- **Dynamic Buckets**: Automatically adjusts to data distribution when auto-mode is enabled
- **Percentage Breakdown**: See how often each angle range occurs
## Settings
### Main Settings
- **EMA Length**: Period for the Exponential Moving Average (default: 50)
- **Slope Lookback Bars**: Number of bars to calculate slope over (default: 5)
### Angle Settings
- **Use Auto Thresholds**: Enable automatic threshold calculation (recommended!)
- **Analysis Period**: Number of bars to analyze for distribution (default: 500)
- **Manual Thresholds**: Flat, Rising, and Falling triggers (used when auto-mode is off)
- **Max Angle for Color Saturation**: Maximum angle for color intensity scaling
### Display Options
- **Colors**: Customize uptrend, downtrend, and flat colors
- **Show Signals**: Enable/disable trend-shift arrows
- **Show Statistics**: Display angle distribution table
- **Show Dashboard**: Toggle KPI dashboard visibility
## How It Works
### Angle Calculation
The indicator calculates the angle between the current EMA value and the EMA value N bars ago:
```
Angle = arctan((EMA_now - EMA_then) / lookback) × 180° / π
```
### Auto-Threshold Calculation
When enabled, the indicator:
1. Analyzes historical angle data over the specified period
2. Calculates mean and standard deviation
3. Determines thresholds based on the 50% interquartile range (IQR):
- **Flat Threshold**: ±0.674σ (middle 50% of data)
- **Rising Trigger**: 75th percentile (mean + 0.674σ)
- **Falling Trigger**: 25th percentile (mean - 0.674σ)
### Regime Classification
- **FLAT**: Angle within ±Flat Threshold
- **RISING**: Angle ≥ Rising Trigger
- **FALLING**: Angle ≤ Falling Trigger
## Use Cases
### Trend Following
- Identify strong trends (high angle values)
- Spot trend reversals (regime changes)
- Filter trades based on trend strength
### Range Trading
- Detect flat/consolidation periods
- Avoid trading during choppy markets
- Enter when regime shifts from FLAT to RISING/FALLING
### Multi-Timeframe Analysis
- Apply to different timeframes for confirmation
- Use higher timeframe for trend direction
- Use lower timeframe for entry timing
## Tips for Best Results
1. **Enable Auto-Thresholds**: Let the indicator adapt to your instrument
2. **Adjust Analysis Period**: Use more bars for stable markets, fewer for volatile ones
3. **Combine with Price Action**: Use regime changes as confirmation, not standalone signals
4. **Multi-Timeframe**: Check higher timeframes for trend context
5. **Backtest First**: Test settings on historical data before live trading
## Technical Details
- **Non-Repainting**: All calculations use `barstate.isconfirmed`
- **Pine Script v6**: Latest version for optimal performance
- **Efficient**: Minimal computational overhead
- **Customizable**: Extensive settings for fine-tuning
## Version History
**v2.0** (Current)
- Added automatic threshold calculation based on Gaussian distribution
- Dynamic bucket adjustment for statistics
- Enhanced dashboard with auto-threshold display
- Improved regime detection using IQR method
**v1.0**
- Initial release with manual thresholds
- Basic EMA coloring
- Trend-shift signals
- KPI dashboard
## Support
For questions, suggestions, or bug reports, please leave a comment or contact the author.
---
**Disclaimer**: This indicator is for educational purposes only. Past performance does not guarantee future results. Always use proper risk management and never risk more than you can afford to lose.
**Keywords**: EMA, slope, angle, trend, automatic thresholds, Gaussian distribution, regime detection, non-repainting, adaptive

Selected Days Indicator V3-TrDoes the stock drop every Wednesday? Do March months always move similarly? Does the 1st week of the month behave differently?
Do you ever say "it always makes this move in these months"? Don't you want to see more clearly whether it actually makes this move or not? Don't you want to see and test periodically repeating price patterns?
Hisse her Çarşamba düşüyor mu? Mart ayları hep benzer mi hareket ediyor? Ayın 1. haftası farklı mı davranıyor?
Bazen "bu aylarda hep bu hareketi yapıyor" dediğiniz oluyor mu? Gerçekten de bu hareketi yapıp yapmadığını daha net görmek istemez misiniz? Periyodik tekrarlayan fiyat kalıplarını görmek ve test etmek istemiyor musunuz?
1. Problem
Some stocks or crypto assets exhibit systematic behaviors on certain days, weeks, or months. But it's hard to see - everything is mixed together on the chart. This indicator isolates the days/weeks/months you want and shows only them. Hides everything else.
2. How It Works
Three-layer filter: Day (Monday, Tuesday...), Week (1st, 2nd, 3rd week of the month), Month (January, February...). Select what you want, let the rest disappear. Example: Show only Thursdays of March-June-September. Or compare every 1st week of the month. View as candlestick, line, or column chart.
3. What's It Good For?
Test "end-of-month effect". Find "day-of-the-week anomaly". Analyze crypto volatility by days. See seasonality in commodities. Discover patterns specific to your own strategy. Past data doesn't guarantee the future but provides statistical advantage.

[AlscapeLabs] HTF Candle Stack (Multi-Timeframe)
Overview
The HTF Candle Stack (Multi-TF) indicator is a powerful visualization tool designed to overlay high-timeframe (HTF) price action directly onto your current chart, independent of the chart's price scale. This gives traders a clear, aligned, and non-overlapping view of simultaneous price movements across customizable timeframes.
By stacking the candles horizontally next to the chart's price action, the indicator allows for quick identification of multi-timeframe correlation, trend confluence, and key levels without switching chart timeframes.
Key Features
6 Independent Stacks: Configure up to 6 separate timeframes (e.g., 5m, 15m, 1H, 4H, Daily, Weekly) to view the complete market fractals from micro to macro.
Price-Aligned Visualization : All HTF candle stacks are perfectly aligned with the main chart's vertical price axis
Replay Mode Safe : Includes dedicated logic to prevent "duplicate candles" during Bar Replay, ensuring accurate backtesting and historical analysis.
Toggleable Stacks : Each stack can be individually enabled or disabled via input settings
Dynamic Spacing : The distance between active stacks is automatically calculated and adjusted based on the visibility of the preceding stack.
Settings Guide
Stack Configuration (1 - 6)
Each of the six stacks has identical controls:
Show/Hide : Enable or disable this specific stack.
Timeframe : The specific HTF to display (e.g., "60" for 1 Hour, "D" for Daily).
[*} Count : How many candles to show in this stack (Current Active Candle + Past Closed Candles). Tip: Use higher counts (10-12) for lower TFs (Stack 1-2) and lower counts (2-4) for higher TFs (Stack 5-6)
Candle Color
Controls global coloring
Bullish / Bearish : Customize the body colors.
Wick : Separate control for wick color and transparency
Layout
Distance from Chart : How far (in bars) to the right the first stack begins
Space between Stacks : The gap (in bars) between each active stack.
Candle Width : The thickness of the HTF candles.
Labels
Displays a time-frame next to the active (live) candle in each stack
Show TF Labels : Enable or disable labels through all stacks
Text Color : Label text color
Background : Label background color
Style : Label position (Left, Down)
Size : Label text size (Tiny, Small, Normal, Large, Huge)
Developed by AlscapeLabs

Market + Direction + Entry + Hold + Exit v1.5 FINALOverview
This script is a complete trend-based trading framework designed to filter market conditions, determine directional bias, detect high-quality pullback entries, manage active trades, and identify trend-weakening exit points.
It is optimized for NQ futures, Gold (XAUUSD), and Bitcoin, with adaptive parameters for each asset.
The logic focuses on trading only when conditions are favorable, aligning entries with the primary trend, and avoiding low-probability setups.
1. Market Condition Filter
Before any signal appears, the script checks whether the market is active using three conditions:
ATR compared to ATR moving average (volatility condition)
Volume compared to average volume (liquidity condition)
Price distance from VWAP (suppression of mean-reversion environments)
A trade environment is considered active when at least two of these three conditions are positive.
2. Trend Direction Filter
Directional bias is defined by:
EMA21 relative to EMA55
Price relative to VWAP
Heikin-Ashi structure
When these conditions align, the script switches into long-only or short-only mode.
No counter-trend signals are displayed.
3. Entry Logic (L, L2, L3 and S, S2, S3)
The system identifies pullback entries within a confirmed trend.
Long entries require:
Uptrend confirmation
Price dipping toward EMA21 or EMA55
A constructive Heikin-Ashi candle
Market environment active
Short entries mirror the same structure in bearish conditions.
Re-entries (L2, L3, S2, S3) are given only if the trend remains intact after the first entry.
4. Hold Logic
A hold signal appears if momentum remains aligned with the trend.
Momentum is evaluated using the Stochastic indicator (K and D lines).
5. Exit Logic
An exit signal appears when:
The recent structural low (for longs) or high (for shorts) is broken, and
The EMA slope indicates weakening trend strength
This combination identifies high-probability trend exhaustion.
How to Use
Add the script to your chart.
Select an asset preset (NQ, GOLD, BTC).
Wait for the market to be active.
Follow the entry signals (L, L2, L3 or S, S2, S3).
Hold signals help confirm continuation.
Exit signals indicate potential trend reversal or weakness.
Feature Summary
Market environment filter
Trend direction filter
Pullback-based entry system
Multi-stage re-entry framework
Momentum-based hold signal
Structure-based exit
Asset-adaptive parameters
Clean chart visualization
Disclaimer
This script is for research and educational use.
It does not constitute financial advice.
Always backtest before using in live markets.
개요
이 스크립트는 시장 상태 필터링, 추세 방향 판단, 고품질 눌림목 진입, 보유 판단, 추세 약화 기반 청산까지 모두 포함하는 완전한 트레이딩 프레임워크입니다.
NQ, 골드(XAUUSD), 비트코인에 맞게 최적화되어 있습니다.
1. 시장 필터
다음 세 가지 중 두 가지 이상이 충족될 때만 매매 환경을 ‘활성’으로 판단합니다.
ATR 기준 변동성 체크
거래량 활성도 체크
가격의 VWAP 거리 체크
2. 방향(추세) 필터
다음 조건을 기반으로 상승·하락 추세를 결정합니다.
EMA21 vs EMA55
가격 vs VWAP
Heikin-Ashi 구조
이 조건이 일치할 때만 롱 전용 또는 숏 전용 모드로 진입합니다.
3. 진입 로직
추세가 유지되는 상태에서 EMA21 또는 EMA55까지 눌림이 나올 때
L 또는 S 신호를 제공합니다.
추세가 유지되면 L2/L3, S2/S3 재진입 신호가 추가로 발생합니다.
4. 보유(Hold)
모멘텀이 추세 방향과 일치할 때 보유 신호를 제공합니다.
5. 청산(Exit)
다음 두 조건이 동시에 나타날 때 청산 신호가 표시됩니다.
직전 구조(스윙)가 붕괴될 때
EMA 기울기가 약화될 때
사용 방법
차트에 스크립트를 추가합니다.
자산 프리셋(NQ, GOLD, BTC)을 선택합니다.
시장이 활성일 때만 신호를 참고합니다.
L/S 진입 신호와 보유/청산 신호를 활용해 매매 흐름을 관리합니다.

50% level of Daily RangeThe 50% or midpoint between the current days highest and lowest points be used to divide the premium and discount of the days range. Price often reacts at this point and it can be used as a target for reversal trades. This indicator plots the level as it moves through out each day so is useful for backtesting as well as determining whether the current price is in premium or discount.

Bollinger Bands Forecast with Signals (Zeiierman)█ Overview
Bollinger Bands Forecast with Signals (Zeiierman) extends classic Bollinger Bands into a forward-looking framework. Instead of only showing where volatility has been, it projects where the basis (midline) and band width are likely to drift next, based on recent trend and volatility behavior.
The projection is built from the measured slopes of the Bollinger basis, the standard deviation (or ATR, depending on the mode), and a volatility “breathing” component. On top of that, the script includes an optional projected price path that can be blended with a deterministic random walk, plus rejection signals to highlight failed band breaks.
█ How It Works
⚪ Bollinger Core
The script first computes standard Bollinger Bands using the selected Source, Length, and Multiplier:
Basis = SMA(Source, Length)
Band width = Multiplier × StDev(Source, Length)
Upper/Lower = Basis ± Width
This remains the “live” (non-forecast) structure on the chart.
⚪ Trend & Volatility Slope Estimation
To project forward, the indicator measures directional drift and volatility drift using linear regression differences:
Basis slope from the Bollinger basis
StDev slope from the Bollinger deviation
ATR slope for ATR-based projection mode
These slopes drive the forecast bands forward, reflecting the market’s recent directional and volatility regime.
⚪ Projection Engine (Forecast Bands)
At the last bar, the indicator draws projected basis, upper, and lower lines out to Forecast Bars. The projected basis can be:
Trend (straight linear projection)
Curved (ease-in/out transition toward projected endpoints)
Smoothed (extra smoothing on projected basis/width)
⚪ Price Path Projection + Optional Random Walk
In addition to projecting the bands, the script can draw a price forecast path made of a small number of zigzag swings.
Each swing targets a point offset from the projected basis by a multiple of the projected half-width (“width units”).
Decay gradually reduces swing size as the forecast deepens.
The Optional Random Walk Blend adds a deterministic drift component to the zigzag path. It’s not true randomness; it’s a stable pseudo-random sequence, so the drawing doesn’t jump around on refresh, while still adding “natural” variation.
⚪ Rejection Signals
Signals are based on failed attempts to break a band:
Bear Signal (Down): price tries to push above the upper band, then falls back inside, while still closing above the basis.
Bull Signal (Up): price tries to push below the lower band, then returns back inside, while still closing below the basis.
█ How to Use
⚪ Forward Support/Resistance Corridors
Treat the projected upper/lower bands as a future volatility envelope, not a guarantee:
The upper projection ≈ is likely a resistance level if the regime persists
The lower projection ≈ is likely a support level if the regime persists
Best used for trade planning, targets, and “where price could travel” under similar conditions.
⚪ Regime Read: Trend + Volatility
The projection shape is informative:
Rising basis + expanding width → trend with increasing volatility (needs wider stops / more caution)
Flat basis + compressing width → contraction regime (often precedes expansion)
⚪ Signals for Mean-Reversion / Failed Breakouts
The rejection markers are useful for fade-style setups:
A Down signal near/after upper-band failure can imply rotation back toward the basis.
An Up signal near/after lower-band failure can imply snap-back toward the basis.
With MA filtering enabled, signals are constrained to align with the broader bias, helping reduce chop-driven noise.
█ Related Publications
Donchian Predictive Channel (Zeiierman)
█ Settings
⚪ Bollinger Band
Controls the live Bollinger Bands on the chart.
Source – Price used for calculations.
Length – Lookback period; higher = smoother, lower = more reactive.
Multiplier – Bandwidth; higher = wider bands, lower = tighter bands.
⚪ Forecast
Controls the forward projection of the Bollinger Bands.
Forecast Bars – How far into the future the bands are projected.
Trend Length – Lookback used to estimate trend and volatility slopes.
Forecast Band Mode – Defines projection behavior (linear, curved, breathing, ATR-based, or smoothed).
⚪ Price Forecast
Controls the projected price path inside the bands.
ZigZag Swings – Number of projected oscillations.
Amplitude – Distance from basis, measured in bandwidth units.
Decay – Shrinks swings further into the forecast.
⚪ Random-Walk
Adds controlled randomness to the price path.
Enable – Toggle random-walk influence.
Blend – Strength of randomness vs. zigzag.
Step Size – Size of random steps (band-width units).
Decay – Reduces randomness as the forecast deepens.
Seed – Changes the (stable) random sequence.
⚪ Signals
Controls rejection/mean-reversion signals.
Show Signals – Enable/disable signal markers.
MA Filter (Type/Length) – Filters signals by trend direction.
-----------------
Disclaimer
The content provided in my scripts, indicators, ideas, algorithms, and systems is for educational and informational purposes only. It does not constitute financial advice, investment recommendations, or a solicitation to buy or sell any financial instruments. I will not accept liability for any loss or damage, including without limitation any loss of profit, which may arise directly or indirectly from the use of or reliance on such information.
All investments involve risk, and the past performance of a security, industry, sector, market, financial product, trading strategy, backtest, or individual's trading does not guarantee future results or returns. Investors are fully responsible for any investment decisions they make. Such decisions should be based solely on an evaluation of their financial circumstances, investment objectives, risk tolerance, and liquidity needs.

RO H1 Signal CandleMarks specific H1 signal candles based on Bucharest (RO) time.
Designed for clean backtesting and time-based analysis.
Displays a small marker on selected hourly candles only.

ICT Premium/Discount Zones [Exponential-X]Premium/Discount Zones - Visual Market Structure Tool
Overview
This indicator helps traders visualize premium and discount price zones based on recent market structure. It automatically identifies swing highs and lows within a specified lookback period and divides the price range into three key areas: Premium Zone, Equilibrium, and Discount Zone.
What This Indicator Does
The script continuously monitors price action and calculates:
Highest High and Lowest Low within the lookback period
Equilibrium Level - the midpoint between the swing high and low
Premium Zone - the area from equilibrium to the swing high (typically viewed as relatively expensive price levels)
Discount Zone - the area from the swing low to equilibrium (typically viewed as relatively cheap price levels)
Core Calculation Method
The indicator uses pivot point logic to identify significant swing highs and lows based on the pivot strength parameter. It then calculates the highest high and lowest low over the specified lookback period. The equilibrium is computed as the arithmetic mean of these two extremes, creating a fair value reference point.
The zones are dynamically updated as new price data becomes available, ensuring the visualization remains relevant to current market conditions.
Key Features
Dynamic Zone Detection
Automatically adjusts zones based on recent price action
Uses customizable lookback period for flexibility across different timeframes
Employs pivot strength parameter to filter out minor price fluctuations
Visual Clarity
Color-coded zones for easy identification (red for premium, green for discount)
Optional equilibrium line display
Adjustable zone label placement
Customizable color schemes to match your charting preferences
Alert Capabilities
Alerts when price enters the premium zone
Alerts when price enters the discount zone
Alerts when price returns to equilibrium
Helps traders monitor key zone interactions without constant chart watching
Customization Options
Adjustable lookback period (5-500 bars)
Configurable pivot strength for swing detection (1-20 bars)
Control over box extension into the future
Toggle labels and equilibrium line on/off
Full color customization for all visual elements
How to Use This Indicator
Setup
Add the indicator to your chart
Adjust the lookback period to match your trading timeframe (shorter for intraday, longer for swing trading)
Set pivot strength to filter out noise (higher values for major swings, lower for more frequent updates)
Customize colors and labels to your preference
Interpretation
Premium Zone: Price trading here may indicate potential resistance or selling opportunities when aligned with other technical factors
Discount Zone: Price trading here may indicate potential support or buying opportunities when aligned with other technical factors
Equilibrium: Acts as a fair value reference point where price often consolidates or reacts
Trading Applications
This tool works well when combined with other forms of analysis such as:
Trend identification indicators
Volume analysis
Support and resistance levels
Price action patterns
Market structure analysis
Important Considerations
This indicator identifies zones based purely on historical price data
Premium and discount zones are relative to the recent lookback period
The effectiveness varies across different market conditions and timeframes
Should be used as part of a comprehensive trading strategy, not in isolation
Past price structure does not guarantee future price behavior
Technical Details
Calculation Method
Uses Pine Script's ta.pivothigh() and ta.pivotlow() functions for swing detection
Employs ta.highest() and ta.lowest() for range calculation
Updates dynamically with each new bar
Draws zones using box objects for clear visual representation
Performance Optimization
Efficiently manages box and line objects to minimize resource usage
Uses conditional plotting to reduce unnecessary calculations
Limited to essential visual elements for chart clarity
Timeframe Compatibility
This indicator works on all timeframes but the recommended settings vary:
1-5 minute charts: Lookback period 10-20, Pivot strength 3-5
15-60 minute charts: Lookback period 20-50, Pivot strength 5-10
Daily charts: Lookback period 50-100, Pivot strength 10-15
Weekly charts: Lookback period 20-50, Pivot strength 5-10
Adjust these values based on the volatility of your specific instrument.
Limitations and Considerations
What This Indicator Does NOT Do
Does not provide buy or sell signals on its own
Does not predict future price movements
Does not account for fundamental factors or market events
Does not guarantee profitability or accuracy
Market Condition Awareness
In strong trending markets, price may remain in premium or discount zones for extended periods
During ranging conditions, price typically oscillates between zones more predictably
High volatility can cause frequent zone recalculations
Low volatility may result in narrow zones with limited practical use
Risk Considerations
Premium and discount are relative concepts, not absolute values
What appears as a discount zone may continue lower in a downtrend
What appears as a premium zone may continue higher in an uptrend
Always use proper risk management and position sizing
Consider multiple timeframe analysis for context
Version Information
This indicator is written in Pine Script v6, ensuring compatibility with the latest TradingView features and optimal performance.
Final Notes
This tool is designed to enhance your market analysis by providing a clear visual representation of premium and discount price zones. It should be used as one component of a well-rounded trading approach that includes proper risk management, multiple forms of analysis, and realistic expectations about market behavior.
The concept of premium and discount zones is rooted in auction market theory and the idea that price oscillates around fair value. However, traders should understand that these zones are interpretive tools based on historical data and do not constitute trading advice or predictions about future price action.
Remember to backtest any strategy using this indicator on historical data before applying it to live trading, and always trade responsibly within your risk tolerance.
Disclaimer: The information provided by this indicator is for educational and informational purposes only. It does not constitute financial advice, investment advice, trading advice, or any other sort of advice. Always conduct your own research and consult with qualified financial professionals before making trading decisions.

Ripster Clouds + Saty Pivot + RVOL + Trend1. Ripster EMA Clouds (local + higher timeframe)
Local timeframe (your chart TF):
Plots up to 5 EMA clouds (8/9, 5/12, 34/50, 72/89, 180/200 – configurable).
Each cloud is:
One short EMA and one long EMA.
A filled band between them.
Color logic:
Cloud is bullish when short EMA > long EMA (green/blue-ish tone).
Bearish when short EMA < long EMA (red/orange/pink tone).
You can choose:
EMA vs SMA,
Whether to show the lines,
Per-cloud toggles.
MTF Clouds:
Two higher-timeframe EMA clouds:
Cloud 1: 50/55
Cloud 2: 20/21
Computed on a higher TF (default D, but configurable).
Show as thin lines + transparent bands.
Used for:
Visual higher-TF trend,
Optional signal filter (MTF must agree for trades).
2. Saty Pivot Ribbon (time-warped EMAs)
This is basically your Saty Pivot Ribbon integrated:
Uses a “Time Warp” setting to overlay EMAs from another timeframe.
EMAs:
Fast, Pivot, Slow (defaults 8 / 21 / 34).
Clouds:
Fast cloud between fast & pivot EMAs.
Slow cloud between pivot & slow EMAs.
Bullish/bearish colors are distinct from Ripster colors.
Optional highlights:
Can highlight fast/pivot/slow lines separately.
Conviction EMAs:
13 and 48 EMAs (configurable).
When fast conviction EMA crosses over/under slow:
You get triangle arrows (bullish/bearish conviction).
Bias candles:
If enabled, candles are recolored based on:
Price vs Bias EMA,
Candle up/down/doji,
So you see bullish/bearish “bias” directly in candle colors.
3. DTR vs ATR panel (range vs average)
In a small table panel (bottom-center by default):
Computes higher-TF ATR (default 14, TF auto D/W/M, smoothing type selectable).
Measures current range (high–low) on that TF.
Displays:
DTR: X vs ATR: Y Z% (+/-Δ% vs prev)
Where:
Z% = current range / ATR * 100.
Δ% = change vs previous bar’s Z%.
Background color:
Greenish for low move (<≈70%),
Red for high move (≥≈90%),
Yellow in between,
Slightly dimmed when price is below bias EMA.
This tells you: “Is today an average, quiet, or explosive day compared to normal?”
4. SMA Divergence panel
Separate histogram & line panel:
Fast and slow SMAs (default 14 & 30).
Computes price divergence vs SMA in %:
% above/below slow SMA,
% above/below fast SMA.
Shows:
Slow SMA divergence as a semi-transparent column,
Fast SMA divergence as a solid column on top,
EMA of the slow divergence (trend line) colored:
Blue when rising,
Orange/red when falling.
Static upper/lower bands with fill, plus optional zero line.
This gives you a feel for how stretched price is vs its anchors.
5. RVOL table (relative volume)
Small 3×2 table (bottom-right by default):
Inputs:
Average length (default 50 bars),
Optionally show previous candle RVOL.
Calculates:
RVOL now = volume / avg(volume N bars) * 100,
RVOL prev,
RVOL momentum (now – prev) for data window only.
Table columns:
Candle Vol,
RVOL (Now),
RVOL (Prev).
Colors:
200% → “high RVOL” color,
100–200% → “medium RVOL” color,
<100% → “low RVOL” color,
Slightly dimmer if price is below bias EMA.
This is used both visually and optionally as a signal filter (e.g., only trade when RVOL ≥ threshold).
6. Trend Dashboard (Price + 34/50 + 5/12)
Top-right trend box with 3 rows:
Price Action row:
Uses either Bias EMA or custom EMA on close to say:
Bullish (close > trend EMA),
Bearish (close < trend EMA),
Flat.
Ripster 34/50 Cloud row:
Uses 34/50 EMAs: bullish if 34>50, bearish if 34<50.
Ripster 5/12 Cloud row:
Uses 5/12 EMAs: bullish if 5>12, bearish if 5<12.
Then it does a vote:
Counts bullish votes (Price, 34/50, 5/12),
Counts bearish votes,
Depending on mode:
Majority (2 of 3) or Strict (3 of 3).
Output:
Overall Bullish / Bearish / Sideways.
You also get an optional label on the chart like
Overall: Bullish trend with color, and an optional background tint (green/red for bull/bear).
7. VWAP + Buy/Sell Signals
VWAP is plotted as a white line.
Fast “trend” cloud mid: average of 5 & 12 EMAs.
Slow “trend” cloud mid: average of 34 & 50 EMAs.
Buy condition:
5/12 crosses above 34/50 (bullish cloud flip),
Price > VWAP,
Optional filter: MTF Cloud 1 bullish (50/55 on higher TF),
Optional filter: RVOL >= threshold.
Sell condition:
5/12 crosses below 34/50,
Price < VWAP,
Optional same filters but bearish.
When conditions are met:
Plots BUY triangle up below price (distinct teal/green tone).
Plots SELL triangle down above price (distinct magenta/orange tone).
Alert conditions are defined for:
BUY / SELL signals,
Overall Bullish / Bearish / Sideways change,
MTF Cloud 1 trend flips.
8. Data Window metrics
For easy backtesting / inspection via TradingView’s data window, it exposes:
DTR% (Current) and DTR% Momentum,
RVOL% (Now), RVOL% (Prev), RVOL% Momentum.
TL;DR – What does this script do for you?
It turns your chart into a multi-framework trend and momentum dashboard:
Ripster EMA clouds for short/medium trend & S/R.
Saty Ribbon for higher-TF pivot structure and conviction.
RVOL + DTR/ATR for context (is this a big and well-participated move?).
SMA divergence panel for overextension/stretch.
A compact trend table that tells you Price vs 34/50 vs 5/12 in one glance.
Buy/Sell markers + alerts when:
short-term Ripster trend (5/12) flips over/under medium (34/50),
price agrees with VWAP,
plus optional filters (MTF trend and / or RVOL).
Basically: it’s a trend + confirmation + context system wrapped into one indicator, with most knobs configurable in the settings.

EMA Slope Angle# EMA Slope Angle Indicator
A professional, non-repainting overlay indicator that visualizes EMA slope strength as an angle in degrees, providing instant visual feedback through dynamic EMA coloring and comprehensive trend analysis.
## ORIGINALITY
This indicator is original in its approach to slope measurement:
- **Angle-based calculation**: Uses arctangent to calculate slope as an angle in degrees (not percentage), providing a more intuitive measure of trend strength
- **Dynamic visual feedback**: Combines real-time EMA line coloring with regime detection, creating a continuous visual representation of market conditions
- **Comprehensive analysis**: Integrates angle-based trend shift signals with optional statistical analysis in a single, cohesive tool
- **Non-repainting design**: All calculations use confirmed bars only, ensuring reliable, deterministic output
## HOW IT WORKS
The indicator calculates the EMA slope angle using trigonometric functions:
```
Angle = arctan((EMA_current - EMA_past) / lookback_bars) × 180/π
```
This provides an intuitive measure where:
- **Steep angles** = strong trends (visualized with saturated colors)
- **Shallow angles** = weak trends (visualized with lighter colors)
- **Near-zero angles** = flat/consolidation (visualized in gray)
The EMA line color dynamically reflects:
- **Direction**: Green shades for uptrends, red shades for downtrends
- **Strength**: Color intensity based on normalized angle (stronger slopes = more saturated colors)
- **Regime**: Gray for flat conditions when angle is below threshold
## KEY FEATURES
### Dynamic EMA Coloring
- EMA line color changes continuously based on slope strength
- Color intensity reflects trend strength (50-100% opacity range)
- Instant visual feedback without cluttering the chart
### Regime Detection
- Automatically classifies market conditions: **RISING**, **FALLING**, or **FLAT**
- Configurable angle thresholds for regime classification
- Real-time regime updates on confirmed bars only
### Trend-Shift Signals
- Detects transitions from FLAT to RISING/FALLING regimes
- Visual arrows on chart when significant trend shifts occur
- Prevents signal spam by only triggering from FLAT state
- Configurable trigger thresholds for signal sensitivity
### KPI Dashboard
- Real-time angle display (rounded to 1 decimal place)
- Current regime status with color coding
- Last signal tracking (UP/DOWN/NONE)
- Positioned in top-right corner for easy reference
### Advanced Angle Statistics (Optional)
- Detailed breakdown of angle distribution across 9 granular buckets:
- 0-0.2°, 0.2-0.5°, 0.5-1°, 1-1.5°, 1.5-2°, 2-3°, 3-5°, 5-10°, >10°
- Shows count and percentage for each bucket
- Automatically resets on symbol/timeframe changes
- Useful for analyzing historical slope patterns
## SETTINGS
### Main Settings
- **EMA Length**: Period for exponential moving average (default: 50)
- **Slope Lookback Bars**: Number of bars to compare for slope calculation (default: 5)
### Angle Settings
- **Flat Angle Threshold**: Maximum angle for FLAT regime classification (default: 2.0°)
- **Rising Angle Trigger**: Minimum angle to trigger RISING regime and UP signals (default: 1.0°)
- **Falling Angle Trigger**: Maximum angle to trigger FALLING regime and DOWN signals (default: -1.0°)
- **Max Angle for Color Saturation**: Maximum angle for full color intensity (default: 30.0°)
### Display Options
- **Uptrend Color**: Color for rising trends (default: dark green)
- **Downtrend Color**: Color for falling trends (default: dark red)
- **Flat Color**: Color for flat conditions (default: gray)
- **Show Trend-Shift Signals**: Toggle signal arrows on/off (default: true)
- **Show Angle Statistics**: Toggle statistics dashboard on/off (default: false)
## NON-REPAINTING GUARANTEE
- All calculations use confirmed bars only (`barstate.isconfirmed`)
- No future bar references
- No higher timeframe calls using `request.security()`
- Deterministic output - what you see is what you get
- Reliable for backtesting and live trading
## USE CASES
- **Trend Identification**: Instantly identify trend strength and direction at a glance
- **Reversal Detection**: Spot trend reversals early through regime changes
- **Trade Filtering**: Filter trades based on slope strength and regime
- **Consolidation Monitoring**: Identify flat market conditions for range trading
- **Pattern Analysis**: Study historical angle distributions to understand market behavior
- **Momentum Assessment**: Gauge trend momentum through visual color intensity
## LIMITATIONS
- Angle calculation depends on EMA length and lookback period settings
- Regime classification is based on configurable thresholds - adjust to match your trading style
- Signals only trigger when transitioning from FLAT state to prevent spam
- Statistics reset on symbol/timeframe changes (by design)
- Color intensity is normalized to max angle setting - adjust for your market's typical ranges
## TECHNICAL NOTES
- Uses Pine Script v6
- Overlay indicator (plots on price chart)
- No external dependencies
- Compatible with all TradingView chart types
- Works on all timeframes and symbols
## DISCLAIMER
This indicator is designed for visual trend analysis and educational purposes. Always combine with other technical analysis tools, fundamental analysis, and proper risk management strategies. Past performance does not guarantee future results. Trading involves risk of loss.
---
**Perfect for**: Swing traders, day traders, trend followers, and market analysts seeking intuitive trend strength visualization.

BALANCED Strategy: Intraday Pro + Smart DashboardWelcome to the BALANCED Strategy: Intraday Pro.
This all-in-one indicator is designed for Intraday traders looking to capture trend movements while effectively filtering out sideways market noise. It combines the power of Supertrend for direction, EMA 100 for the baseline trend, and rigorous validation via RSI and ADX.
The script also integrates a complete Risk Management system with targets based on the Golden Ratio (Fibonacci) and a real-time Dashboard.
⏳ Recommended Timeframes
This algorithm is optimized for Intraday volatility:
M5 (5 Minutes) ⭐️: Ideal for quick Scalping. The ADX filter is crucial here to avoid false signals.
M15 (15 Minutes) 🏆: The "Sweet Spot." It offers the best balance between signal frequency and trend reliability.
M30 / H1: For a "Swing Intraday" approach—calmer, fewer signals, but higher precision.
Not recommended for M1 (1 Minute) with default settings (too much noise).
🚀 How It Works
The algorithm follows a strict 3-step logic to generate high-quality signals:
1. Trend Identification (The Engine)
Supertrend: Determines the immediate direction.
EMA 100: Acts as a background trend filter. We only buy above and sell below the EMA.
2. Noise Filtering (Safety)
ADX (Average Directional Index): The signal is only validated if there is sufficient volatility (Configurable threshold, default 12) to avoid "chop markets" (flat markets).
RSI (Relative Strength Index): Strict momentum filter. Buy only if RSI > 50, Sell if RSI < 50.
3. Entry Confirmation (The Trigger)
The script doesn't just rely on a crossover. It waits for "Price Action" confirmation: the candle must close higher than the previous one (for Long) or lower (for Short) to validate the entry.
🛡️ Risk Management (Money Management)
This is the core strength of this tool. Upon signal validation, the script automatically calculates and plots:
Stop Loss (SL): Based on volatility (ATR). It places the stop at the recent Low/High with a safety padding.
Take Profit (TP): Two modes available:
Fibonacci Mode (Default): Targets the 1.618 extension (Golden Ratio) of the risk taken.
Fixed Ratio Mode: Targets a manual Risk/Reward ratio (e.g., 2.0).
📊 The Dashboard
Located at the bottom right, the smart dashboard provides vital info at a glance:
Signal Time: To check if the alert is fresh.
Type (LONG/SHORT): Color-coded (Green/Pink).
Tech Data: RSI and ADX values at the moment of the signal.
Exact Prices: Entry Level, Target (TP), and Stop Loss (SL).
⚙️ Configurable Settings
Sensitivity: Adjust the Supertrend factor (Default 2.0).
Filters: Toggle the RSI filter ON/OFF or adjust the ADX threshold.
Execution: Choose between Fibonacci Target (1.618) or a Manual Ratio.
⚠️ Disclaimer: This tool is a technical decision aid and does not constitute financial investment advice. Always use prudent risk management and backtest the indicator on your preferred assets before live use.

Multi-Distribution Volume Profile (Zeiierman)█ Overview
Multi-Distribution Volume Profile (Zeiierman) is a flexible, structure-first volume profile tool that lets you reshape how volume is distributed across price, from classic uniform profiles to advanced statistical curves like Gaussian, Lognormal, Student-t, and more.
Instead of forcing every market into a single "one-size-fits-all" profile, this tool lets you model how volume is likely concentrated inside each bar (body vs wicks, midpoint, tails, center bias, right-skew, heavy tails, etc.) and then stacks that behavior across a whole lookback window to build a rich, multi-distribution map of traded activity.
On top of that, it overlays a dynamic Center Band (value area) and a fade/gradient model that can color each price row by volume, hits, recency, volatility, reversals, or even liquidity voids, turning a plain profile into a multi-dimensional context map.
Highlights
Choose from multiple Profile Build Modes , including uniform, body-only, wick-only, midpoint/close/open, center-weighted, and a suite of probability-style distributions (Gaussian, Lognormal, Weibull, Student-t, etc.)
Flexible anchor layout: draw the profile on Right/Left (horizontal) or Bottom/Top (vertical) to fit any chart layout
Value Area / Center Band computed from volume quantiles around the POC.
Gradient-based Fade Metrics: volume, price hits, freshness (time decay), volatility impact, dwell time, reversal density, compression, and liquidity voids
Separate bullish vs bearish volume at each price row for directional structure insights
█ How It Works
⚪ Profile Construction
The script scans a user-defined Bars Included window and finds the full high–low span of that zone. It then divides this range into a user-controlled number of Price Levels (rows).
For each historical bar within the window:
It measures the candle’s price range, body, and wicks.
It assigns volume to rows according to the selected Profile Build Mode, for example:
* Range Uniform – volume spread evenly across the full high–low range.
* Range Body Only / Range Wick Only – concentrate volume inside the body or wicks only.
* Midpoint / Close / Open Only – allocate volume entirely into one price row (pinpoint modeling).
HL2 / Body Center Weighted – center weights around the middle of the range/body.
Recent-Weighted Volume – amplify newer bars using exponential time decay.
Volume Squared (Hard) – aggressively boost bars with large volume.
Up Bars Only / Down Bars Only – filter volume to only bullish or bearish bars.
For more advanced shapes, the script uses continuous distributions across the bar’s span:
Linear, Triangular, Exponential to High
Cosine Centered, PERT
Gaussian, Lognormal, Cauchy, Laplace
Pareto, Weibull, Logistic, Gumbel
Gamma, Beta, Chi-Square, Student-t, F-Shape
Each distribution produces a weight for each row within the bar’s range, normalized so the total volume remains consistent, but the shape of where that volume lands changes.
⚪ POC & Center Band (Value Area)
Once all rows are accumulated:
The row with the highest total volume becomes the Point of Control (POC)
The script computes cumulative volume and finds the band that wraps a user-defined Center of Profile % (e.g., 68%) around the center of distribution.
This range is displayed as a central band, often treated like a value area where price has spent the most “effort” trading.
⚪ Gradient Fade Engine
Each row also gets a fade metric, chosen in Fade Metric:
Volume – opacity based on relative volume.
Price Hits – how frequently that row was touched.
Blended (Vol+Hits) – average of volume & hits.
Freshness – emphasizes recent activity, controlled by Decay.
Volatility Impact – rows that saw larger ranges contribute more.
Dwell Time – where price “camped” the longest.
Reversal Density – where direction changes cluster.
Compression – tight-range compression zones.
Liquidity Void – inverse of volume (thin liquidity zones).
When Apply Gradient is enabled, the row’s bullish/bearish colors are tinted from faint to strong based on this chosen metric, effectively turning the profile into a heatmap of your chosen structural property.
█ How to Use
⚪ Explore Different Distribution Assumptions
Switch between multiple Profile Build Modes to see how your assumptions about intrabar volume affect structure:
Use Range Uniform for classical profile reading.
Deploy Gaussian, Logistic, or Cosine shapes to emphasize central clustering.
Try Pareto, Lognormal, or F-Shape to focus on tail / extremal activity.
Use Recent-Weighted Volume to prioritize the most recent structural behavior.
This is especially useful for traders who want to test how different modeling assumptions change perceived value areas and levels of interest.
⚪ Identify Value, Acceptance & Rejection Zones
Use the POC and Center of Profile (%) band to distinguish:
High-acceptance zones – wide central band, thick rows, strong gradient → fair value areas
Rejection zones & tails – thin extremes, low dwell time, high volatility or reversal density
These regions can be used as:
Targets and origin zones for mean reversion
Context for breakout validation (leaving value)
Bias reference for intraday rotations or swing rotations
⚪ Read Directional Structure Within the Profile
Because each row is split into bullish vs bearish contributions, you can visually read:
Where buyers dominated a price region (large bullish slice)
Where sellers absorbed or defended (large bearish slice)
Combining this with Fade Metrics like Reversal Density, Dwell Time, or Freshness turns the profile into a structural order-flow map, without needing raw tick-by-tick volume data.
⚪ Use Fade Metrics for Contextual Heatmaps
Each Fade Metric can be used for a different analytical lens:
Volume / Blended – emphasize where volume and activity are concentrated.
Freshness – highlight the most recently active zones that still matter.
Volatility Impact & Compression – spot areas of explosive moves vs coiled ranges.
Reversal Density – locate micro turning points and battle zones.
Liquidity Void – visually pop out thin regions that may act as speedways or magnets.
█ Settings
Profile Build Mode – Selects how each bar’s volume is distributed across its price range (uniform, body/wick, midpoint/close/open, center-weighted, or statistical distribution families).
Bars Included – Number of bars used to build the profile from the current bar backward.
Price Levels – Vertical resolution of the profile: more levels = smoother but heavier.
Anchor Side – Where the profile is drawn on the chart: Right, Left, Bottom, or Top.
Offset (bars) – Horizontal offset from the last bar to the profile when using Right/Left modes.
Apply Gradient – Toggles the fade/heatmap coloring based on the selected metric.
Fade Metric – Chooses the property driving row opacity (Volume, Hits, Freshness, Volatility Impact, Dwell Time, Reversal Density, Compression, Liquidity Void).
Decay – Time-decay factor for Freshness (values close to 1 keep older activity relevant for longer).
Profile Thickness – Relative thickness of the profile along the time axis, as a % of the lookback window.
Center of Profile (%) – Volume percentage used to define the central band (value area) around the POC.
-----------------
Disclaimer
The content provided in my scripts, indicators, ideas, algorithms, and systems is for educational and informational purposes only. It does not constitute financial advice, investment recommendations, or a solicitation to buy or sell any financial instruments. I will not accept liability for any loss or damage, including without limitation any loss of profit, which may arise directly or indirectly from the use of or reliance on such information.
All investments involve risk, and the past performance of a security, industry, sector, market, financial product, trading strategy, backtest, or individual's trading does not guarantee future results or returns. Investors are fully responsible for any investment decisions they make. Such decisions should be based solely on an evaluation of their financial circumstances, investment objectives, risk tolerance, and liquidity needs.

FOMC Federal Fund Rate Tracker [MHA Finverse]The FOMC Rate Tracker is a comprehensive indicator that visualizes Federal Reserve interest rate decisions and tracks market behavior during FOMC meeting periods. This tool helps traders analyze historical rate changes and anticipate market movements around Federal Open Market Committee announcements.
Key Features:
• Visual FOMC Periods - Automatically highlights each FOMC meeting period with colored boxes spanning from announcement to the next meeting
• Complete Rate Data - Displays actual rates, forecasts, previous rates, and rate differences for every meeting from 2021-2026
• Multiple Color Modes - Choose between cycle colors for visual distinction or rate difference colors (green for hikes, red for cuts, gray for holds)
• Smart Filtering - Filter periods by rate hikes only, cuts only, no change, or surprise moves to focus on specific market conditions
• Performance Metrics - Track average returns during rate hikes, cuts, and holds to identify historical patterns
• Volatility Analysis - Measure and compare price volatility across different FOMC periods
• Statistical Dashboard - View total hikes, cuts, holds, surprises, and longest hold streaks at a glance
• Built-in Alerts - Get notified 1 day before FOMC meetings, on meeting day, or when rates change
How It Works:
The indicator divides your chart into distinct periods between FOMC meetings, with each period showing a labeled box containing the meeting date, actual rate, forecast, previous rate, and rate difference. Future meetings are marked as "UPCOMING" to help you prepare for scheduled announcements.
Use Cases:
- Analyze how markets typically react to rate hikes vs. cuts
- Identify volatility patterns around FOMC announcements
- Backtest strategies based on monetary policy cycles
- Plan trades around upcoming Federal Reserve meetings
- Study the impact of surprise rate decisions on price action
Customization Options:
- Adjustable box transparency and outlines
- Customizable label sizes and colors
- Toggle individual dashboards on/off
- Filter specific types of rate decisions
- Configure alert preferences
This indicator is ideal for traders who incorporate fundamental analysis and monetary policy into their trading decisions. The historical data provides context for understanding market reactions to Federal Reserve actions.

Gyspy Bot Trade Engine - V1.2B - Alerts - 12-7-25 - SignalLynxGypsy Bot Trade Engine (MK6 V1.2B) - Alerts & Visualization
Brought to you by Signal Lynx | Automation for the Night-Shift Nation 🌙
1. Executive Summary & Architecture
Gypsy Bot (MK6 V1.2B) is not merely a strategy; it is a massive, modular Trade Engine built specifically for the TradingView Pine Script V6 environment. While most tools rely on a single dominant indicator to generate signals, Gypsy Bot functions as a sophisticated Consensus Algorithm.
Note: This is the Indicator / Alerts version of the engine. It is designed for visual analysis and generating live alert signals for automation. If you wish to see Backtest data (Equity Curves, Drawdown, Profit Factors), please use the Strategy version of this script.
The engine calculates data from up to 12 distinct Technical Analysis Modules simultaneously on every bar closing. It aggregates these signals into a "Vote Count" and only fires a signal plot when a user-defined threshold of concurring signals is met. This "Voting System" acts as a noise filter, requiring multiple independent mathematical models—ranging from volume flow and momentum to cyclical harmonics and trend strength—to agree on market direction.
Beyond entries, Gypsy Bot features a proprietary Risk Management suite called the Dump Protection Team (DPT). This logic layer operates independently of the entry modules, specifically scanning for "Moon" (Parabolic) or "Nuke" (Crash) volatility events to signal forced exits, preserving capital during Black Swan events.
2. ⚠️ The Philosophy of "Curve Fitting" (Must Read)
One must be careful when applying Gypsy Bot to new pairs or charts.
To be fully transparent: Gypsy Bot is, by definition, a very advanced curve-fitting engine. Because it grants the user granular control over 12 modules, dozens of thresholds, and specific voting requirements, it is extremely easy to "over-fit" the data. You can easily toggle switches until the charts look perfect in hindsight, only to have the signals fail in live markets because they were tuned to historical noise rather than market structure.
To use this engine successfully:
Visual Verification: Do not just look for "green arrows." Look for signals that occur at logical market structure points.
Stability: Ensure signals are not flickering. This script uses closed-candle logic for key decisions to ensure that once a signal plots, it remains painted.
Regular Maintenance is Mandatory: Markets shift regimes (e.g., from Bull Trend to Crab Range). Gypsy Bot settings should be reviewed and adjusted at regular intervals to ensure the voting logic remains aligned with current market volatility.
Timeframe Recommendations:
Gypsy Bot is optimized for High Time Frame (HTF) trend following. It generally produces the most reliable results on charts ranging from 1-Hour to 12-Hours, with the 4-Hour timeframe historically serving as the "sweet spot" for most major cryptocurrency assets.
3. The Voting Mechanism: How Entries Are Generated
The heart of the Gypsy Bot engine is the ActivateOrders input (found in the "Order Signal Modifier" settings).
The engine constantly monitors the output of all enabled Modules.
Long Votes: GoLongCount
Short Votes: GoShortCount
If you have 10 Modules enabled, and you set ActivateOrders to 7:
The engine will ONLY plot a Buy Signal if 7 or more modules return a valid "Buy" signal on the same closed candle.
If only 6 modules agree, the signal is rejected.
4. Technical Deep Dive: The 12 Modules
Gypsy Bot allows you to toggle the following modules On/Off individually to suit the asset you are trading.
Module 1: Modified Slope Angle (MSA)
Logic: Calculates the geometric angle of a moving average relative to the timeline.
Function: Filters out "lazy" trends. A trend is only considered valid if the slope exceeds a specific steepness threshold.
Module 2: Correlation Trend Indicator (CTI)
Logic: Measures how closely the current price action correlates to a straight line (a perfect trend).
Function: Ensures that we are moving up with high statistical correlation, reducing fake-outs.
Module 3: Ehlers Roofing Filter
Logic: A spectral filter combining High-Pass (trend removal) and Super Smoother (noise removal).
Function: Isolates the "Roof" of price action to catch cyclical turning points before standard moving averages.
Module 4: Forecast Oscillator
Logic: Uses Linear Regression forecasting to predict where price "should" be relative to where it is.
Function: Signals when the regression trend flips. Offers "Aggressive" and "Conservative" calculation modes.
Module 5: Chandelier ATR Stop
Logic: A volatility-based trend follower that hangs a "leash" (ATR multiple) from extremes.
Function: Used as an entry filter. If price is above the Chandelier line, the trend is Bullish.
Module 6: Crypto Market Breadth (CMB)
Logic: Pulls data from multiple major tickers (BTC, ETH, and Perpetual Contracts).
Function: Calculates "Market Health." If Bitcoin is rising but the rest of the market is dumping, this module can veto a trade.
Module 7: Directional Index Convergence (DIC)
Logic: Analyzes the convergence/divergence between Fast and Slow Directional Movement indices.
Function: Identifies when trend strength is expanding.
Module 8: Market Thrust Indicator (MTI)
Logic: A volume-weighted breadth indicator using Advance/Decline and Volume data.
Function: One of the most powerful modules. Confirms that price movement is supported by actual volume flow. Recommended setting: "SSMA" (Super Smoother).
Module 9: Simple Ichimoku Cloud
Logic: Traditional Japanese trend analysis.
Function: Checks for a "Kumo Breakout." Price must be fully above/below the Cloud to confirm entry.
Module 10: Simple Harmonic Oscillator
Logic: Analyzes harmonic wave properties to detect cyclical tops and bottoms.
Function: Serves as a counter-trend or early-reversal detector.
Module 11: HSRS Compression / Super AO
Logic: Detects volatility compression (HSRS) or Momentum/Trend confluence (Super AO).
Function: Great for catching explosive moves resulting from consolidation.
Module 12: Fisher Transform (MTF)
Logic: Converts price data into a Gaussian normal distribution.
Function: Identifies extreme price deviations. Uses Multi-Timeframe (MTF) logic to ensure you aren't trading against the major trend.
5. Global Inhibitors (The Veto Power)
Even if 12 out of 12 modules vote "Buy," Gypsy Bot performs a final safety check using Global Inhibitors.
Bitcoin Halving Logic: Prevents trading during chaotic weeks surrounding Halving events (dates projected through 2040).
Miner Capitulation: Uses Hash Rate Ribbons to identify bearish regimes when miners are shutting down.
ADX Filter: Prevents trading in "Flat/Choppy" markets (Low ADX).
CryptoCap Trend: Checks the total Crypto Market Cap chart for broad market alignment.
6. Risk Management & The Dump Protection Team (DPT)
Even in this Indicator version, the RM logic runs to generate Exit Signals.
Dump Protection Team (DPT): Detects "Nuke" (Crash) or "Moon" (Pump) volatility signatures. If triggered, it plots an immediate Exit Signal (Yellow Plot).
Advanced Adaptive Trailing Stop (AATS): Dynamically tightens stops in low volatility ("Dungeon") and loosens them in high volatility ("Penthouse").
Staged Take Profits: Plots TP1, TP2, and TP3 events on the chart for visual confirmation or partial exit alerts.
7. Recommended Setup Guide
When applying Gypsy Bot to a new chart, follow this sequence:
Set Timeframe: 4 Hours (4H).
Tune DPT: Adjust "Dump/Moon Protection" inputs first. These filter out bad signals during high volatility.
Tune Module 8 (MTI): Experiment with the MA Type (SSMA is recommended).
Select Modules: Enable/Disable modules based on the asset's personality (Trending vs. Ranging).
Voting Threshold: Adjust ActivateOrders to filter out noise.
Alert Setup: Once visually satisfied, use the "Any Alert Function Call" option when creating an alert in TradingView to capture all Buy/Sell/Close events generated by the engine.
8. Technical Specs
Engine Version: Pine Script V6
Repainting: This indicator uses Closed Candle data for all Risk Management and Entry decisions. This ensures that signals do not vanish after the candle closes.
Visuals:
Blue Plot: Buy/Sell Signal.
Yellow Plot: Risk Management (RM) / DPT Close Signal.
Green/Lime/Olive Plots: Take Profit hits.
Disclaimer:
This script is a complex algorithmic tool for market analysis. Past performance is not indicative of future results. Cryptocurrency trading involves substantial risk of loss. Use this tool to assist your own decision-making, not to replace it.
9. About Signal Lynx
Automation for the Night-Shift Nation 🌙
Signal Lynx focuses on helping traders and developers bridge the gap between indicator logic and real-world automation. The same RM engine you see here powers multiple internal systems and templates, including other public scripts like the Super-AO Strategy with Advanced Risk Management.
We provide this code open source under the Mozilla Public License 2.0 (MPL-2.0) to:
Demonstrate how Adaptive Logic and structured Risk Management can outperform static, one-layer indicators
Give Pine Script users a battle-tested RM backbone they can reuse, remix, and extend
If you are looking to automate your TradingView strategies, route signals to exchanges, or simply want safer, smarter strategy structures, please keep Signal Lynx in your search.
License: Mozilla Public License 2.0 (Open Source).
If you make beneficial modifications, please consider releasing them back to the community so everyone can benefit.
