Trend-following Alert E v2.7 4HHi All,
Welcome to my third published Trend-following strategy for bitcoin, designed specifically for BITMEX:XBTUSD on 4H
This is an improvement of my second script (v2.6) to try and reduce 'chop' in consolidating ranges.
This script is the Alert script to use for settings up Alerts on Tradingview.
The accompanying strategy script and explanations/caveats you can find here:
In this script you will find the "active_long" and "active_long" variables (red and blue lines) that show which positions are being taken by the strategy script.
You can set 'Once per bar close' alerts for this to get your alerts on TV.
For instance, I use 'crossing up @ 0.1' on "active_long" to set an 'Open Long" alert and a 'crossing down @ 0.9' to set a 'Close Long' alert.
The same holds for the 'Open Short' and the 'Close Short' alerts but then for the 'active_short' variable.
I've also added start and end dates to test specific time periods.
Please let me know if you have any questions.
Recherche dans les scripts pour "bitcoin"

Bitcoin1% : High Leverage Indicator______________________________________________________________________________________________________________________
NOTE: Bitcoin1% is designed to work EXCLUSIVELY on BYBIT BTCUSD PERPETUAL CONTRACT chart on 1min TimeFrame on regular Candles
______________________________________________________________________________________________________________________
Bitcoin1% is a specialised indicator suite designed to catch 1% Bitcoin moves in either direction for High Leverage Trading.
Example: At 10x leverage catching 1% Bitcoin move will yield 10% profit
__________________________________________________________
Mechanism Of Action:
1. Identify trend: The script observers multiple parameters on higher timeframes to identify general trend & strength.
2. Take position: Once the trend is identified the script intends to take high probability positions for a 1% move in the direction of the trend. Currently there are 21 conditions that use bespoke datasets, along with conventional datasets like RSI , MA, VWAP to filter & identify high probability entries.
3. Take profits: There are total 4 conditions for exits. Partial Exit & Total Exit for both Longs & Shorts. Although we recommend you book profit at 1% change in price of BTCUSD these 4 conditions will offer high volatility exits along the way, should you choose to hold for longer.
4. Evolving: We learn from mistakes when they happen, bad trades are dissected & studied. New conditions get added & bad trades get filtered out through updates. This keeps the script in sync with the market.
__________________________________________________________
Insight: The script performs best in trending markets, so it avoids trading structureless or sideways movement & expects reasonable judgement on the user's part to avoid trading unusual & directionless market conditions.
Trading Mindset: When Bitcoin1% indicates a long trade, it basically says "BTC is more likely to move up 1% than go down 1% form here" : The script only indicates direction of the next 1% which is all you need for High Leverage Trading. You can set target & stop at 1% & try different variations with experience.
Have Questions? Feel free to PM me on TradingView

Performante's Average Bitcoin Volume IndicatorPerformante's Bitcoin Volume Indicator takes the volume from the biggest exchanges and plots the average volume.
Happy Trading!

Altcoin Bullphase"Altcoin Bullphase" is an indicator to check if altcoins are currently in a bullphase/altseason.
The indicator is checking if Bitcoin is above or below a certain type of Moving Average and paints the color of the candles on the chart and tradingpair of your choice either green or gray for above or below the Moving Average.
NOTE: You have to disable the border color of the candles or use grayscale to get the look from the preview.
Default setting is 20 week moving average as it has the best history of calling an altcoin season.
Altcoins generally do really well when Bitcoin is above the 20 week moving average and don't do well when it falls below.
This indicator makes it easy to compare the performance of altcoins in these different phases and helps deciding on the future trend of a coin.
This script works for any altcoin, currency or stocks. Even Oil if you like to do that.
You can choose the type of MA between SMA , SMMA , EMA , WMA and VWMA .
You can set a static timeframe from 4h, 1D, 3D and 1W.
You can set any MA from 20 to 200.

Cracking Cryptocurrency - Exponential Moving AveragesCracking Cryptocurrency - Exponential Moving Averages
This is the preferred EMA Indicator of Cracking Cryptocurrency Traders. We have based our statistical levels of support and resistance , trend, and momentum utilizing Fibonacci Numbers for our EMA inputs.
This script utilizes the Key Numbers of 8, 13, 21, 55, 100, and 200 as we have found those to work the best for Bitcoin and other Cryptocurrencies.
Features and Functions
Multi-Time Frame Function
Multiple Source Rendering
Multiple Smoothing Options
Adjust Look back Length
Plot Custom Signals
Multiple Time Frame Feature
Do you want to watch the EMA's of a higher or lower time frame while analyzing the price action of a different time frame? With this indicator, it's quite easy! Just select the desired Time Frame to display your EMA's and they will automatically change without affecting the price action you're currently looking at, or having to change your Time Frame Resolution. This has been upgraded and simplified with a drop-down menu for selecting your desired Time Frame.
Plot Crossovers
Want to keep it simple? Select Plot Crossovers and this script will display optimum times to buy and sell based on Trending Momentum utilizing your selected EMA crosses. Highly effective, back-test it and see!

Cracking Cryptocurrency - Quadrigo Position SizingCracking Cryptocurrency - Quadrigo Position Sizing
This indicator is designed to work in conjunction with our position sizing calculations pursuant to the Quadrigo Indicator.
This indicator will allow a trader to input their Account Balance and desired Risk % that they have decided, through their statistical analysis, provides them the greatest Return on Equity balanced against minimal draw down.
Once inputted, the Data Window will display the recommended USD Position Size. It will also pull the current price of Bitcoin, so that a recommended BTC Position Size will be calculated as well, making orders very easy to enter on exchanges that deal in BTC values for order value.
This indicator is optimized for the aesthetics of traders using TradingView's mobile app. With a simple glance you can determine your proper position size for any trade. This is helpful because the larger Quadrigo indicator can take up a lot of screen real estate when on mobile version.

[astropark] VWAP Crosses [alarms]Dear Followers,
today a new Swing and Scalping Strategy based on WVAP , mainly designed for Bitcoin and High-Cap Cryptocurrencies, like Ethereum. It works also on Forex and Stocks.
It works great since 15m and above till 1D. I suggest you to use it on 15m, 30m or 1h timeframes .
VWAP or "Volume Weighted Average Price" is a volume-based indicator similar to a moving average.
This trading indicator is used to identify market resistance and support levels and is represented as a weighted average price for the treaded volumes.
My strategy will help you identify main support-resistance level to be careful of and it will trigger a buy or a sell depending on how price will intereact with vwaps.
green means we are in a bullish trend, in fact it start with a "buy" signal
red means we are in a bearish trend, in fact it start with a "sell" signal
blue means we are in a moment where trend may change, so be careful and always remember that taking profits is awesome and have a stoploss is a must in trading
The user who wants to use this strategy, especially via an automated bot, must always set a stoploss (example 150$ from entry on bitcoin) or use a proper risk management strategy .
This is not the "Holy Grail", so use it with caution. It's highly suggested to use a proper money management .
This script will let you set all notifications you may need in order to be alerted on each triggered signals.
The one for backtesting purpose can be found here below:
This is a premium indicator , so send me a private message in order to get access to this script.

[astropark] Fair Value GapsDear Followers,
today a new epic tool, the "Fair Value Gap (FVG) Finder" .
Fair Value Gaps are quite important to trade, as they represent both volume and trading unfilled gaps, which most of the time are filled and then price reverse .
This indicator will let you set alerts on when a new FVG is found and when it is filled.
Traded together with Breaker Blocks (BB) and Supply/Demand Order Blocks (OB) , you can easily spot important points where to start a short or a long trade.
Here my Breaker Blocks (BB) and Supply/Demand Order Blocks (OB) indicator
Here below some examples on how to use the indicator.
On Bitcoin
On EURUSD

BTC Accumulation/Distribution ZonesAccumulate, when the price is in the green zone and distribute in the red zone. Use it on Bitcoin/Usd Bitstamp or Bitfinex preferably.
Right-click on the Y-axis and select "Scale to Price only" so the indicator doesn't mess up your scale. Enjoy!
Kai's Bitcoin Bull/Bear staircaseStaircase indicating a long term Bulltrend or a Beartrend
It is optimised for Bitcoin but can be used in any market.
Green = Bulltrend
Red = Beartrend
A crossover with price indicates a switch from bull to bear or vice versa. But one should also keep in mind previous support and resistance to reduce fakeouts.
Most of the time however this is very accurate and it indicates the start of a long term trend.
There is also an aggressive mode (default) or conservative mode setting.

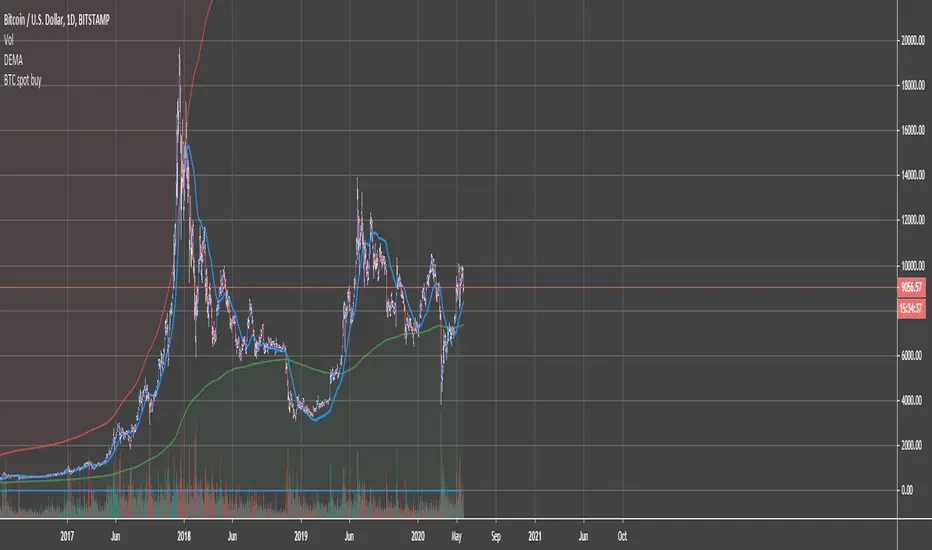
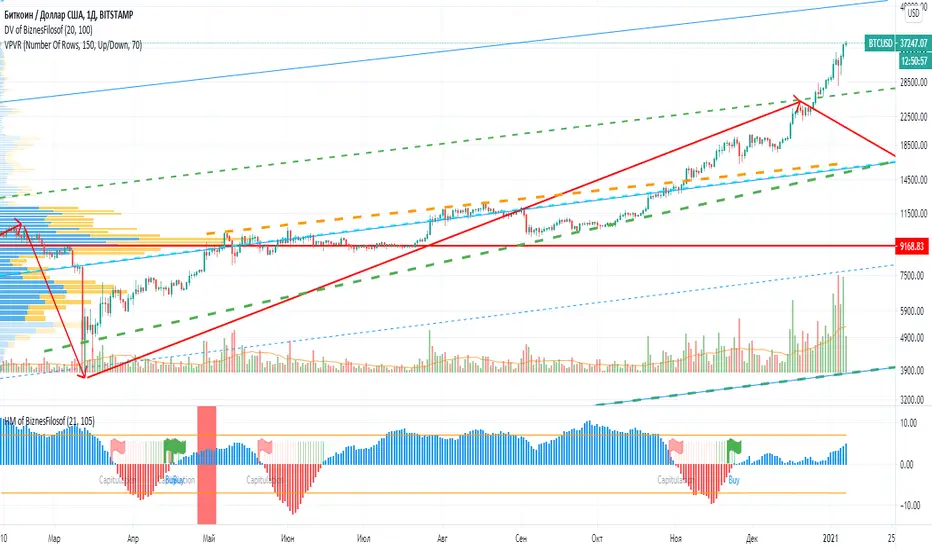
Hashrate Mining of BiznesFilosofIn addition to technical analysis, you also need to pay attention to fundamental analysis. Bitcoin has one of these indicators, it is the network hashrate. And it’s important to know when mining becomes disadvantageous. Those. when network participants turn off the equipment. And there are critical points that depend on the price and number of miners in the network.
When the blue bars of the indicator grow, then you can stand in long. When stools are reduced, then it is time to close positions or hedge risks in the derivatives market.
The vertical line indicates halving.
A red flag indicates a dangerous moment, and a green flag indicates the time of purchase.
The oscillator is based on fundamental indicators and the intersection of moving averages.
===
Кроме теханализа нужно ещё обращать внимание на фундаментальный анализ. У биткоина один из таких показателей, это хэшрейт сети. И важно зать, когда майнинг становится невыгоден. Т.е. когда участники сети отключают оборудование. И есть критические точки, зависящие от цены и количества майнеров в сети.
Когда синие столбики индикатора растут, тогда можно стоять в лонг. Когда столюики уменьшаются, тогда пора закрывать позиции или хеджировать риски на рынке деривативов.
Вертикальной линией обозначен халвинг.
Красный флаг показывает опасный момент, а зелёный флаг указывает на время покупок.
Осцилятор основан на фундаментальных показателях и пересечении скользящих средних.
Blockchain Data ~ FILBFILBOne Indicator with Blockchain info.
Total Circulating BTC
Number Of Transactions
Miners Revenue
Estimated Transaction Volume USD
Estimated Transaction Volume BTC
Bitcoin Market Cap
Difficulty

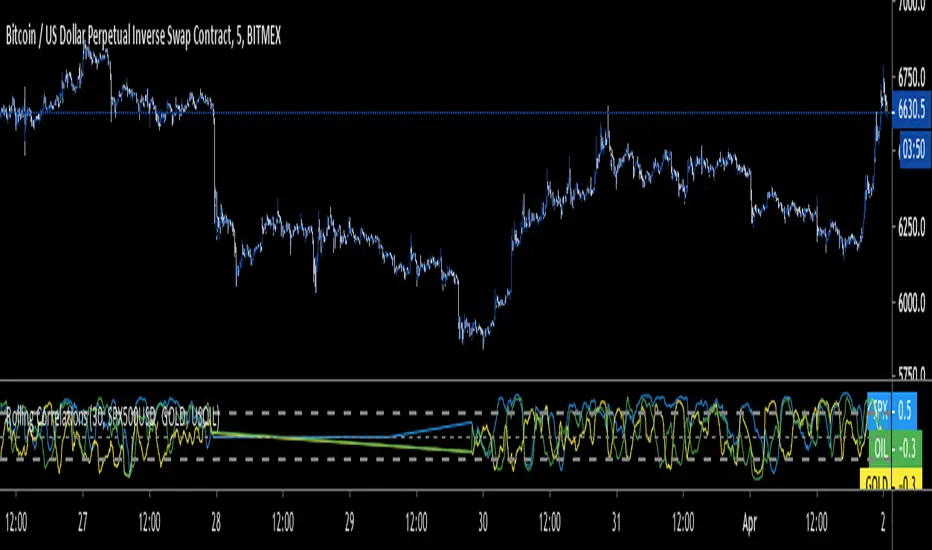
Rolling CorrelationsThis script calculates rolling correlations for up to 3 different assets at a time, compared to the main asset that is on the screen. Right now, it's best set up to use with Bitcoin and traditional assets. Created due to the recent high correlations.
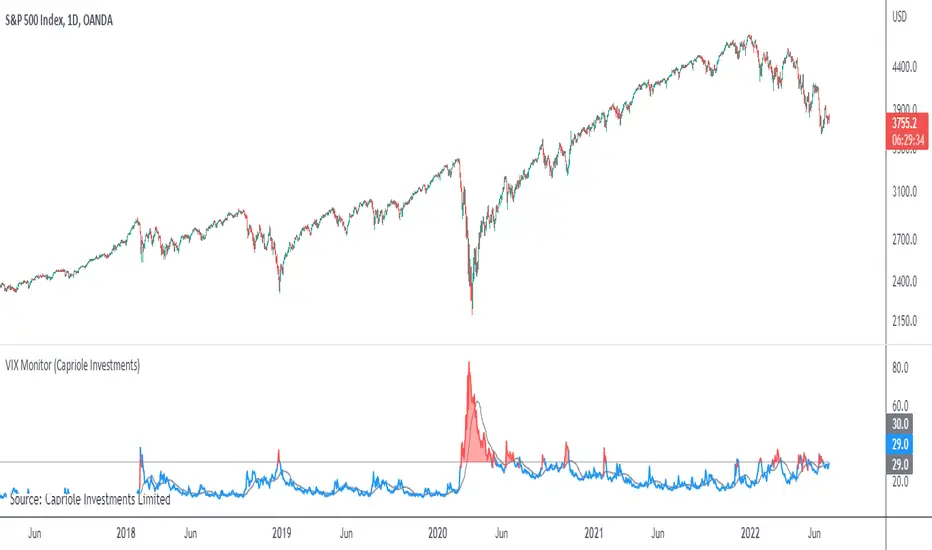
VIX MonitorSimple VIX Monitor to track spikes.
Spikes in VIX are often followed by big moves up in stocks.
Useful when paired with "Correlation & Beta" Indicator.
For Bitcoin Traders: when Bitcoin is highly correlated to Stocks (such as now) it could be a good opportunity for a short-term long trade.
One Shot Multiview Bitcoin vs Tether Compare by letsplayantsOne Shot Multiview Bitcoin vs Tether Compare is a reorganized index to understand the closing price of RSI and CCI of Bit and Tether at a glance.
One Shot Multiview Bitcoin vs Tether Compare 은 비트와 테더의 RSI 및 CCI 의 종가를 한눈에 파악할 수 있도록 재구성한 지표이다.

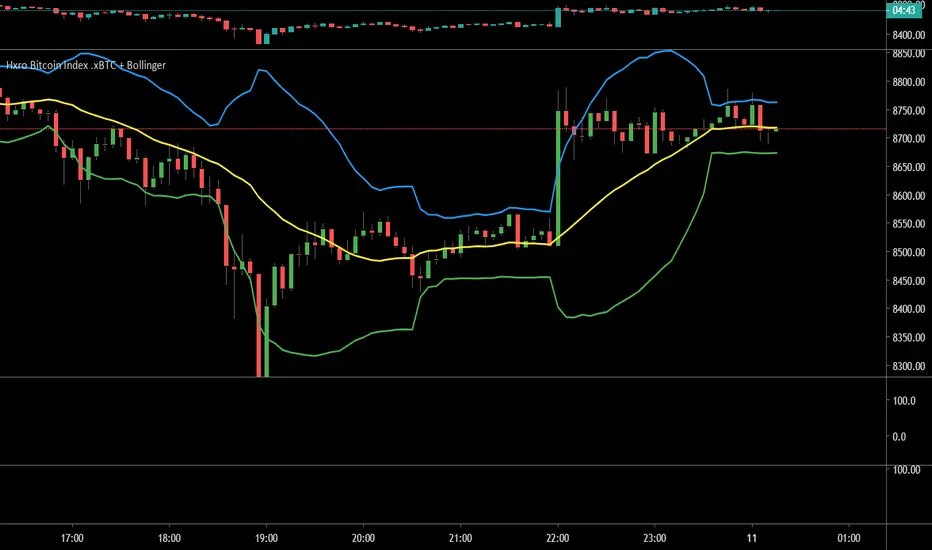
Wasabi Fear & Greed Index (FGI)Wasabi Bitcoin Fear & Greed Index (FGI)
This is Wasabi's Bitcoin FGI(Fear & Greed Index) indicator.
This indicates the market sentiment as a sentiment ratio of traders' fear or greed gauge.
The extreme fear may signal people are excessively worried. Vice versa for the extreme exuberance, euphoria or greed
It's been known to be a good strategy to buy at the extreme fear and sell at the extreme greed
A strong extreme index is normally followed by a significant opposite reaction, ie strong collapse or recovery.
The indicator may be used to provide smart and brave traders with great opportunities.
이 지표는 와사비의 비트코인 '공포와 탐욕' 인덱스(Fear & Greed Index) 지표입니다.
과도한 공포는 사람들이 과도하게 걱정하고 있다는 것을 나타내는 것일 수 있습니다. 과도한 탐욕의 경우는 반대이구요.
공포에 사서, 환희나 탐욕에 파는 것은 좋은 전략으로 알려져 있습니다.
강한 지수이후에는 강한 반대방향의 반응(즉, 강한 폭락이나 회복)이 나옵니다.
그래서, 이 지표는 과도한 환희에 주의하라는 붉은색표시가 되어있고, 과도한 공포에 오히려 매수기회라는 녹색표시를 하고 있습니다.
이 지표는 현명하고 용감한 트레이들에게 놀라운 기회를 제공하는데 사용될 수 있습니다.
저의 모든 지표는 무료입니다. 사용 문의는 채팅창으로 받지 않습니다.
대신, 아래 제 '프로파일 문구'에 기재되어 있는 외부 장소로 오셔서 관련 영상 댓글로 신청하셔야 합니다.

One Shot Multiview Bitcoin Compare by letsplayantsOne Shot Bitcoin Compare is a reconstructed indicator that allows you to see the closing prices of multiple exchanges at a glance.
Feature 1.
Calculate the exchange rate automatically.
Feature 2.
Support USD market and KRW market.
One Shot Bitcoin Compare은 여러 거래소의 종가를 한눈에 파악할 수 있도록 재구성한 지표이다.
특징1.
환율을 자동으로 계산한다.
특징2.
USD 마켓과 KRW 마켓을 지원한다.

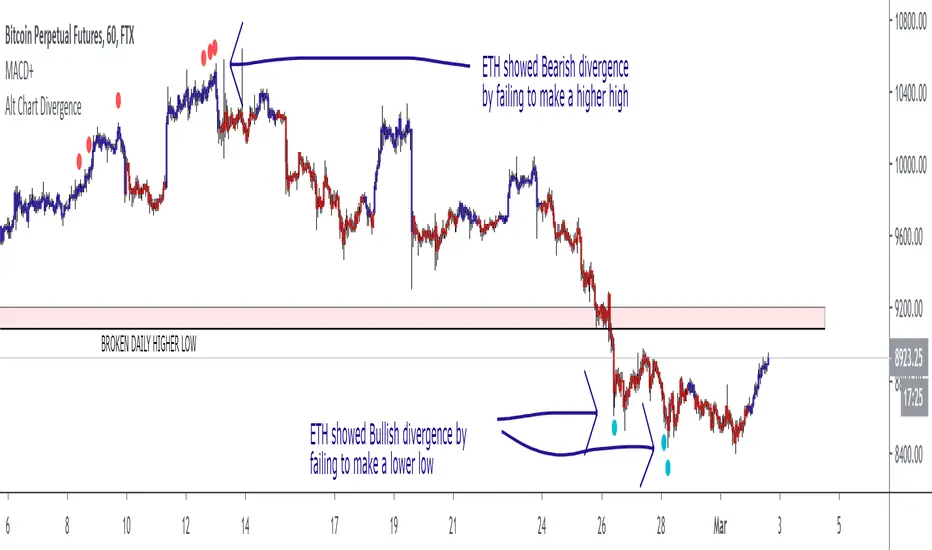
Alt Chart DivergenceThis script is designed to allow you to view bullish or bearish divergences between Bitcoin and ETH or an other alt of choice. However, you could also apply the idea in reverse or use it to look at chart comparisons such as DJI vs SPX or XAU vs XAG or UKOIL vs USOIL. Any alternate ticker can be used to plot divergences on the primary ticker treating the alternate chart as an indicator.
The design is very simple, just showing a dot for each case of bullish or bearish divergence.
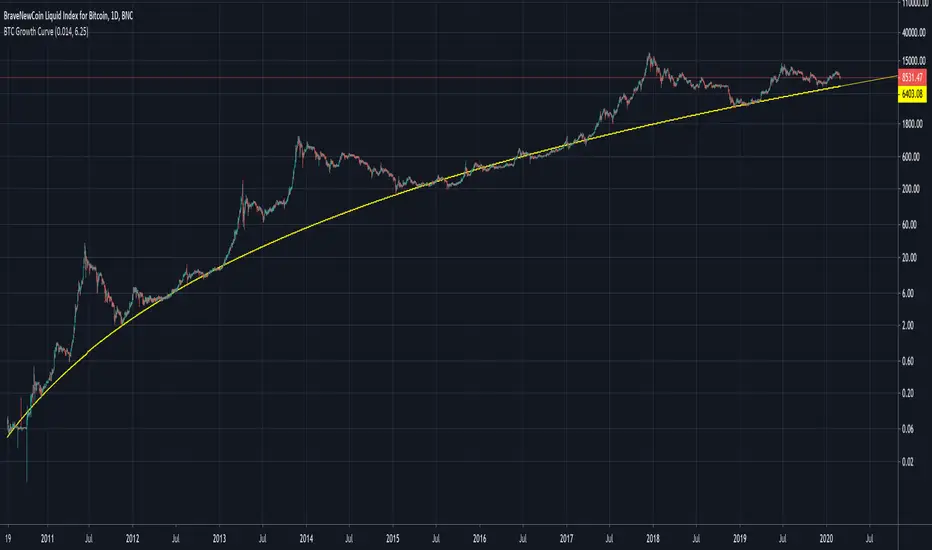
BTC Growth CurveA function which maps Bitcoin supply fundamentals to an estimated demand growth model via price.
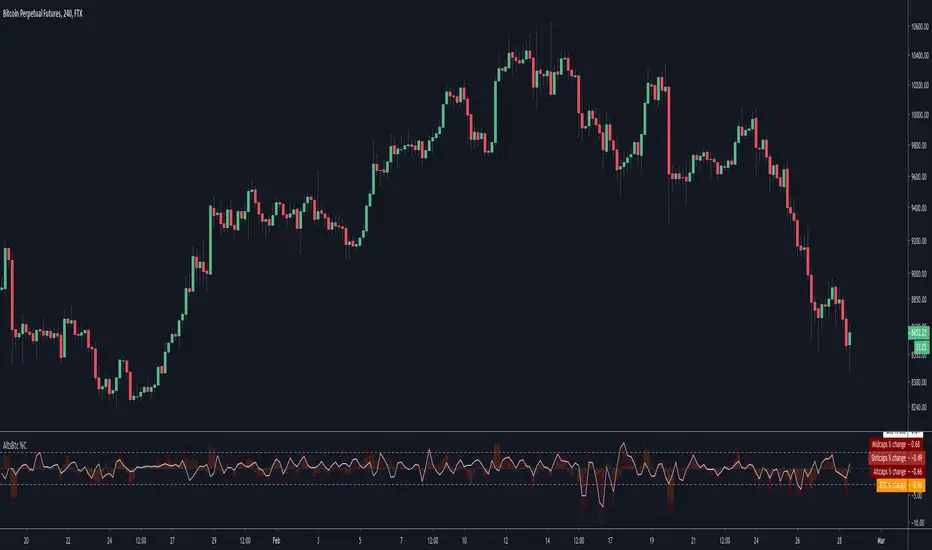
Alts vs Btc percentage changesCatch differences and over-corrections between Alts and Bitcoin via Ftx's indexes
A more visual description : i.imgur.com
Larsson AcademyThe L.A. Indicator supports:
- Trend trading (not range trading) of
- Tech assets, such as tech stocks and bitcoin/cryptocurrencies (not commodities) over
- Long timeframes, e.g. daily, weekly and monthly candles (not hourly candles or less).
By distilling all data down to one of 3 states, up, down or inconclusive, the indicator can aid in the decision making over long time periods, together with a rule based trading process. It works by measuring trend consistency.

GapGap
I've seen many trade decisions based on the CME Bitcoin Futures gap, so this indicator will let you know if that strategy is good or not, so use it as another confirmation 👍🏻.
- Shows when a gap is created, when it is filled and if not filled if a new gap is created.
- You can also use another security as a reference.
- Multi Timeframe , by default it will search the daily gaps.
