XBT swing-SCALPER-- with alerts-- COIN OBSFor backtested strategy:
This is the same strategy, with alerts for bots.
strategy takes much into consideration,
swings, rsi, mfi, with some safety nets.
For actual use, send me a DM.
Recherche dans les scripts pour "bitcoin"

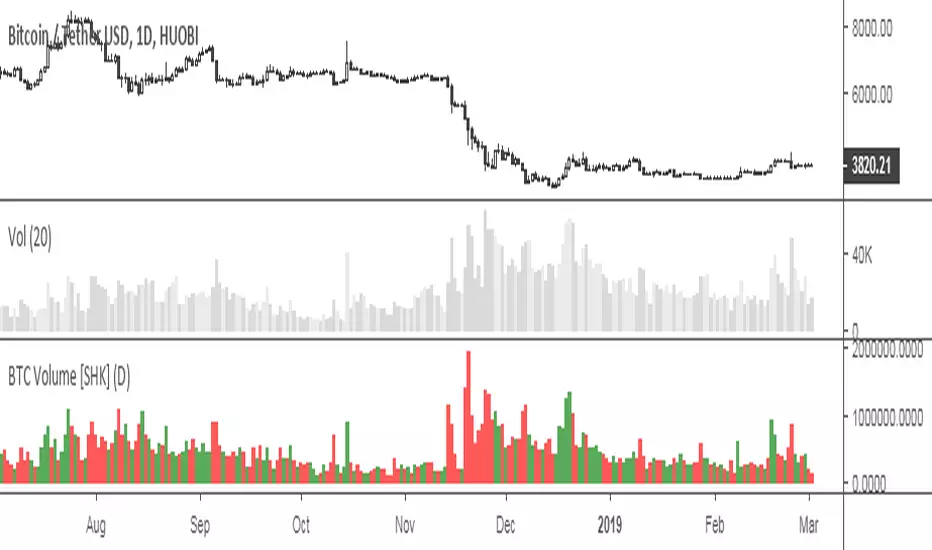
Total Volume for BTC or ETHBITMEX:ETHUSD BITSTAMP:BTCUSD Script includes cumulative Bitcoin volume from exchanges such as Binance, Bitfinex, Bithumb, Coinbase and more
As default, volume is shown based on the number of Bitcoin moved
If volume increases day over day the color will be blue, if it dereases the color will be red. This is not related to price
You can currently switch between ETH or BTC by putting those abbreviations in on the settings inputs
You can also switch to a USD output
You can remove Bitmex data as this exchange is highly leveraged contracts, default includes Bitmex data
Some delays in loading as the indicator pulls data from multiple exchanges
Future updates may include availability of other coins or additional exchanges added

BTC Exchanges Volume [SHK]Useful script to calculate sum of BTC ( Bitcoin ) volumes on different exchanges.
Supported Exchanges:
Coinbase
Bitfinex
Bitmex
Houbi
CEX
Bitstamp
Binance
BitFlyer
Poloniex
Bittrex
Flyer
OkEx
Poloniex
Gemini
HitBTC
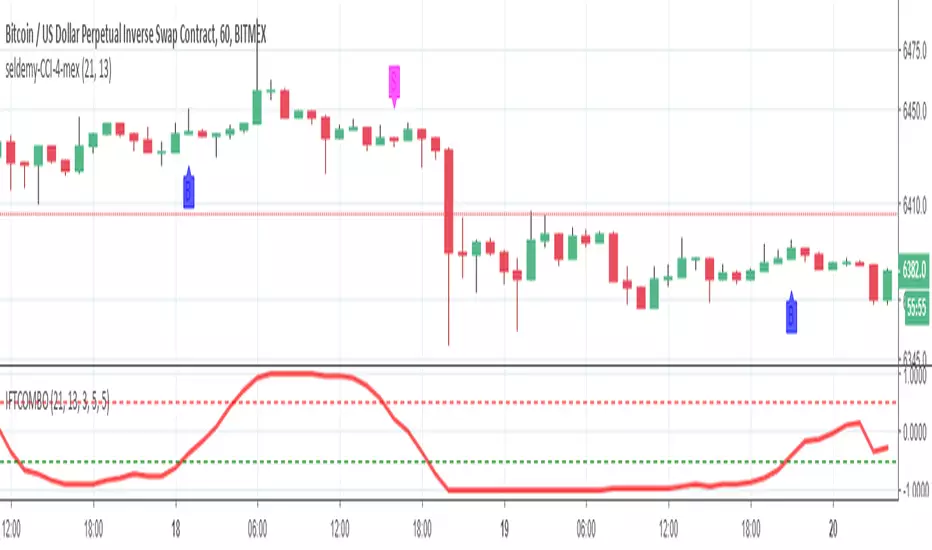
Seldemy-CCI-for-Auto4mexThis is the script I used in BITMEX for auto trading XBTUSD using great Chrome extension called Auto4mex . Default settings are good for 1h candle nowadays (September October 2018 period for Bitcoin). If more volatility comes adjusting needed. Enjoy !
MTF MTF Fibonacci H LinesA Multi-Time-Frame and Core Trading Indicator for my next Fibonacci bitBull Bitcoin Bot. It Automatically draws Support and Resistance from the Golden Ratios found in the Fibonacci sequence. Also plots a Zig-Zag from the Highs and Lows of the selected Time-frames. xbtusd bitmex futures

Bitmex BTC FuturesBitmex / Bitcoin indicator.
Just a simple overlay to visualise the contango / backwardation on Bitmex btc futures products so you know which to take position in, at a glance.
There are two selectable instruments (I have Dec18 and Mar19 selected already). By default the one with nearest settlement date is plotted with a filled coloured band from current price, the other plots a cross symbol.

Candles YK 3HR Bitcoin IndicatorUses too many things to describe, probably the closest thing to holy grail for Bitcoin 3 hour at higher volumes, (didn't wanna account for the consolidating retarded market)

Renko CandlesticksRenko charts are awesome . They reduce noise by only painting a brick on the chart when price moves by a specified amount up/down. When the price reverses, it must go twice the specified amount before a brick is painted. Time is not a factor, just price movement. Sometimes however, you want the pros of a renko chart, but on a regular candlestick chart. This indicator attempts to do just that.
A band is placed around price action showing the upper and lower bounds of what would be the current renko brick. The band only goes up/down when the price action itself moves up/down by the amount you specify. There are several ways of specifying the amount:
Fixed Price Amount: As the name says, you enter the brick size amount, i.e. the amount the price has to move before being in a new brick.
% of Price: This method will calculate the amount the price has to move as a percentage of the price itself. This way as price goes up/down, your brick size will adjust accordingly. Recommended values would be around 1% or less.
% of ATR: This option will make the brick size a percentage of the Average True Range. You can specify the ATR time frame to be different from your current time frame as well as the ATR length. For instance you could be on a 10 minute chart but specify the ATR to be daily with a length of 3 and a percentage amount of 15. This would make your brick size 15% of the Average True Range for the last 3 days. Recommended values are 10 to 20%.
Use this indicator on any time frame, even the 1 minute as the renko bands span the price action the same way on any time frame easily letting you know whether or not the price has moved appreciably, regardless of how much time has passed.
You can also set alerts easily, simply set the alert to crossing and choose “Renko Candlesticks” instead of “Value”. You will then see the options for the renko upper and lower bounds.
Tested on Bitcoin with the following values:
Fixed Price Amount: 30 ($30)
% of Price: 0.45 (if Bitcoin is $7000 then the brick size would be $31.50)
% of ATR: 15%, ATR Time Frame: 1D, ATR Length: 3 (3 days)

.BXBT Bitcoin Price Index for BitMEX - Gyro.BXBT script as seen on the BitMEX built-in chart.
This is not created by, authorized by or in any type of affiliation with BitMEX whatsoever.
This is not financial advice. Use at your own risk.
Tips are appreciated if you find this useful:
BTC: 15BtFGxY8Q4jybcnpVAc3r8yJDyRrPre1n
LTC: LhR5LW8qQ5byZvYkUeRR4njBDTxtCZynuk
Thanks

Combo Basic IndicatorsThe indicator consists of multiple time frame SMA and PSAR, the very basic indicator but could be profitable.
SMA can be used as dynamic Support-Resistant levels, and value of higher time frame are considered more significant (major level).
For example, Bitcoin currently has weekly support at 6568$, and regarding to SMA of lower time frame (Day, 4H,..) that are near then concluded as sideways condition.
However, trading opportunities still can be found for short term and tight range (scalping).

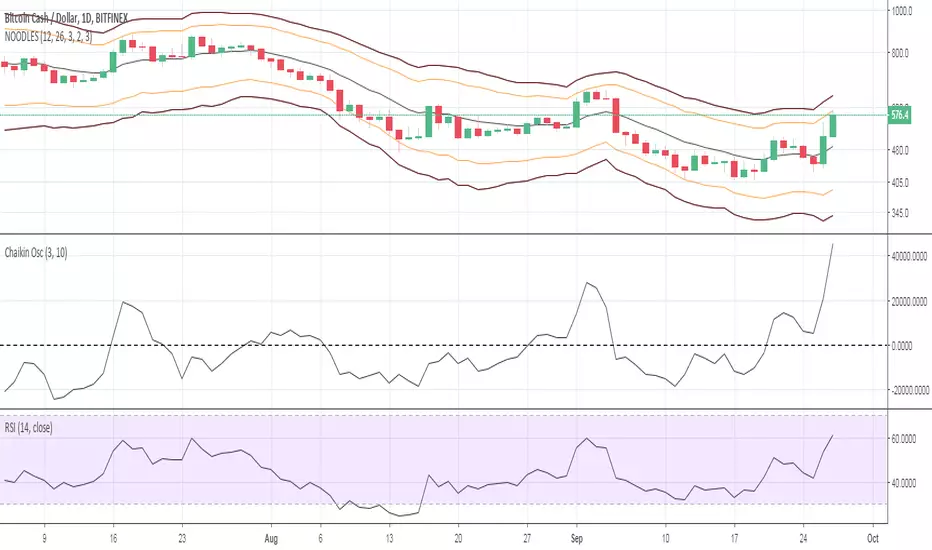
Noodles ema bands 12/26ema bands 12/26 for crypto trading, to find perfect support and resistance on each timeframe. 12/26 exponential moving average as you know is a perfect tool who working very well on bitcoin and others crypto. With this indicator now you have s/r too.
Librehash Balance of Power RSIThis indicator is known as the ‘Zero_n0ncense Balance of Power RSI Extremes’ and it is one of the more effective indicators that I have ever used (in terms of its predictive power).
The creation of this indicator relies on a few different principles.
Principle #1
At a base level, the Balance of Power indicator was used. This indicator is typically utilized in order to gauge underlying price sentiment. However, it does so in a way that is much more sensitive to future price movements than regular RSI is and the way that it tracks price movements makes it much more ‘predictive’ in nature than the RSI as well.
However, the main problem with the Balance of Power is that the regular indicator is fairly unreadable.
Below is an example of what the indicator looks like in live time:
As you can see above, the usefulness of this indicator is diluted significantly by the difficulty in interpreting the signals that the indicator produces.
Normally it oscillates between the values of 0 and 1, with 1 representing an extreme in buying power and 0 representing an extreme in selling power.
But, this is of no use in the way its presented because one cannot see the underlying trend in the data.
That’s where this indicator comes in.
Principle #2
We adjusted the Balance of Power so that we could track its momentum over time (hence the RSI portion of the name). We then overlaid an actual RSI chart behind it, using classical oversold and overbought markings in the same way that you would do with the regular RSI.
The chart is printed here once again for the benefit of the viewer.
Principle #3
Using additional indicators and algorithms, we were able to ‘smooth’ the Balance of Power while ‘re-scaling’ it to fit on a different scale (no longer 0 to 1), in order to create a much more readable trend.
In addition, we implemented the ‘red’ portion of the indicator in order to signal when the sell and buy pressure have reached an ‘extreme’.
Interpreting the Indicator
When the indicator is to the ‘north’ in the overbought category, that means that the indicator is signaling a ‘strong buy’.
When the indicator line turns red, however, in that overbought portion, that means that there is an impending downturn in the price that is to be expected soon.
Below, we will show some examples:
That same period is reflected in the price movement of Bitcoin as well:
As you can see from the pictures above, the red portion of the indicator was our warning that there would be an impending drop in the price.
It should also be noted that this indicator does not re-paint itself, so these signals are produced in live time.
Best Time Frames
The best time frame for this indicator is on the daily or longer. Using the H8 or longer is preferred.
This is because the price movements on lower time frames are usually substantially more volatile, and thus, the predictive abilities of this indicator are diluted to a certain extent on the lower time frames.
Product Offering
If you're interested in gaining access to this indicator, just shoot a private message over this platform and we can talk.

PROFITABLE BITCOIN TRADING STRATEGYIndicators:
Weis wave volume by LazyBear (4)
Heikin Ashi candles
useful for longs and exits.
Best applied on 4h - 1D charts.

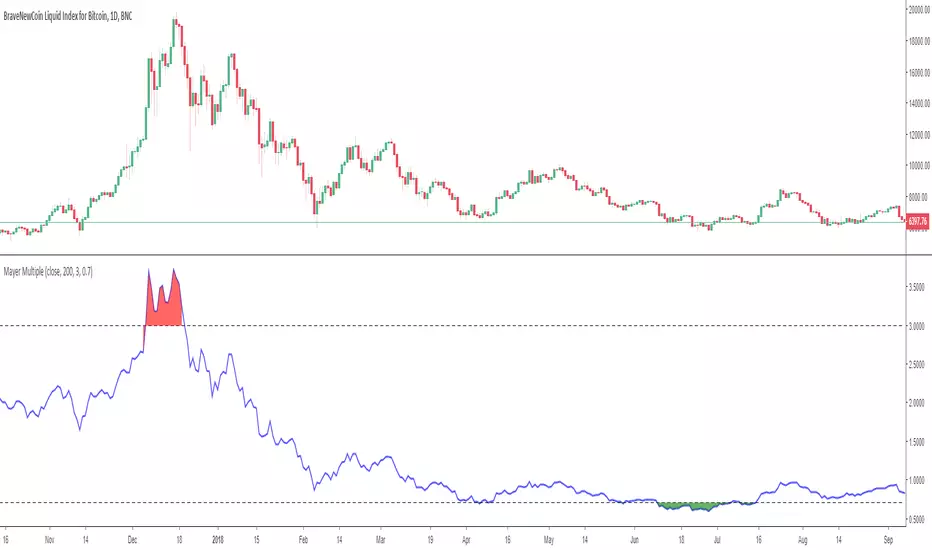
HSS Bitcoin Mayer MultipleIntroducing the Mayer Multiple script…the Mayer Multiple looks over extended periods of time and pinpoints when a cryptocurrency was overbought/sold. The calculation itself is simply the price of the cryptocurrency divided by the 200-day SMA. The default settings are based on Trace Mayer’s recommended numbers but can be adjusted to satisfy your own preferences.
So check it out – I hope you find it useful. As always, this indicator/script should not be taken as trading or financial advice of any kind; it should be used for educational purposes only.
Simba Bitcoin MomentumMaybe the best to trade Bitcoin on 1D!
Do you want to use it?
You can get access for one week free, after that, the weekly rental costs are 0.1 BTC. When you dont pay accurate the weekly subscription, you will be removed.
Write me an email to simba_cfd@protonmail.com when you want access.

B LAODA trend analysis 6.2Thank for JayRogers
1 hardly any repaint ,suggest 2 hour frame for bitcoin or use hekin ashi K line with 90 minute frame, suggest 1 Day or more for stock exchange

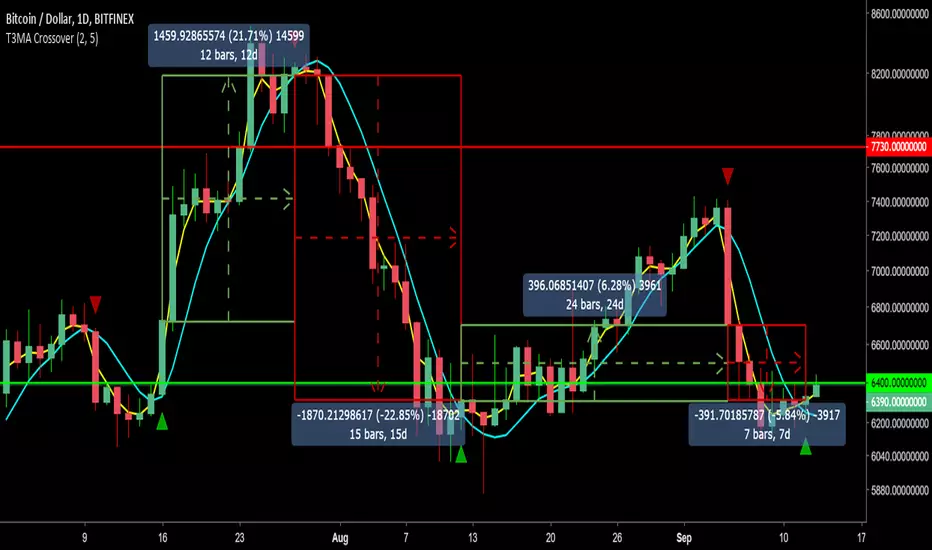
T3MA Crossover Strategy w/ Alerts v2.0Summary:
Using the T3MA formula developed by Tim Tillson, this differs from traditional SMA and EMA by providing a smoother curve and less lag. The smoothness is derived from the weighted sum of a single EMA through EMA 6 times.
How it works:
- Like any other crossover strategy.
- When fast MA crosses OVER the slow MA, go long.
- Close long and/or go short when the fast MA crosses UNDER the slow MA.
- Can keep flipping between long and short signals.
Quite a conservative strategy as it uses lagging indicators, not for intraday trading (you can, but I don't). Comes into it's own in trending markets as long as you stick to the signals.
Alert messages:
- Long
- Short
How I use it:
- My defaults are set at 2 fast MA and 5 slow MA to ride trends as close as possible.
- On BTCUSD and other altUSD pairs, I tend to use a daily time frame.
- On altBTC pairs, I tend to use a 12H time frame.
- Action on candle close at momentum confirmation (have seen numerous examples of a signal reversing mid candle into a dump).
Will need to be able to short altcoins to make the most of it, or it will at least keep you out of sustained downtrends (=/= holding).
Backtest it on bitcoin and other large cap alts on high time frames to see for yourself. For lazy trading, can set up alerts with AutoView.
0.1ETH for lifetime access. Message for details and support.
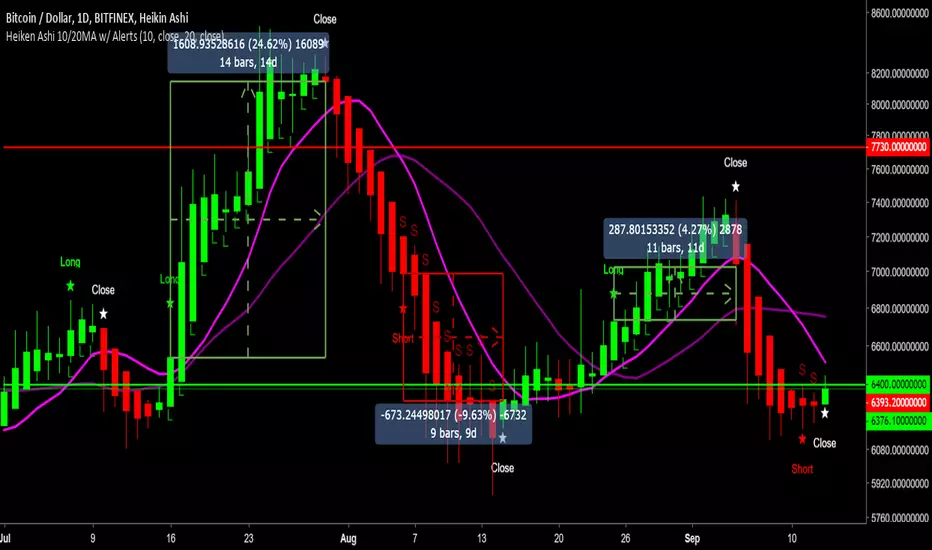
Heiken Ashi 10/20MA w/ Alerts v2.0Summary:
Using Heiken Ashi candles and default 10 and 20 Moving Averages for crossover signals to determine signals to go long, short and close trades.
How it works:
- Is the 10MA above the 20MA and a bullish candle? If yes, open a long.
- Will close the trade at the first bearish candle.
- Reverse this for going short.
- If you can't short, just close your long and hold till the next long signal.
Quite a conservative strategy, not for day trading. Comes into it's own in trending markets as long as you stick to the signals.
Alert messages:
- Long
- Short
- Close
Backtesting results:
XBTUSD = 85.9% (Bitmex)
LTCUSD = 75.6% (Bitfinex)
ETHUSD = 73.8% (Bitfinex)
NEOBTC = 83.9% (Binance)
TRXBTC = 79.4% (Binance)
EOSBTC = 88.1% (Binance)
Will need to be able to short altcoins to make the most of it, or at least will at least keep you out of sustained downtrends (=/= holding).
Backtest it on bitcoin and other large cap alts on high time frames to see for yourself. For lazy trading, can set up alerts with AutoView.
0.1ETH for lifetime access. Message for details and support.
Check out my other scripts.
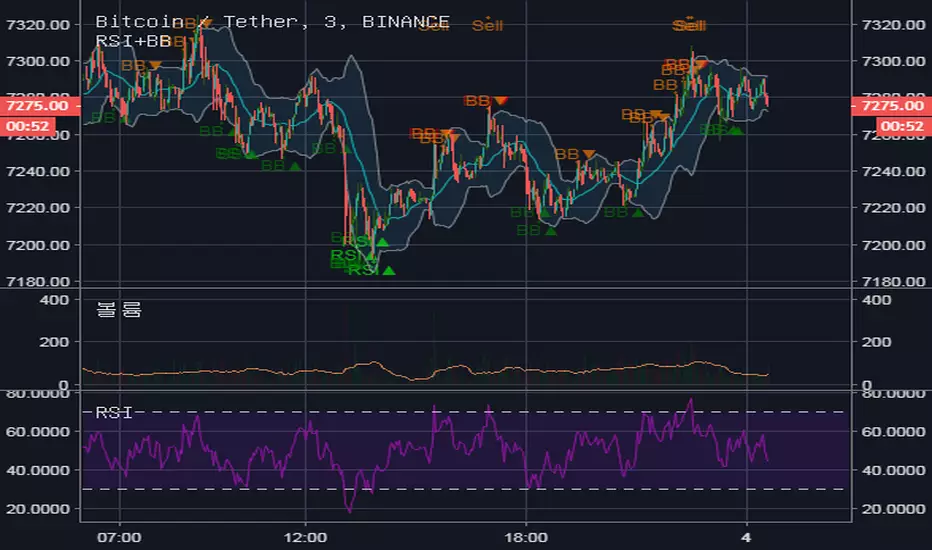
RSI & Bollinger Band Alerts Strategy for Bitcoin 10 Min TF ⓙRSI & Bollinger Band Alerts Strategy for Bitcoin 10 Minutes Time Frame ⓙ
비트코인 10분봉에서 RSI 30 상향 돌파, BB 하단 터치시에,
차트 바닥에 Buy 표시합니다.
반대의 경우 Sell 표시합니다. (하지만, 단타용입니다)
Heiken Ashi 10/20MA w/ AlertsHeiken Ashi 10/20MA script with alerts.
General premise:
- Is the 10MA above the 20MA and a bullish candle? If yes, open a long.
- Will close the trade at the first bearish candle.
- Reverse it for going short.
Quite a conservative strategy, not for day trading.
Alerts:
- Long
- Short
- Close
Will need to be able to short altcoins to make the most of it, but will at least keep you out of sustained downtrends.
Backtest it on bitcoin and other large cap alts on high time frames. For lazy trading, can set up alerts with AutoView.
Check out my other scripts.

Bithumb Ticker USD/BTC PairConverts Bithumb tickers into USD or bitcoin pairings from KRW.
This currently uses the FX pair to convert. There is an option to toggle between candlesticks and line.

Crack Bitcoin V1.1.1Features:
Bright & Dark theme option. Choose the type that you can see clearly.
Auto finds potential Buy & Sell point.
Compatible with all time ranges.
Best accuracy for daily charts.
Helpful for Crypto/Stock/Forex
Application:
The source of this indicator is protected now for safety.
I'll appoint several followers who are active under my published ideas to evaluate this indicator.
Getting Started:
1. Add this script to your chart.
2. Try to switch to short/medium/long time ranges to find signals.
3. When there are more than two periods reported the same buy/sell signals, it would be a trustful one.
Contributing:
You can report bugs or issues under this script publication page.
Any advice would be helpful for improving this indicator's accuracy.
