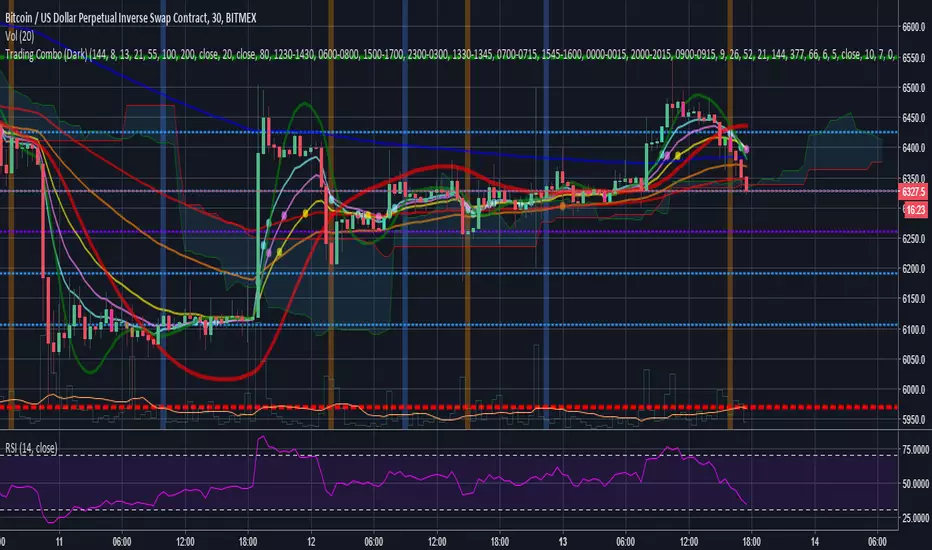
Trading Combo (Dark)This is a combo of many indicators including :
Ichimoku Cloud (With Buy and Sell Signals)
EMA
MA
HULL MA
Fibonacci Lines
Bitcoin 0.57% Kill Zones(Turned off by Default)
MA Turning Points
Reversal(Pin) Bars and Upshaved and Downshaved Bars(Inside and Outside Bars Disabled By default)
Credits to revanchdg for creating the script!
Credits for the source code go to:
Lazybear
ChrisMoody
100kiwi
Gesundheit
Updates:
- Removed all black colors so the script also works fine on the Dark theme
- Changed EMA9 to EMA8 and added EMA13
- Updated some labels for ease of configuration
Recherche dans les scripts pour "bitcoin"
Trading ComboThis is a combo of many indicators including :
Ichimoku Cloud(With Buy and Sell Signals)
EMA
MA
HULL MA
Fibonacci Lines
Bitcoin Kill Zones(Turned off by Default)
MA Turning Points
Reversal(Pin) Bars and Upshaved and Downshaved Bars(Inside and Outside Bars Disabled By default)
Credits to for the source code:
Lazybear
ChrisMoody
100kiwi
Gesundheit
Tersus Bollinger Bands Scalping Indicator V1.1Tersus Scalping Indicator
Tersus Scalping Indicator places buy and sell signals for Bitcoin in key areas using Bollinger Bands, Moving Averages, and Trend Analysis.
This indicator is very easy to use and makes for a great second opinion when trading.
The buy and sell positions are marked with B for buy and S for sell, in addition adds to position are market with red and green triangles.
The Bollinger Bands show general constriction and turn from red to green depending on market conditions. Red meaning bearish market, and green meaning bullish.
There are a number of lines all over the place and at first glance they can seem daunting. This is what they mean. The green and yellow dotted lines mark sell target stages 1 and 2, and buy target stages 1 and 2. The red dotted line is your buy and sell stop. The light blue is your buy and sell entry.
The candles also change color depending on if things are over sold or over bought using the Stochastic RSI. Purple for overbought and yellow/orange for oversold. The bars will also change to light blue during entry.
This should be limited to the 15 minute time frame for now. I have noticed some very good signals on the daily and some other time frames but this was written for 15 so don't expect it to be as accurate.
For purchasing information please direct message me.

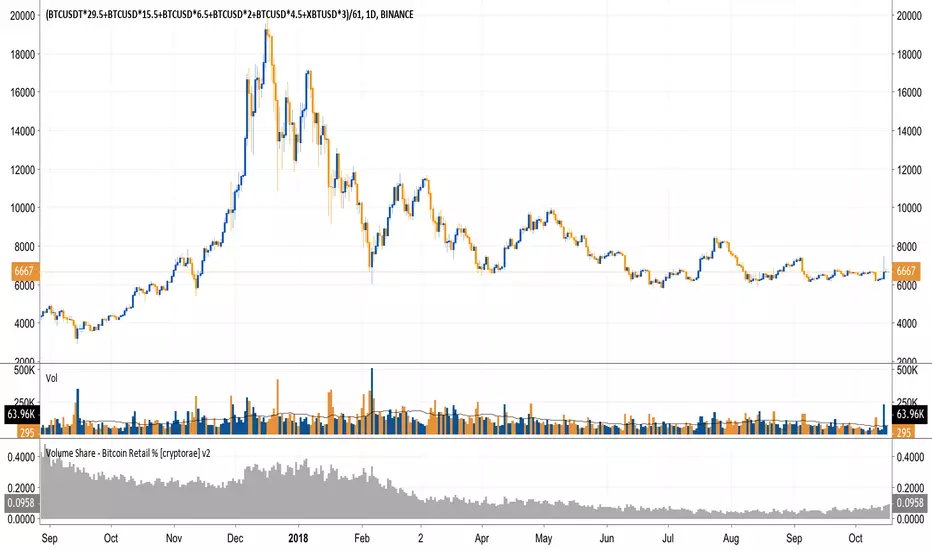
Volume Share - Bitcoin Retail % [cryptorae]I've been keeping my eyes on retail BTC trading volume as a % of total BTC trading volume (charted).
It's the single best chart showing the death of sentiment in this bear market. Retail fell to as low as 5.6% on 6/8. The good news is that the % has stabilized at these levels.
I think retail interest will need to trend higher in tandem with higher price moves for us to break through key resistance levels.
To know why, let's look closer at the anatomy of the recent bull and bear market.
In the 2017 bull market:
- Retail interest trended higher or sideways with each drive up
- Average retail volume share was ~46%
In other words, price movements were dominated by infusions of new money.
In the 2018 bear market:
- Retail interest trended LOWER with each recovery in price
- Average retail volume share was ~15%
In other words, price movements were dominated by money exchanging through the hands of traders.
Open thoughts:
- If the bear market persists and prices reach critical levels, I think that retail % would spike as some finally rush for the exit and new investors happily jump in
- If prices recover w/o a sustained increase in retail %, I'd not be so quick to call a bull market
Things I classify as "retail":
- Bitflyer
- Bithumb
- Coinbase
- Bistamp
- Kraken
Things classified as "non-retail"
- Bitmex
- Bitfinex
The formula is retail / (retail + non-retail)
The script is open for you to modify if you disagree. Let me know your thoughts/tweaks.
GBTC Premium to NAV IndicatorWhen bitcoin is in an uptrend, a very profitable strategy is to buy GBTC when premium to NAV is low, and sell when it reaches extremes. This can be far more profitable than buying bitcoin itself.
SignalToSignal.com Volume Trend AdvisorThe Signal to Signal Volume Trend Advisor is a proprietary volume and priced-based trend predictor. Leveraging over 20 years of volume-price trading and systems development, we utilize proprietary Volume Spread Analysis ( VSA ) concepts and internal market dynamics to alert you visually and in real time of an imminent trend change.
The indicator was developed to keep autonomous trading systems on track while a trader is away from their charts. While it is meant to be used in conjunction with other trading systems and methods as a filter or as confluence, VTA also stands strongly on its own.
The trend analysis algorithm indicates trend changes visually and in realtime based on static, non-lagging market information. This means that the Volume Trend Advisor does not and cannot repaint, ensuring any signal received is valid and actionable.
Large moves are captured and even trades that result in a small loss when taken to the next signal generally move some significant amount in the direction of the signal, meaning that given proper trade management, even a failed trend can still be profitable.
Because the indicator works using volume and price data, the Volume Trend Advisor works well on any chart. We personally use the indicator to successfully trade Stocks, Forex, Commodities, and Crypto Charts such as Bitcoin ( BTC ).
To gain access to the Volume Trend Advisor, please visit our website - signaltosignal.com
If you have any questions, please contact us through the Contact link on our website - signaltosignal.com

Tools of the Taint V2Tools of the Taint provides you with most of what you need trading cryptocurrency in terms of chart overlays.
INCLUDED:
--Bitmex XBT Price
--Bitfinex Spot Sentiment (Longs v. Shorts
--SMA, EMA, VWMA, TEMA, and HMA averaging options with 50, 100, 200 preset
--Faster moving average ribbon with multiple average choices
--VWAP and VWAP moving averages
--Ichimoku Cloud with Cryptocurrency presets
--Bollinger Bands with multiple average choices
TIPS:
-- For Bitmex price, turn on "indicator values" right right-clicking the scale, check "priceline" in settings, and decrease transparency in settings. This will show
the price on the scale.
--For Bitfinex spot, due to pinescript's limitations, there is no way to properly scale Longs v. Shorts. To remedy this, I have added a scaling option. Using this
divides the price by the given value. Adjust this number until this indicator no longer causes scaling issues on your chart. For bitcoin, 3 or 4 is a good value.
Keep in mind, by scaling you will be dividing the actual number of longs or shorts by the scaling value. This does nothing to visual compassion between the
two but it does alter the actual number value. Example: Actual number of longs or shorts = (current long or short value) x (scaling value)
--For Bitmex prices or Bitfinex spot, to change from XBT or Bitcoin, simply change the ending of the text area to the pair of your choosing. Check how
Trading View has it listed. Example: Change text to BITFINEX:EOSUSDLONGS for EOS.
--When choosing a moving average type, use only lower case letters.
--To turn off the ribbon fill for the 4th and 5th ma, go to settings and uncheck that box.
I will be making additions to this at a later date. If you have requests, leave them in the comment section.

Traders Dynamic Index Pro by YardleyRosetteThis is an excellent indicator thanks to the code author LazyBear!
I have modified to a more appealing colors visually representing market condition.
2 Backgrounds
Uptrend/Sell: Uptrend above Orange line, Sell potential area.
Downtrend/Buy: Downtrend under Orange line, Buy potential area.
I have modified by adding previously unrecognized upper and lower channels of support/resistance zones within Traders Dynamic Index which will be of great use in previously confusing situations.
The Traders Dynamic Index, observes trend direction , market strength , and market volatility .
To be used by the "elite", the Pro accounts.
Multiple Time Frames are ABSOLUTELY required. I'm sorry for those who aren't. I can refer you who don't, to try out KK_Traders Dynamic Index Higher Timeframe (by Kurbelklaus).
Multiple Time Frames are necessary or else technical analysis using this one chart alone will give false reasoning as I have witnessed a few who do attempt to use this time machine, including me when I had not used multiple time frame charts since I did not have the PRO account.
Problems, for example low time frame indicates 'overbought' yet higher time frame indicates it had been oversold. Which are you to agree with? The higher time frame absolutely.
In this condition though an overall retracement will very likely occur in the short-term.
Here is my clever explanation of the rules:
Use of time frames: Traders' choice of combination.
For example, 180, 90, and 45 minute charts may be useful for example with Bitcoin
You can see what may confuse others. Apparently rising as a buy signal for having green line cross up from below orange line, but 90 minute time frame thanks to this support/ resistance channel coded within T.D.I. can be observed as an alerting condition. Then observing 45 minute time frame notice the blue lines ("Bands") are 'squeezing' the other components you can then expect a breakout , and if its in the overbought side, at least above 56, and the 240 time frame can identify current downtrend... you know how to connect the data given by the charts: Ranging Overbought in a downtrend will breakout. 1) Overbought in downtrend: Sell, 2) Ranging to breakout, set entry order according to pattern. With probability on your side, you can set a sell stop under the tricky uptrend line when all others are wondering what will happen, you are ahead.
According to range scalping: Great Scalping
Only if orange (MBL) line steady within upper and lower midlines 40 and 60
Long, when green and red line are under 44 with green crossing over red.
The green line is above the red line
The green line is above the orange line
Short, when green and red line are above 56 with red crossing over green.
The green line is below the red line
The green line is below the orange line
Close when opposite signal is about to occur

C320up RSI Compare X2C320up RSI Compare X2
- Compare the strength of any two securities at once including Bitcoin and EOS shorts and longs.
Simply click on the Ticker Input, type the first letter or two of the security you wish to compare then select from the list.
All tickers listed on TradingView are available.
Default settings are a black line for the first ticker (Bitcoin), and gray for the second (EOS), with the RSI length set at 14.
You can change these colours to suit your preferences.
For example, let’s say you wanted to compare EOS shorts and longs, search for EOSUSDSHORTS and EOSUSDLONGS, and change the colour of the first line to red for shorts, and change the second to green for longs.
You can also change the background colour, and adjust the 70% and 30% lines to suit.
Any questions, just leave a comment.
Check out our scripts page for more indicators.
Happy Trading!

CryptoShadows V1The first Diagonal Support and Resistance indicator. Best for bitcoin and cryptocurrencies

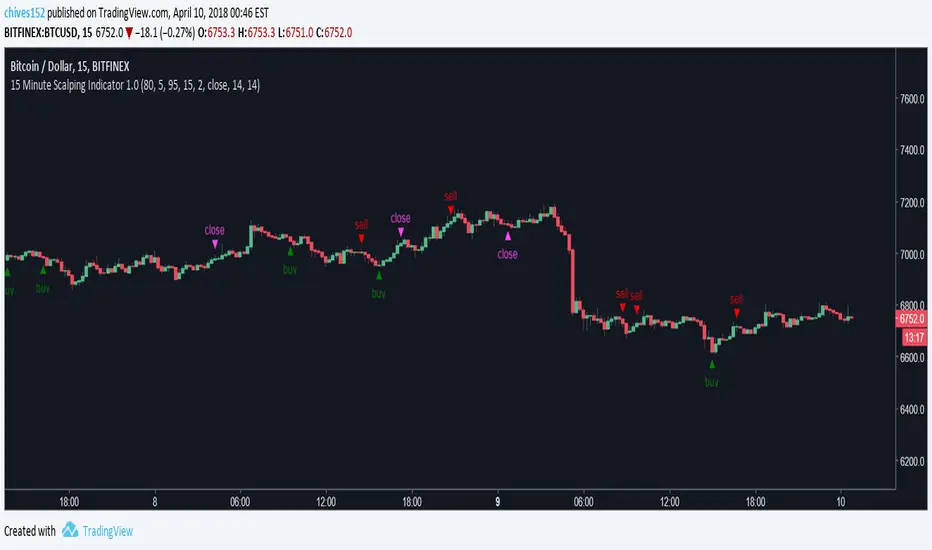
15 Minute Bitcoin Indicator 1.0Indicator Description:
This is a premium indicator that is intended for trading on the 15 minute time scale. This script uses ADX to judge the strength of trends. When a trend is confirmed by ADX, the indicator uses SRSI to find the optimal entry. The indicator works best on BITFINEX:BTCUSD .
Instructions:
Whenever there is a sell signal exit the current long and vice versa. If a close signal appears close the current position but do not open another trade in opposite direction. There is a indicator based stop loss system that is built into the signals, but no static stop loss based on % loss or pips moved in one direction.
Available Settings :
1. Buying and Selling Thresholds: These are the values that are used with SRSI to determine entries. The default values were experimentally determined
to be the most profitable.
2. Stacked Orders Allowed: This limits the amount of positions that can be entered in the same direction. This is useful for trading with leverage. This is defaulted to 2 because I limit myself to 2x leverage. Backtesting shows the more orders allowed, the more profitable, but also risk is increased.
3. ADX/DI Settings: These are settings the ADX smoothing and DI length.
Backtesting:
CLICK HERE
This is a strategy that enters and exits positions on the exact same criteria as this indicator. For the simulation the capital was 10,000 dollars and it was allowed to go up to 2x leverage. Each trade used 100% of available funds. The same simulation done from 1/1/2018 to 4/10/2018 resulted in:
3658.38 % Net Profit
316 Total Closed Trades
77.22 % Profitable
4.552 Profit Factor
24 % Max Drawdown
+11.58% Average Trade
20 15m candles in each trade on average.
Future Plans:
More robust stop loss system.
Factoring trend into trading signals.
EMA integration.
MULTI-TIMEFRAME SUPPORT
Availability
This indicator is currently in a testing stage of development with a full release planned for mid April. While the indicator is not completed, it currently is profitable for me to consider it ready for release. During this testing phase anyone can test it for free for three days, just comment below. Lifetime access currently costs .005 btc, and this price will increase once the full release occurs, if you are interested, DM me for further details.
Please comment with any ideas, suggestions, or criticisms.

Custom Time ranges
Description:
This script colours the background of any time range you specify, including weekend periods.
It can be useful for spotting patterns on Bitcoin (recurring times of buying or selling).
Checkboxes to switch on and off. Inputs to specify time and day of week.
Monday = 2
Tuesday = 3
Wednesday = 4
Thursday = 5
Friday = 6
Saturday = 7
Sunday = 1
Example 1:
1500-1800:2
This will colour the background between 3pm and 6pm on Mondays.
Example 2:
0000-0600:247
This will colour the background between midnight and 6am on Mondays, Wednesdays, and Saturdays.
Any questions you may have, please leave in comments below and I'll respond when I have time.

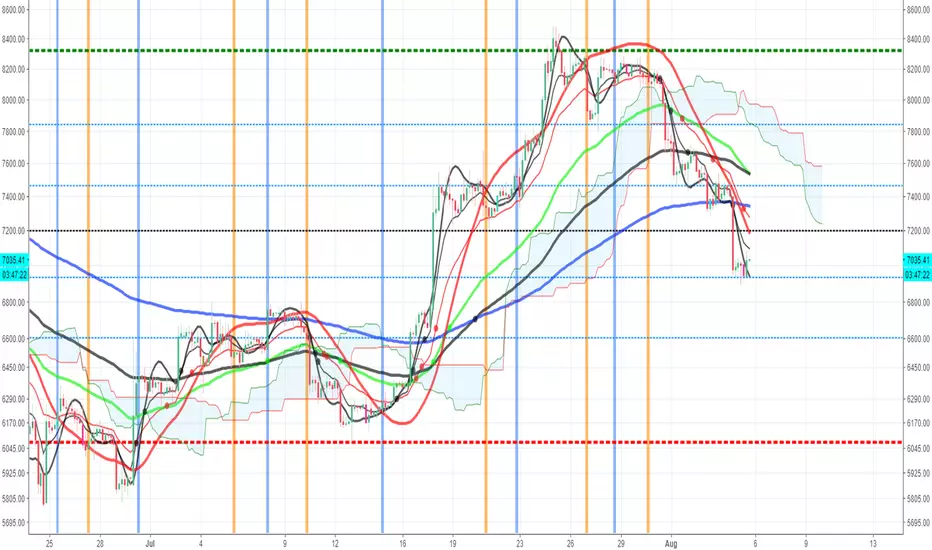
Rainbow RoadRainbow Road allows you to visualise the price in relation to the barriers of support and resistance that are the moving averages. The price can be observed breaking above barriers , or falling below them.
Rainbow Road displays these bands like a ribbon so that the strength or weakness of a security such as Bitcoin, can be observed in a very vibrant and obvious fashion.
The name "Rainbow Road" is inspired by the final course of the Special Cup featured in all Mario Kart games and is the climactic course of each game it appears.
.,-'"*.,-'"*Housekeeping*"'-,.*"'-,.
In order for you to make your chart look exactly like this one when you apply the Rainbow Road indicator, you will need to follow these simple steps.
1. Right click on your chart -> Price Scale -> Undo Indicator Labels
2. Right click on your chart -> Price Scale -> Undo Indicator Last Value
3. Right click on your chart -> Color Theme -> Black
4. Right click on your chart -> Properties -> Background -> Vert Grid Lines -> Slide transparency bar -> Horz Grid Lines -> Slide transparency bar
@#$%@#$%@#$%@#$%@#$%@#$%@#$%@#$%@#$%@#$%@#$%@#$%@#$%@#$%@#$%@#$%@#$%@#$%@#$%@#$%@%
I appreciate the feedback of all of my followers!
Like and follow for more awesome indicators!

min_Crypto_Thesis_indicator_MoriceauThis indicator is for minute candlestick and this back test work perfectly with Bitcoin and Gold.
The indicator tells you when you need to buy and sell your position. The backtest work at 86% of the last year.

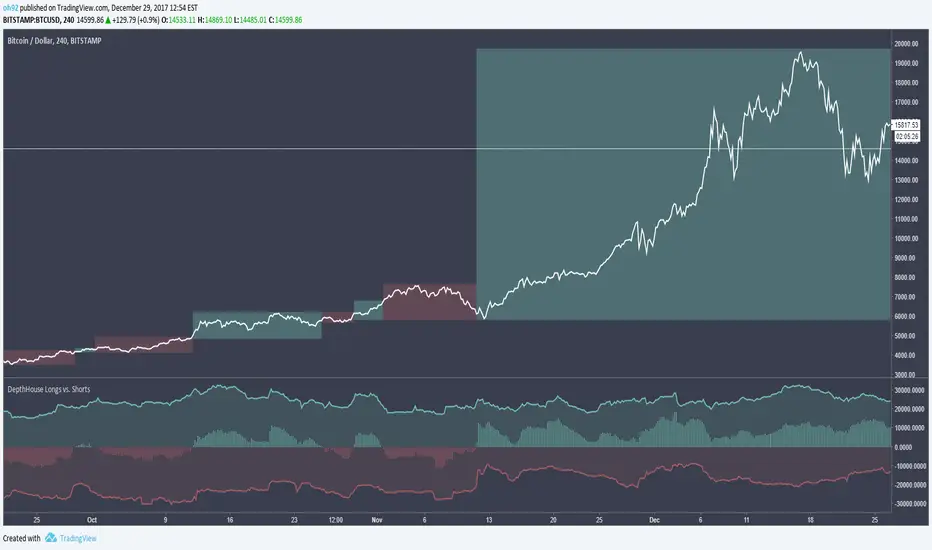
DepthHouse - BTC Longs vs. ShortsDepthHouse - Longs vs. Shorts is a FREE INDICATOR
A very simple indicator that measures the number of Bitcoin Longs and Shorts active in the market.
To help keep these FREE indicators coming:
Please like and comment!
Check out my channel on YouTube! youtu.be
Bitcoin and Ethereum Donations are always appreciated :)
BTC: 1MLnVPqebcFTqYEVAKm9dSCRWhyNDmAb5W
ETH: 0xEEcD7Ce6E22AfA6083074c4CCd326Be0b1C932d9
What it is used for:
This is a great tool to help determine market sentiment.
As you can see, so far it has proven to be very accurate.
However, I do advise caution because this cannot take into count cash trades.
Hope you enjoy!
Cryptotutor CrossThe cryptotutors cross is a lagging indicator that can help detect a change in the trend. For example, it can help detecting an upwards or downwards movement of Bitcoin (on 1H), which can save you a lot of money when you are in altcoins.

Estimate exchange/broker fee commission from trade volumeThis script is used to estimate how much an exchange/broker makes off a particular pair/symbol. If Coinbase(GDAX) has a 0.25% taker fee and a 0.15% maker fee per trade and you estimate the average commission fee at 0.19% then you simple input that, and how many periods you'd like to know the total fee for (30 periods on the 1 day chart = last 30 days, 28 periods on 4 hour chart = last 7 days, etc).
This is for broad estimates of a single pair and only works well on exchanges that show only the volume on that exchange (stock markets may be less useful for this tool).
THIS TOOL IS TO PROVIDE A BROAD ESTIMATE , NOT AN EXACT FIGURE!
// percentage fee rate is entered as a percent: 3.5=3.5%, not 350%.
// pbtc , the one for calculating the USD value of fees that are in bitcoin, uses the price at time fees were realized. IE chart is on
// 1 day interval and XBARFEE is set at 4, then PBTC gives the USD value as if the exchange sold all btc at the end of each day for
// 4 days. i.e.:
// Day 1: BTCUSD= $5000 fees=1.5, Day 2: BTCUSD = $5000 fees=3.0, Day 3 BTCUSD = $10,000 fees=1.0, Day 4 BTCUSD = $20,000 fees=1.0
// PBTC would NOT show (1.5+ 3 + 1 + 1) = 6.5 * $20k = $130,000. It would do: (1.5*5000)+(3*5000)... = $52,500.

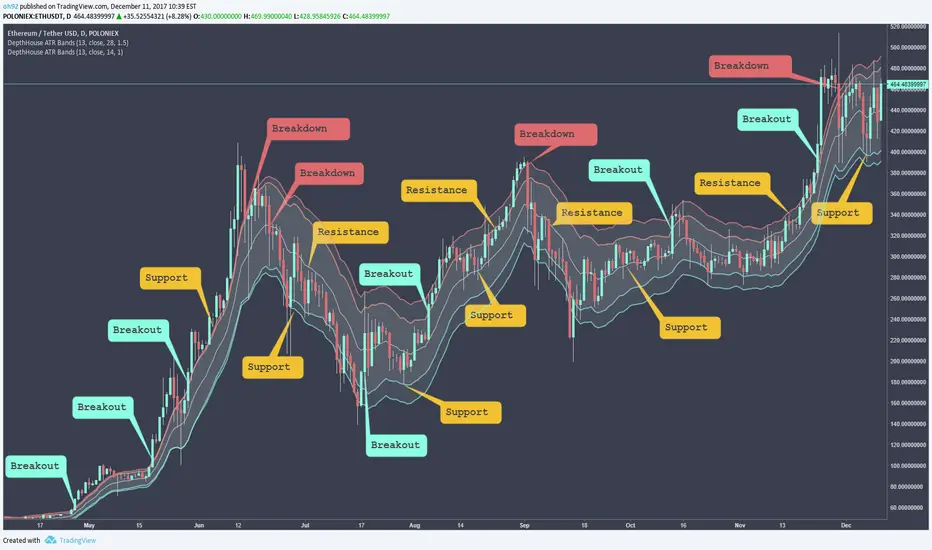
DepthHouse - ATR BandsDepthHouse ATR Bands is a FREE INDICATOR
Similar to the well-known Bollinger Bands.
Instead of using the standard deviation formula, ATR Bands determines the size of the bands based on the adjustable average range.
IF you use this FREE Indicator:
Please like and comment!
Check out my channel on YouTube! youtu.be
Bitcoin and Ethereum Donations are always appreciated :)
BTC : 1MLnVPqebcFTqYEVAKm9dSCRWhyNDmAb5W
ETH : 0xEEcD7Ce6E22AfA6083074c4CCd326Be0b1C932d9
How to use:
The bands tighten while the markets’ range becomes lower, and widens as its' range becomes broader. Giving the indicator a loaded spring effect.
A break outside of the bands in either direction indicates a possible breakout.
All 3 bands serve as possible support and/or resistance. Meaning breaks back into the bands could indicate a reversal, or end of the breakout.
This indicator is completely customizable, so compiling multiple sized bands on top of each other may create a strong competitive edge.
--
IF YOU SUBSCRIBED
This indicator was intended to be available for purchase Jan 2018.
However, with recent change of mind I have decided to make it free to use.
IF you previously subscribed. I greatly appreciate your interest and I hope you enjoy this now FREE indicator!
Once again, thank you!
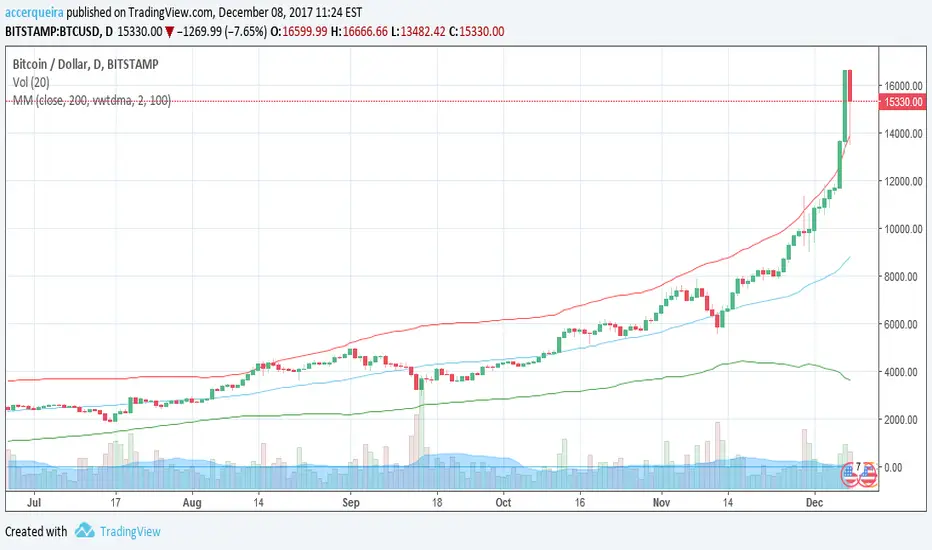
MayerMultiple StochasticThis is an stochastic chart of Price adjusted Mayer Multiple Average Delta.
Moving Average Function can be selected from a list with standard functions and following experimental extras:
- Volume Weighted Exponential Moving Average
- Volume Weighted Time Decayed Moving Average // similar to vwema, but alpha is calculated from length as half-life decay function (not sure if I got that right...)
Default MA function is sma, to keep it true to the original MM indicator, but I think VWEMA and VWTDMA may perform better with exponential nature of Bitcoin .
See also:
Suggestions and bug reports are welcome =)

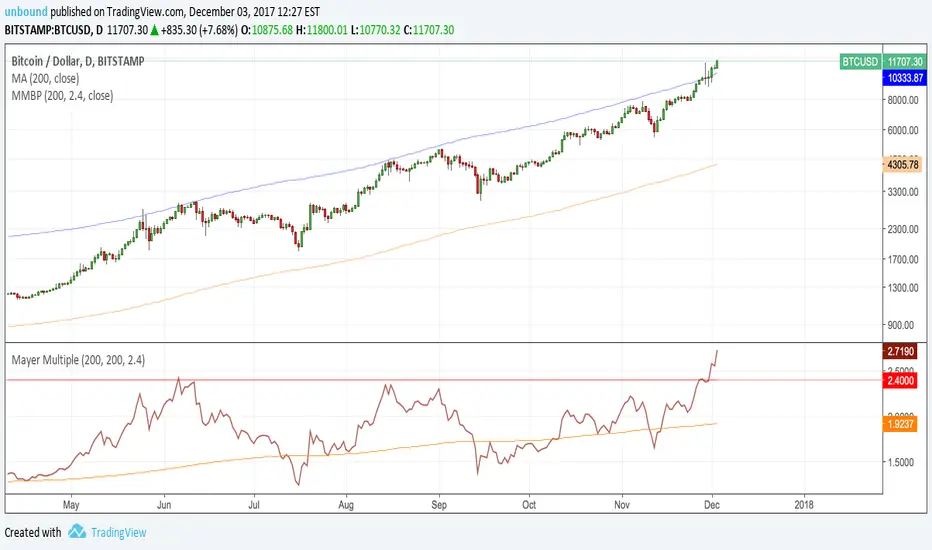
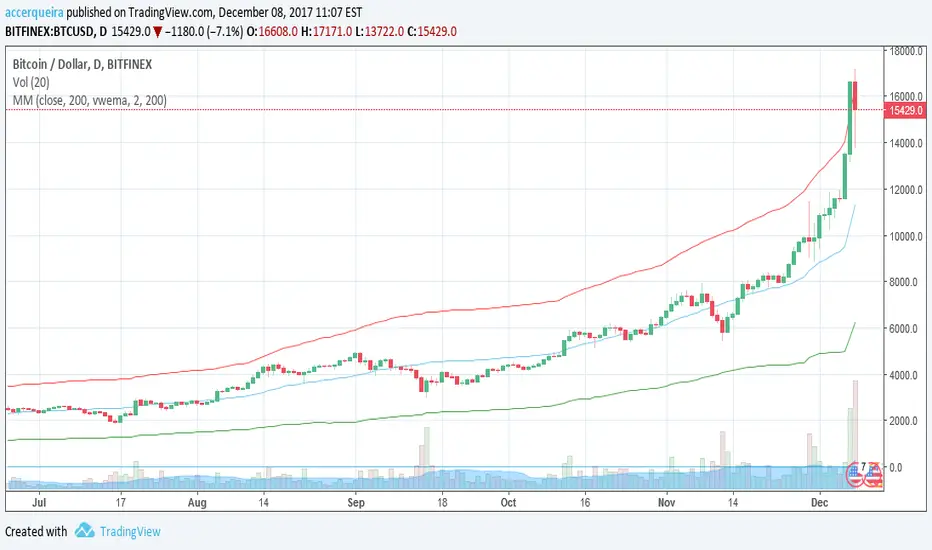
MayerMultiple Price BBThis charts an indicator created by Trace Mayer with some extras.
Plots:
- Mayer Multiple (may be hard to notice, since it overlays by default and stay at the bottom...)
- Price adjusted by Mayer Multiple Average with Bollinger Bands
Moving Average Function can be selected from a list with standard functions and following experimental extras:
- Volume Weighted Exponential Moving Average
- Volume Weighted Time Decayed Moving Average // similar to vwema, but alpha is calculated from length as half-life decay function (not sure if I got that right...)
Default MA function is sma, to keep it true to the original MM indicator, but I think VWEMA and VWTDMA may perform better with exponential nature of Bitcoin .
Suggestions and bug reports are welcome =)
MayerMultiple Price BBThis charts an indicator created by Trace Mayer with some extras.
Plots:
- Mayer Multiple
- Price adjusted by Mayer Multiple Average with Bollinger Bands
Moving Average Function can be selected from a list with standard functions and following experimental extras:
- Volume Weighted Exponential Moving Average
- Volume Weighted Time Decayed Moving Average // similar to vwema, but alpha is calculated from length as half-life decay function (not sure if I got that right...)
Default MA function is sma, to keep it true to the original MM indicator, but I think VWEMA and VWTDMA may perform better with exponential nature of Bitcoin .
Suggestions and bug reports are welcome =)
Mayer MultipleFollowing Preston Pysh's "Bitcoin Mayer Multiple" study, I made this simple script to plot the Mayer multiple by calculating the ratio between bitcoin price and its 200-day moving average. It also plots the moving average of ratio itself.