Bitcoin Cost of Transaction (%)The Bitcoin Relative Cost of Transaction shows the miners' revenue as a percentage of the transaction volume registered in the block.
Recherche dans les scripts pour "bitcoin"

Bitcoin Cost per Transaction (USD)The Bitcoin Cost per Transaction (USD) is the result of dividing the miners' revenue (Block Reward + Transaction Fees) between the number of transactions per block.
Here is an example with made up numbers:
Block reward is 12.5 BTC + 0.5 BTC in transaction fees.
There are 2700 transactions in the block.
Current exchange rate is 5700 USD/BTC.
(12.5 BTC + 0.5 BTC) / 2700 transactions = 0.00481481 BTC per transaction
5700 USD/BTC * 0.00481481 BTC per transaction = $27.44 per transaction
Hope that helps!


Bitcoin Network DifficultyThe Bitcoin Network Difficulty is a measure of how difficult it is to find the next block, compared to the difficulty of finding the easiest possible one.
The easiest possible block has a proof-of-work difficulty of 1.

Bitcoin Hash RateThe Hash Rate is the amount of computing power securing the Bitcoin Network.
The value is expressed in TH/s. Therefore a read of 1,000,000 (one million) would equate to 1 EH/s.
Here's a cheatsheet to convert this value into other units:
1 kH/s is 1,000 (one thousand) hashes per second
1 MH/s is 1,000,000 (one million) hashes per second.
1 GH/s is 1,000,000,000 (one billion) hashes per second.
1 TH/s is 1,000,000,000,000 (one trillion) hashes per second.
1 PH/s is 1,000,000,000,000,000 (one quadrillion) hashes per second.
1 EH/s is 1,000,000,000,000,000,000 (one quintillion) hashes per second.
1 ZH/s is 1,000,000,000,000,000,000,000 (one sextillion) hashes per second.
Hope that helps!

Bitcoin Stacked VolumesThe idea was to keep Bitcoin trading volumes on the different exchanges under control using only one chart and only one indicator. It works on ANY timeframe.
Settings
Lookback for SMA of volume from each exchange (default: 21 )
Option to include or not volumes that traded in stablecoin pairs (default: true )
Customizable volume quotas for alerts
Alerts
It has 30 different alerts which can be divided into 4 types:
Total Quota Exceeded
Total Volume/SMA Crossover
Quota Exceeded
Volume/SMA Crossover
Here are some examples how it helps to be aware the situation on 1-minute resolution:

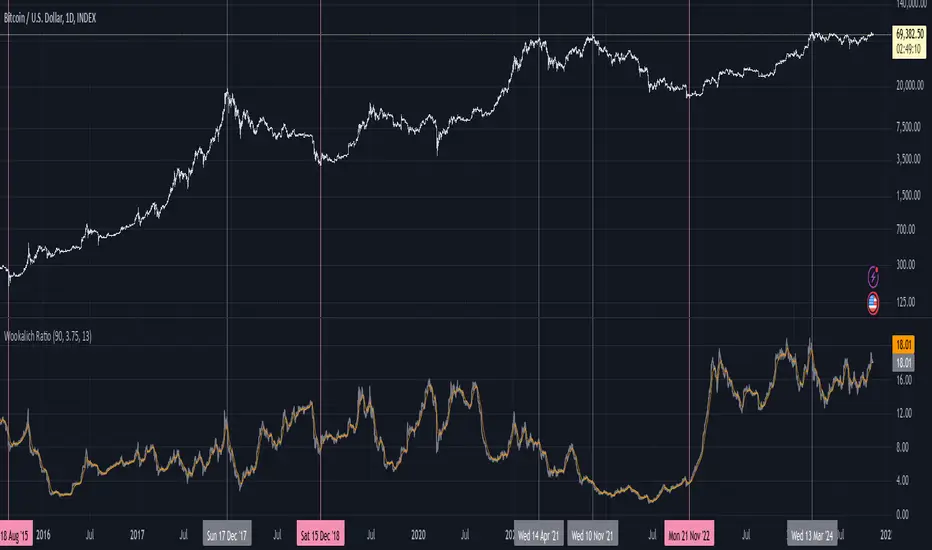
Bitcoin Wookalich Ratio (NVT)The Wookalich Ratio is an indicator derived from the NVT Signal . This is a tool used in Bitcoin markets to predict tops and bottoms.
The Wookalich Ratio aims to correct long-term inflation skewing through the use of a dilution factor.
I've setup this indicator for it to be possible to base the calculations on custom:
Transaction Periods
Overbought levels (110 by default)
Oversold levels (32 by default)
Credit for this idea goes to cryptopoiesis twitter.com
You're welcome to use add it to your charts.
Bitcoin Fundamentals - Mining IncomePlot the Bitcoin Mining Income in USD or BTC terms.
This Blockchain Indicator is a very useful helper tool to elaborate on Fundamental Studies.

BITCOIN-INDEX- (*Beta Version*) _BTCXjust like the dollar index and any fiat currency index , this is Bitcoin index , But this is still Beta Version and just Demo

Bitcoin Trend AnalysisThis is the most accurate signal script for Bitcoin you will find for free.
(This script uses ATR to create buy and sell signals and has been shown to be quite accurate.)

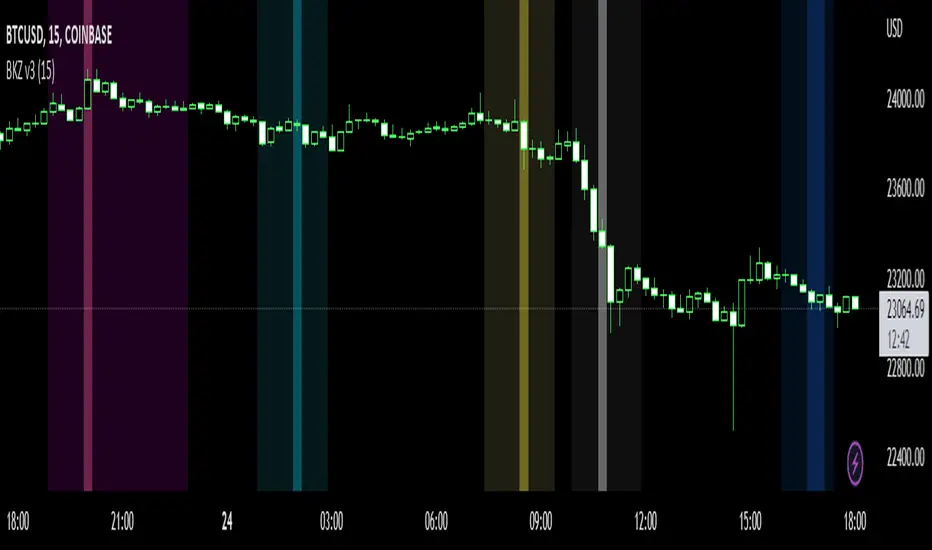
Bitcoin Kill Zones v2 |7Day| [oscarvs] [xeno]This edit adds weekends to Bitcoin Kill Zones v2 by oscarvs and other contributors. Bit of an experiment. Enjoy.
Bitcoin Momentum TSIChart based on True Strength Indicator
It was improved to show same information as Squeeze Momentum Indicator by LazyBear,
but it seems to have better and quicker response to changes and was tested on Bitcoin mainly.
Enjoy it!
BITFINEX:BTCUSD
MicroStrategy Bitcoin Premium v2 [Kendrick_Chan]In 2020, MicroStrategy, under the leadership of CEO Michael Saylor, began purchasing large amounts of Bitcoin to hedge against inflation and diversify its corporate treasury. This move transformed MicroStrategy into one of the largest corporate holders of Bitcoin, with the company continually increasing its holdings through additional purchases funded by issuing new shares and convertible bonds.
The MicroStrategy Bitcoin Premium indicator is a dynamic tool that underscores the enthusiasm of equity market investors to gain Bitcoin exposure through MicroStrategy's (MSTR) stock. This indicator measures the premium investors are willing to pay for MSTR shares relative to the company's Bitcoin and cash holdings, reflecting the traditional market's eagerness to hold Bitcoin indirectly.
How Does It Work:
When MicroStrategy issues convertible bonds, cash level increases and all CB are assumed to convert to stocks diluting the shares.
In case of sales of MSTR new shares, cash level increases and diluted shares are adjusted tentatively before the quarterly financial reports.
In the event of Bitcoin purchases, the Bitcoins holding increases while cash level decreases.
Premium = Assumed Diluted Market Cap / ( Bitcoins Value + Cash and Cash Equivalents ) - 100%
How To Use:
By understanding and utilizing the MicroStrategy Bitcoin Premium indicator, traders and investors can make more informed decisions, whether they are swing trading MSTR, gauging Bitcoin demand, or seeking arbitrage opportunities.
1. MSTR Swing Traders
Swing traders can leverage the indicator to identify potential MSTR entry and exit points based on the overbought or oversold conditions of the stock.
2. Bitcoin Investors and Traders
The premium indicator can serve Bitcoin investors as a proxy for gauging overall market demand. A high premium indicates strong demand for Bitcoin exposure through MSTR, reflecting broader market enthusiasm for Bitcoin. A low premium suggests reduced demand.
Bitcoin traders may also anticipate the Bitcoin demand driven by MicroStrategy:
a) Shen the premium is high, MicroStrategy could issue new shares or convertible bonds to raise funds and buy more Bitcoins.
b) Arbitrageurs might also short sell MSTR and buy the equivalent Bitcoins.
3. MSTR-Bitcoin Arbitrageurs
Arbitrage traders can use the premium indicator to exploit price discrepancies between MSTR stock and Bitcoin. This strategy profits from any convergence between the stock price and the value of the underlying Bitcoin holdings.
The indicator helps identify optimal times to enter and exit arbitrage positions, minimizing risk and maximizing potential returns by capitalizing on market inefficiencies.

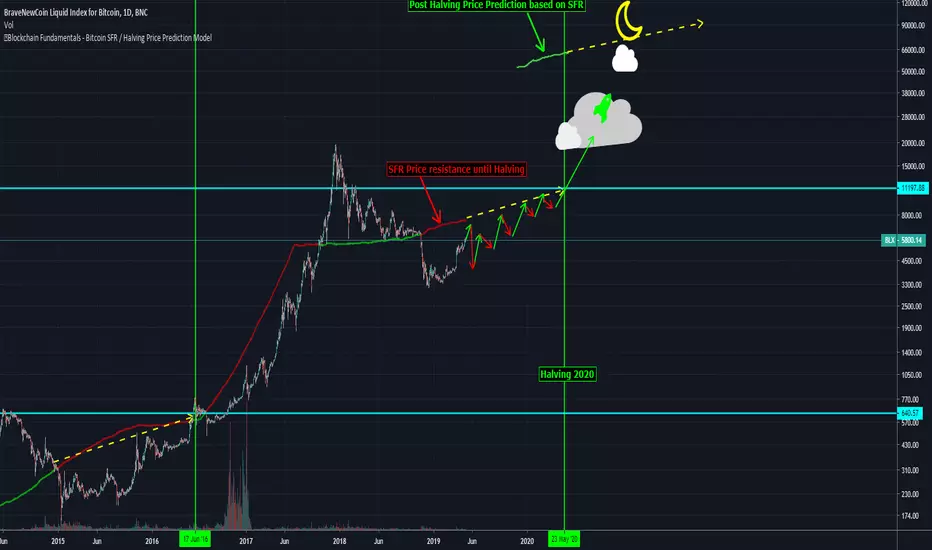
🔗Blockchain Fundamentals - Bitcoin Post Halving Price Model🔗Blockchain Fundamentals - Bitcoin SFR / Halving Price Prediction Model
Description
This price model is based upon the work of PlanB (@100trillionUSD) which can be seen here: medium.com
He states "We can also model bitcoin price directly with Stock to Flow. The formula of course has different parameters, but the result is the same, 95% R2 and a predicted bitcoin price of $55,000 with SF 50 after May 2020 halving."
He was using monthly data on a weekly timeframe. I converted to a daily timeframe, and add in future price prediction by projecting the average number of blocks mined. You can use this along with the Stock to Flow Ratio indicator here .
Post halving price prediction currently stands at ~$62k based on this model.
👍 Enjoying this indicator or find it useful? Please give me a like and follow! I post crypto analysis, price action strategies and free indicators regularly.
💬 Questions? Comments? Want to get access to an entire suite of proven trading indicators? Come visit us on telegram and chat, or just soak up some knowledge. We make timely posts about the market, news, and strategy everyday. Our community isn't open only to subscribers - everyone is welcome to join.
For Trialers & Chat: t.me
🔗Blockchain Fundamentals - Bitcoin Velocity by Cryptorhythms🔗Blockchain Fundamentals - Bitcoin Velocity by Cryptorhythms
Description
The velocity of money is the rate at which money is exchanged in an economy. It is the number of times that money moves from one transaction to another. It also refers to how much a unit of currency is used in a given period of time. Simply put, it's the rate at which people spend currency. The velocity of money is usually measured as a ratio of gross national product (GNP) to a country's total supply of money, in traditional markets.
Here is the formula proposed by twitter user PositiveCrypto, implemented for you here on tradingview.
How does it relate to Bitcoin?
Is bitcoin trending towards savings or payments? This can help you decide. It is similar to Bitcoin Network Momentum, except this takes into account bitcoins increasing supply.
Low velocity implies HODLing and Speculation on future value. People looking at bitcoin as a longer term investment.
Higher velocity indicates currency changing hands faster. Perhaps as an indication of adoption pushing bitcoin towards a payment/transaction usage.
Opinions and Hypothesis
In the midst of the last bear market we saw velocity spike, perhaps as people gave up on investments and starting using it for payments.
As the 2017 bull run sucked in more buyers at higher and higher retail prices, velocity decreased, perhaps as those people did not want to sell at a loss.
As we entered the big dip in Nov 2018 velocity began increasing, as some capitulated and others were drawn into the market by lower prices.
Extras
I added in additional functionality so you can change the moving average from SMA to a few other choices (more MA's to choose from coming soon in future update). I also added a variable to change the length of said MA to your desired value so you may experiment. You can also chose to display as a line or area plot depending on preference.
👍 Enjoying this indicator or find it useful? Please give me a like and follow! I post crypto analysis, price action strategies and free indicators regularly.
💬 Questions? Comments? Want to get access to an entire suite of proven trading indicators? Come visit us on telegram and chat, or just soak up some knowledge. We make timely posts about the market, news, and strategy everyday. Our community isn't open only to subscribers - everyone is welcome to join.
For Trialers & Chat: t.me

Leonid's Bitcoin Macro & Liquidity Regime Tracker🧠 Macro Overlay Score (Bitcoin Liquidity Regime Tracker)
This indicator combines the most important macroeconomic and on-chain inputs into a single unified score to help investors identify Bitcoin’s long-term cycle phases. Each input is normalized into a 0–100 score and blended using configurable weights to generate a dynamic, forward-looking macro regime tracker.
✅ Best used on the **Bitcoin All Time History Index with Weekly resolution** (`INDEX:BTCUSD`) for maximum historical context and signal clarity.
---
📈 Why Macro?
Macro liquidity conditions — interest rates, monetary expansion, dollar strength, credit risk — drive Bitcoin cycles . Risk assets like BTC thrive during periods of:
Monetary easing
Liquidity injections
Expansionary central bank policy
This overlay surfaces those periods *before* price follows. It captures cycle shifts in the business cycle, monetary policy, and investor sentiment — making it ideal for long-term allocators, macro-aligned investors, and cycle-focused BTC holders.
🔔 This is **not** designed for short-term or swing trading. It is optimized for **macro trend confirmation and regime awareness** — not fast entry/exit signals.
---
🔍 What It Tracks
Macro Inputs:
- 🏭 ISM 3M Trend (Business Cycle)
- 💹 CPI YoY (Inverted Inflation)
- 💵 M2 YoY + M2 Acceleration
- 🇨🇳 China M2 (Global Liquidity)
- 💱 DXY 3M Trend (USD Strength)
- 🏦 TGA & RRP YoY (Treasury / MMF Flows)
- 🏛 Fed Balance Sheet (WALCL)
- 💳 High Yield Spread (Credit Conditions)
- 💧 Net Liquidity Composite = WALCL – TGA – RRP
On-Chain Inputs:
- ⚠️ MVRV Ratio (Valuation Cycles)
- 🚀 Mayer Multiple Acceleration (200DMA Momentum)
---
🧩 How It Works
Each input is:
Normalized to a 0–100 score
Weighted by importance (fully configurable)
Combined into a **composite Macro Score**, then normalized across history
The chart will display:
🔷 A 0–100 **Macro Score Line**
🧭 **Cycle Phase classification**: Accumulation, Expansion, Distribution, Capitulation
📊 Optional **debug table** with all sub-scores
---
🧠 Interpreting the Signal
| Signal Type | Meaning |
|-------------------|---------------------------------------------|
| Macro Score ↑ | Liquidity improving → Bullish regime forming |
| Macro Score ↓ | Liquidity deteriorating → Caution warranted |
| Score < 40 & Rising | 🔵 Accumulation cycle likely beginning |
| Score > 70 & Falling | 🟡 Distribution / Macro exhaustion |
| Net Liquidity ↑ | Strong driver of BTC upside historically |
---
❓ FAQ
Q: Why did the Macro Score peak in March 2021, but Bitcoin topped in November?
> The indicator reflects **macro liquidity**, not price momentum. M2 growth slowed, DXY bottomed, and the Fed stopped expanding WALCL by Q1 2021 — all signs of macro exhaustion. BTC continued on **residual momentum**, but the smart money began exiting months earlier.
Q: What does the score range mean?
- 0–25 : Tight liquidity, unfavorable conditions
- 50 : Neutral environment
- 75–100 : Strong easing, liquidity surge
Q: Is this good for short-term signals?
> No. This is a **macro-level overlay**, best used for 3–12 month context shifts, not day trades.
Q: Can I adjust the weights?
> Yes. You can tune the influence of each input to match your thesis (e.g., overweight on-chain, or global liquidity).
Q: Do I need special data access?
> No. All symbols are public TradingView datasets (FRED, CryptoCap, etc.). Just use this on a BTC chart like `BTCUSD`.
---
✅ How to Use
- Load on **`INDEX:BTCUSD`**, set to **Weekly timeframe**
- Confirm long-term bottoms when score is low and rising (Accumulation → Expansion)
- Watch for tops when score is high and falling (Distribution → Capitulation)
- Combine with price structure, realized profit/loss, and market sentiment
---
🚀 If you're serious about understanding Bitcoin's macro regime, this is your alpha map. Share it, clone it, and build on it.

TrendTracers Bitcoin Stock to Flow ModelFor the best results, make sure to view this indicator on a bitcoin chart with a very long history (e.g. BNC:BLX)!
This model treats Bitcoin as being comparable to commodities such as gold, silver or platinum. These are known as ‘store of value’ commodities because they retain value over long time frames due to their relative scarcity. It is difficult to significantly increase their supply i.e. the process of searching for gold and then mining it is expensive and takes time. Bitcoin is similar because it is also scarce. In fact, it is the first-ever scarce digital object to exist. There are a limited number of coins in existence and it will take a lot of electricity and computing effort to mine the remaining coins still to be mined, therefore the supply rate is consistently low.
The stock-to-flow model predicts value changes in a straightforward manner. It compares an asset’s current stock to the rate of new production, or how much is produced in a year.
Calculation:
Take bitcoin production in a period, divide it by that period and then multiply by 365 to get the estimated yearly production and then calculate the stock to flow.
yearlyFlow = ((stockChange) / period ) * 365
stockToFlow = (stock - missingBitcoins) / yearlyFlow
Model Value = -1.84ᵉ * stockToFlow³.³⁶ (mathematical model to calculate the model price)
For more information about the calculations followed: stats.buybitcoinworldwide.com
Features:
Works on the Daily, Weekly and Monthly Timeframe.
Allows you to adjust between a 10-day period and a 463-day period.
Has the option to account for missing bitcoins, lets you adjust the amount of missing bitcoins.
The ability to toggle a standard deviation of the Model Value with a multiplier of 1, 2 or 3
Displays a Stock to Flow Deviation Ratio: If the Deviation Ratio is close to 0 it means the price of Bitcoin is close to the Model Value Line(or Stock to Flow Ratio). If the Deviation Ratio is close to 1 or -1, it means the price of bitcoin is near the selected deviation levels.
You can toggle between the Overlay version and the Oscillator version, default is on Oscillator version. If you want to switch: Untick Oscillator mode in the indicator settings, click on the three dots and select "move to existing pane above". Then click on the three dots again and select Pin to scale A. Done!
As a bonus: Now you can toggle a "1-year Realized Price" graph, while it's not officially part of the Stock to Flow Model it does share similar technicals about supply and scarcity. The 1-year Realized Price is the realized market cap divided by total amount of generated coins.
I just noticed that, while the color gradient function is pretty cool, it does not allow for end users to customize their colors after applying this indicator to their chart. Sorry!

Atlantean Bitcoin Weekly Market Condition - Top/Bottom BTC Overview:
The "Atlantean Bitcoin Weekly Market Condition Detector - Top/Bottom BTC" is a specialized TradingView indicator designed to identify significant turning points in the Bitcoin market on a weekly basis. By analyzing long-term and short-term moving averages across two distinct resolutions, this indicator provides traders with valuable insights into potential market bottoms and tops, as well as the initiation of bull markets.
Key Features:
Market Bottom Detection: The script uses a combination of a simple moving average (SMA) and an exponential moving average (EMA) calculated over long and short periods to identify potential market bottoms. When these conditions are met, the script signals a "Market Bottom" label on the chart, indicating a possible buying opportunity.
Bull Market Start Indicator: When the short-term EMA crosses above the long-term SMA, it signals the beginning of a bull market. This is marked by a "Bull Market Start" label on the chart, helping traders to prepare for potential market upswings.
Market Top Detection: The script identifies potential market tops by analyzing the crossunder of long and short-term moving averages. A "Market Top" label is plotted, suggesting a potential selling point.
Customizable Moving Averages Display: Users can choose to display the moving averages used for detecting market tops and bottoms, providing additional insights into market conditions.
How It Works: The indicator operates by monitoring the interactions between the specified moving averages:
Market Bottom: Detected when the long-term SMA (adjusted by a factor of 0.745) crosses over the short-term EMA.
Bull Market Start: Detected when the short-term EMA crosses above the long-term SMA.
Market Top: Detected when the long-term SMA (adjusted by a factor of 2) crosses under the short-term SMA.
These conditions are highlighted on the chart, allowing traders to visualize significant market events and make informed decisions.
Intended Use: This indicator is best used on weekly Bitcoin charts. It’s designed to provide long-term market insights rather than short-term trading signals. Traders can use this tool to identify strategic entry and exit points during major market cycles. The optional display of moving averages can further enhance understanding of market dynamics.
Originality and Utility: Unlike many other indicators, this script not only highlights traditional market tops and bottoms but also identifies the aggressive start of bull markets, offering a comprehensive view of market conditions. The unique combination of adjusted moving averages makes this script a valuable tool for long-term Bitcoin traders.
Disclaimer: The signals provided by this indicator are based on historical data and mathematical calculations. They do not guarantee future market performance. Traders should use this tool as part of a broader trading strategy and consider other factors before making trading decisions. Not financial advice.
Happy Trading!
By Atlantean

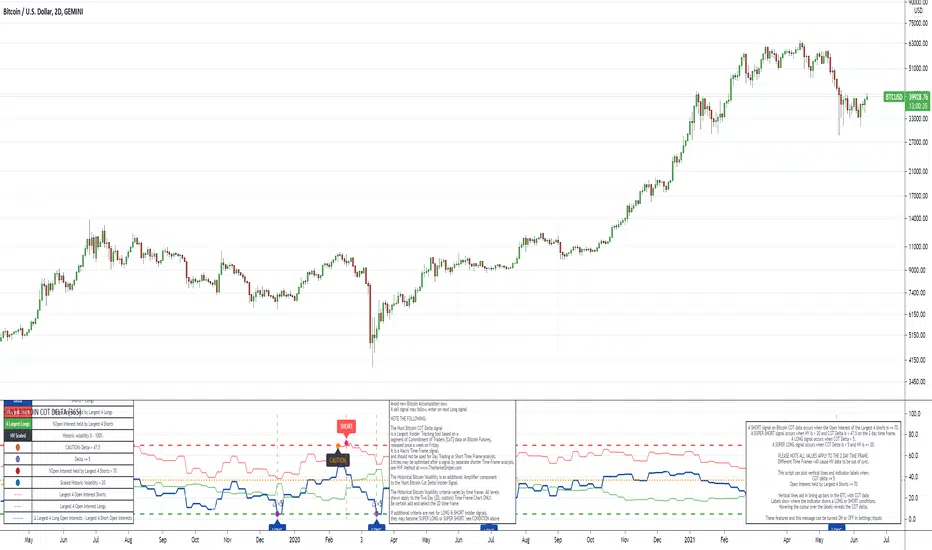
The Signal - Hunt Bitcoin CoT Buy/SellThe Signal - Hunt Bitcoin CoT Buy/Sell
Why Bother with another CoT signal?
Its different & focused on the Insider's. The Largest 4 Open Interest Seller and the Largest 4 open Interest Longs, plus the distance they are apart, the Delta, what does high percentage of Largest 4 sellers mean with a low 4 OI Buyers. , what when the usually higher Sellers are low and the largest 4 buyers almost the same value , Time to track the insiders Delta..
Performance -
This Indicator provided a
1. Signal 1 = 26th March 2019 = SUPER LONG at $4,500 that saw a near $14,000 run up
2. Signal 2 = 18th & 24th June 2019 = SHORT at the second & final level $11,700 after repeated attempts & failure in the $13K range, the mini Echo Bitcoin Bull of 2019
3. Signal 3 = 17th December 2019 = LONG $6,900, Bitcoin rallied to Mid $10,500's
4. Signal 4 = 18th Feb 2020 = SUPER SHORT from $9,700's to a final extreme Low of $3,000, calling the CV-19 collapse
5. Signal 5 = 17th March 2020 = LONG from $5,400 no closure point yet
6. Signal 6 = 29th June 2020 = SUPER LONG reiterate from $10,700 no closure sell signal yet
7. Signal 7 = 17th May 2020 = LONG another accumulate LONG with no sell signal yet generated at Post H&S's low of $33,000
Note - This indicator only commences March 2019, as Bitcoin futures were a recent introduction and needed to settle for 6 months in both use and data, no signals were meaningful prior & data was light.
What is Provided. - Please note the need to also add the Hunt Bitcoin Historical Volatility Indicator for full understanding.
We provide 3 things with the 3 indicators.
'Insider' indications from Largest players in the futures market.
1. Bitcoin Macro Buy Signals.
a) The Bitcoin Commitment of Traders results see us focus solely on Largest 4 Short Open Interest & Largest 4 Long Open Interest aspects of the CoT Release data.
When the difference - is tight, a kind of pinch, these have been great Buy signals in Bitcoin.
We call this difference the Delta & When Delta is 5% or less Bitcoin is a Buy.
2. Bitcoin Macro Sells.
a) A sell signal is Triggered in Bitcoin at any point the Largest 4 short OI > or = to 70
3. AMPLIFIER Trade signals 'Super' Longs or Shorts -
Extreme low volatility events leads to highly impulsive & volatile subsequent moves, if either of 1 or 2 above occur, combined with extreme low volatility
a 'Super Long' or 'SUPER SELL' is generated. In the case of the short side, given Bitcoins general expansive and MACRO Bull trend since inception, we seek an additional component
that is an extreme differential/Delta reading between 4 biggest Longs & Shorts OI.
Namely CoT Delta also must be > 47.5%
We also have a Cautionary level, where it is not necessarily a good idea to accumulate Bitcon, as a better opportunity lower may avail itself, see conditions below.
So the required logic explicitly stated below for all Signals.
1. Long - Hunt Bitcoin CoT Delta < or = 5
2. SUPER Long - Hunt Bitcoin CoT Delta < or = 5; and 2 Day Historical Bitcoin Volatility = or < 20
3. Short - Largest 4 Sellers OI = or > 70
4. SUPER Short - Largest 4 Sellers OI = or > 70; AND..
Hunt Bitcoin CoT Delta = or > 47.5 AND 2 Day Historical BTC Volatility = or < 20
5. Caution - Largest 4 Sellers OI = or > 67.5 AND Hunt Bitcoin CoT Delta = or > 45
WARNING SEE Notes Below
Note 1 - = Largest 4 Open Interest Shorts
Note 2 - = Largest 4 Open Interest Longs
Note 3 - = Hunt Cot Delta = (Largest 4 sellers OI) -( Largest 4 Buyers OI)
Caution = Avoid new Bitcoin Accumulation Right Now, A sell signal might follow Enter on next Long
Note 4 - The Hunt Bitcoin COT Delta signal is a Largest 'Insider' Tracking tool based on a segment of Commitment of Traders data on Bitcoin Futures, released once a week on a Friday.
It is a Macro Timeframe signal , and should not be used for Day trading and Short Timeframe analysis , Entries may be optimised after a Hunt Bitcoin CoT Signal is generated by separate shorter Timeframe analysis.
Note 5 - The Historical Bitcoin Volatility is an additional 'Amplifier' component to the 'Hunt Bitcoin Cot Delta' Insider Signal
Note 6 - The Historical Bitcoin Volatility criteria varies by timeframe, the above levels are those applying on a Two Day TF Chart, select this custom timeframe in Trading View.
if additional criteria are met for LONG & SHORT insider signals, they may become 'Super Longs/Shorts', see conditions box above.

The Amplifier - Two Day Historical Bitcoin Volatility PlotThe 3rd piece to the other two pieces to our CoT study. This is the Amplifier, which turns select signals into 'Super' Buys/Sells
The other two being the 'Bitcoin Insider CoT Delta', and the on chart Price indicator most will have, if no others the 'Hunt Bitcoin CoT Buy/Sell Signals' that will indicate the key signals, ave 4 a year on the chart as they occur.
Why Bother another CoT signal?
Its different & focused on the Insider's.
Performance -
This Indicator provided a
1. Signal 1 = 26th March 2019 = SUPER LONG at $4,500 that saw a near $14,000 run up
2. Signal 2 = 18th & 24th June 2019 = SHORT at the second & final level $11,700 after repeated attempts & failure in the $13K range, the mini Echo Bitcoin Bull of 2019
3. Signal 3 = 17th December 2019 = LONG $6,900, Bitcoin rallied to Mid $10,500's
4. Signal 4 = 18th Feb 2020 = SUPER SHORT from $9,700's to a final extreme Low of $3,000, calling the CV-19 collapse
5. Signal 5 = 17th March 2020 = LONG from $5,400 no closure point yet
6. Signal 6 = 29th June 2020 = SUPER LONG reiterate from $10,700 no closure sell signal yet
7. Signal 7 = 17th May 2020 = LONG another accumulate LONG with no sell signal yet generated at Post H&S's low of $33,000
Note - This indicator only commences March 2019, as Bitcoin futures were a recent introduction and needed to settle for 6 months in both use and data, no signals were meaningful prior & data was light.
What is Provided. - Please note the need to also add the Hunt Bitcoin Historical Volatility Indicator for full understanding.
We provide 3 things with the 3 indicators.
'Insider' indications from Largest players in the futures market.
1. Bitcoin Macro Buy Signals.
a) The Bitcoin Commitment of Traders results see us focus solely on Largest 4 Short Open Interest & Largest 4 Long Open Interest aspects of the CoT Release data.
When the difference - is tight, a kind of pinch, these have been great Buy signals in Bitcoin.
We call this difference the Delta & When Delta is 5% or less Bitcoin is a Buy.
2. Bitcoin Macro Sells.
a) A sell signal is Triggered in Bitcoin at any point the Largest 4 short OI > or = to 70
3. AMPLIFIER Trade signals 'Super' Longs or Shorts -
Extreme low volatility events leads to highly impulsive & volatile subsequent moves, if either of 1 or 2 above occur, combined with extreme low volatility
a 'Super Long' or 'SUPER SELL' is generated. In the case of the short side, given Bitcoins general expansive and MACRO Bull trend since inception, we seek an additional component
that is an extreme differential/Delta reading between 4 biggest Longs & Shorts OI.
Namely CoT Delta also must be > 47.5%
We also have a Cautionary level, where it is not necessarily a good idea to accumulate Bitcon, as a better opportunity lower may avail itself, see conditions below.
So the required logic explicitly stated below for all Signals.
1. Long - Hunt Bitcoin CoT Delta < or = 5
2. SUPER Long - Hunt Bitcoin CoT Delta < or = 5; and 2 Day Historical Bitcoin Volatility = or < 20
3. Short - Largest 4 Sellers OI = or > 70
4. SUPER Short - Largest 4 Sellers OI = or > 70; AND..
Hunt Bitcoin CoT Delta = or > 47.5 AND 2 Day Historical BTC Volatility = or < 20
5. Caution - Largest 4 Sellers OI = or > 67.5 AND Hunt Bitcoin CoT Delta = or > 45
WARNING SEE Notes Below
Note 1 - = Largest 4 Open Interest Shorts
Note 2 - = Largest 4 Open Interest Longs
Note 3 - = Hunt Cot Delta = (Largest 4 sellers OI) -( Largest 4 Buyers OI)
Caution = Avoid new Bitcoin Accumulation Right Now, A sell signal might follow Enter on next Long
Note 4 - The Hunt Bitcoin COT Delta signal is a Largest 'Insider' Tracking tool based on a segment of Commitment of Traders data on Bitcoin Futures, released once a week on a Friday.
It is a Macro Timeframe signal , and should not be used for Day trading and Short Timeframe analysis , Entries may be optimised after a Hunt Bitcoin CoT Signal is generated by separate shorter Timeframe analysis.
Note 5 - The Historical Bitcoin Volatility is an additional 'Amplifier' component to the 'Hunt Bitcoin Cot Delta' Insider Signal
Note 6 - The Historical Bitcoin Volatility criteria varies by timeframe, the above levels are those applying on a Two Day TF Chart, select this custom timeframe in Trading View.
if additional criteria are met for LONG & SHORT insider signals, they may become 'Super Longs/Shorts', see conditions box above.

Hunt Bitcoin CoT Buy/Sell signalWhy Bother another CoT signal?
Its different & focused on the Insider's.
Performance -
This Indicator provided a
1. Signal 1 = 26th March 2019 = SUPER LONG at $4,500 that saw a near $14,000 run up
2. Signal 2 = 18th & 24th June 2019 = SHORT at the second & final level $11,700 after repeated attempts & failure in the $13K range, the mini Echo Bitcoin Bull of 2019
3. Signal 3 = 17th December 2019 = LONG $6,900, Bitcoin rallied to Mid $10,500's
4. Signal 4 = 18th Feb 2020 = SUPER SHORT from $9,700's to a final extreme Low of $3,000, calling the CV-19 collapse
5. Signal 5 = 17th March 2020 = LONG from $5,400 no closure point yet
6. Signal 6 = 29th June 2020 = SUPER LONG reiterate from $10,700 no closure sell signal yet
7. Signal 7 = 17th May 2020 = LONG another accumulate LONG with no sell signal yet generated at Post H&S's low of $33,000
Note - This indicator only commences March 2019, as Bitcoin futures were a recent introduction and needed to settle for 6 months in both use and data, no signals were meaningful prior & data was light.
What is Provided. - Please note the need to also add the Hunt Bitcoin Historical Volatility Indicator for full understanding.
We provide 3 things with the 3 indicators.
'Insider' indications from Largest players in the futures market.
1. Bitcoin Macro Buy Signals.
a) The Bitcoin Commitment of Traders results see us focus solely on Largest 4 Short Open Interest & Largest 4 Long Open Interest aspects of the CoT Release data.
When the difference - is tight, a kind of pinch, these have been great Buy signals in Bitcoin.
We call this difference the Delta & When Delta is 5% or less Bitcoin is a Buy.
2. Bitcoin Macro Sells.
a) A sell signal is Triggered in Bitcoin at any point the Largest 4 short OI > or = to 70
3. AMPLIFIER Trade signals 'Super' Longs or Shorts -
Extreme low volatility events leads to highly impulsive & volatile subsequent moves, if either of 1 or 2 above occur, combined with extreme low volatility
a 'Super Long' or 'SUPER SELL' is generated. In the case of the short side, given Bitcoins general expansive and MACRO Bull trend since inception, we seek an additional component
that is an extreme differential/Delta reading between 4 biggest Longs & Shorts OI.
Namely CoT Delta also must be > 47.5%
We also have a Cautionary level, where it is not necessarily a good idea to accumulate Bitcon, as a better opportunity lower may avail itself, see conditions below.
So the required logic explicitly stated below for all Signals.
1. Long - Hunt Bitcoin CoT Delta < or = 5
2. SUPER Long - Hunt Bitcoin CoT Delta < or = 5; and 2 Day Historical Bitcoin Volatility = or < 20
3. Short - Largest 4 Sellers OI = or > 70
4. SUPER Short - Largest 4 Sellers OI = or > 70; AND..
Hunt Bitcoin CoT Delta = or > 47.5 AND 2 Day Historical BTC Volatility = or < 20
5. Caution - Largest 4 Sellers OI = or > 67.5 AND Hunt Bitcoin CoT Delta = or > 45
WARNING SEE Notes Below
Note 1 - = Largest 4 Open Interest Shorts
Note 2 - = Largest 4 Open Interest Longs
Note 3 - = Hunt Cot Delta = (Largest 4 sellers OI) -( Largest 4 Buyers OI)
Caution = Avoid new Bitcoin Accumulation Right Now, A sell signal might follow Enter on next Long
Note 4 - The Hunt Bitcoin COT Delta signal is a Largest 'Insider' Tracking tool based on a segment of Commitment of Traders data on Bitcoin Futures, released once a week on a Friday.
It is a Macro Timeframe signal , and should not be used for Day trading and Short Timeframe analysis , Entries may be optimised after a Hunt Bitcoin CoT Signal is generated by separate shorter Timeframe analysis.
Note 5 - The Historical Bitcoin Volatility is an additional 'Amplifier' component to the 'Hunt Bitcoin Cot Delta' Insider Signal
Note 6 - The Historical Bitcoin Volatility criteria varies by timeframe, the above levels are those applying on a Two Day TF Chart, select this custom timeframe in Trading View.
if additional criteria are met for LONG & SHORT insider signals, they may become 'Super Longs/Shorts', see conditions box above.

Hunt Bitcoin CoT Open Interest DeltaWhy Bother another CoT signal?
Its different & focused on the Insider's.
Performance -
This Indicator provided a
1. Signal 1 = 26th March 2019 = SUPER LONG at $4,500 that saw a near $14,000 run up
2. Signal 2 = 18th & 24th June 2019 = SHORT at the second & final level $11,700 after repeated attempts & failure in the $13K range, the mini Echo Bitcoin Bull of 2019
3. Signal 3 = 17th December 2019 = LONG $6,900, Bitcoin rallied to Mid $10,500's
4. Signal 4 = 18th Feb 2020 = SUPER SHORT from $9,700's to a final extreme Low of $3,000, calling the CV-19 collapse
5. Signal 5 = 17th March 2020 = LONG from $5,400 no closure point yet
6. Signal 6 = 29th June 2020 = SUPER LONG reiterate from $10,700 no closure sell signal yet
7. Signal 7 = 17th May 2020 = LONG another accumulate LONG with no sell signal yet generated at Post H&S's low of $33,000
Note - This indicator only commences March 2019, as Bitcoin futures were a recent introduction and needed to settle for 6 months in both use and data, no signals were meaningful prior & data was light.
What is Provided. - Please note the need to also add the Hunt Bitcoin Historical Volatility Indicator for full understanding.
We provide 3 things with the 3 indicators.
'Insider' indications from Largest players in the futures market.
1. Bitcoin Macro Buy Signals.
a) The Bitcoin Commitment of Traders results see us focus solely on Largest 4 Short Open Interest & Largest 4 Long Open Interest aspects of the CoT Release data.
When the difference - is tight, a kind of pinch, these have been great Buy signals in Bitcoin.
We call this difference the Delta & When Delta is 5% or less Bitcoin is a Buy.
2. Bitcoin Macro Sells.
a) A sell signal is Triggered in Bitcoin at any point the Largest 4 short OI > or = to 70
3. AMPLIFIER Trade signals 'Super' Longs or Shorts -
Extreme low volatility events leads to highly impulsive & volatile subsequent moves, if either of 1 or 2 above occur, combined with extreme low volatility
a 'Super Long' or 'SUPER SELL' is generated. In the case of the short side, given Bitcoins general expansive and MACRO Bull trend since inception, we seek an additional component
that is an extreme differential/Delta reading between 4 biggest Longs & Shorts OI.
Namely CoT Delta also must be > 47.5%
We also have a Cautionary level, where it is not necessarily a good idea to accumulate Bitcon, as a better opportunity lower may avail itself, see conditions below.
So the required logic explicitly stated below for all Signals.
1. Long - Hunt Bitcoin CoT Delta < or = 5
2. SUPER Long - Hunt Bitcoin CoT Delta < or = 5; and 2 Day Historical Bitcoin Volatility = or < 20
3. Short - Largest 4 Sellers OI = or > 70
4. SUPER Short - Largest 4 Sellers OI = or > 70; AND..
Hunt Bitcoin CoT Delta = or > 47.5 AND 2 Day Historical BTC Volatility = or < 20
5. Caution - Largest 4 Sellers OI = or > 67.5 AND Hunt Bitcoin CoT Delta = or > 45
WARNING SEE Notes Below
Note 1 - = Largest 4 Open Interest Shorts
Note 2 - = Largest 4 Open Interest Longs
Note 3 - = Hunt Cot Delta = (Largest 4 sellers OI) -( Largest 4 Buyers OI)
Caution = Avoid new Bitcoin Accumulation Right Now, A sell signal might follow Enter on next Long
Note 4 - The Hunt Bitcoin COT Delta signal is a Largest 'Insider' Tracking tool based on a segment of Commitment of Traders data on Bitcoin Futures, released once a week on a Friday.
It is a Macro Timeframe signal , and should not be used for Day trading and Short Timeframe analysis , Entries may be optimised after a Hunt Bitcoin CoT Signal is generated by separate shorter Timeframe analysis.
Note 5 - The Historical Bitcoin Volatility is an additional 'Amplifier' component to the 'Hunt Bitcoin Cot Delta' Insider Signal
Note 6 - The Historical Bitcoin Volatility criteria varies by timeframe, the above levels are those applying on a Two Day TF Chart, select this custom timeframe in Trading View.
if additional criteria are met for LONG & SHORT insider signals, they may become 'Super Longs/Shorts', see conditions box above.
[blackcat] L1 Bitcoin Guppy Whale Pump Dump OscillatorLevel: 1
Background
The Guppy Multiple Moving Average (GMMA) is a technical indicator that identifies changing trends, breakouts, and trading opportunities in the price of an asset by combining two sets of moving averages (MA) with different time periods. There is a short term group of MAs and a long term group of MAs.
One of the biggest differences between cryptocurrency and traditional financial markets is that cryptocurrency is based on blockchain technology. Individual investors can discover the direction of the flow of large funds through on-chain transfers. These large funds are often referred to as Whale. Whale can have a significant impact on the price movements of cryptocurrencies, especially Bitcoin . Therefore, how to monitor Whale trends is of great significance both in terms of fundamentals and technical aspects.
Function
L1 Bitcoin Guppy Whale Pump Dump Oscillator is innovative because it was moved from main chart to aux chart and the input source of Guppy moving average was changed in to bias rate of key EMAs. This makes it work as a Guppy oscillator. This Guppy oscillator was designed and optimized to detect whale pump and dump behavior for BTCUSD or BTCUSDT trading pairs. When whale pump is detected, yellow candles appear; when whale dump is detected, fuchsia candles appear.
Key Signal
di,d1~d8 ---> Guppy oscillator lines
pump --> whale pump detector
dump --> whale dump detector
Pros and Cons
Pros:
1. easy observe price trend
2. it detects whale pump and dump
Cons:
1. no explicit entries are disclosed
2. only optimized for Bitcoin usd/usdt trading pairs
Remarks
Courtesy of @LunaOwl " Rainbow Color Gradient" for colorful Guppy oscillator lines in this script
Readme
In real life, I am a prolific inventor. I have successfully applied for more than 60 international and regional patents in the past 12 years. But in the past two years or so, I have tried to transfer my creativity to the development of trading strategies. Tradingview is the ideal platform for me. I am selecting and contributing some of the hundreds of scripts to publish in Tradingview community. Welcome everyone to interact with me to discuss these interesting pine scripts.
The scripts posted are categorized into 5 levels according to my efforts or manhours put into these works.
Level 1 : interesting script snippets or distinctive improvement from classic indicators or strategy. Level 1 scripts can usually appear in more complex indicators as a function module or element.
Level 2 : composite indicator/strategy. By selecting or combining several independent or dependent functions or sub indicators in proper way, the composite script exhibits a resonance phenomenon which can filter out noise or fake trading signal to enhance trading confidence level.
Level 3 : comprehensive indicator/strategy. They are simple trading systems based on my strategies. They are commonly containing several or all of entry signal, close signal, stop loss, take profit, re-entry, risk management, and position sizing techniques. Even some interesting fundamental and mass psychological aspects are incorporated.
Level 4 : script snippets or functions that do not disclose source code. Interesting element that can reveal market laws and work as raw material for indicators and strategies. If you find Level 1~2 scripts are helpful, Level 4 is a private version that took me far more efforts to develop.
Level 5 : indicator/strategy that do not disclose source code. private version of Level 3 script with my accumulated script processing skills or a large number of custom functions. I had a private function library built in past two years. Level 5 scripts use many of them to achieve private trading strategy.
