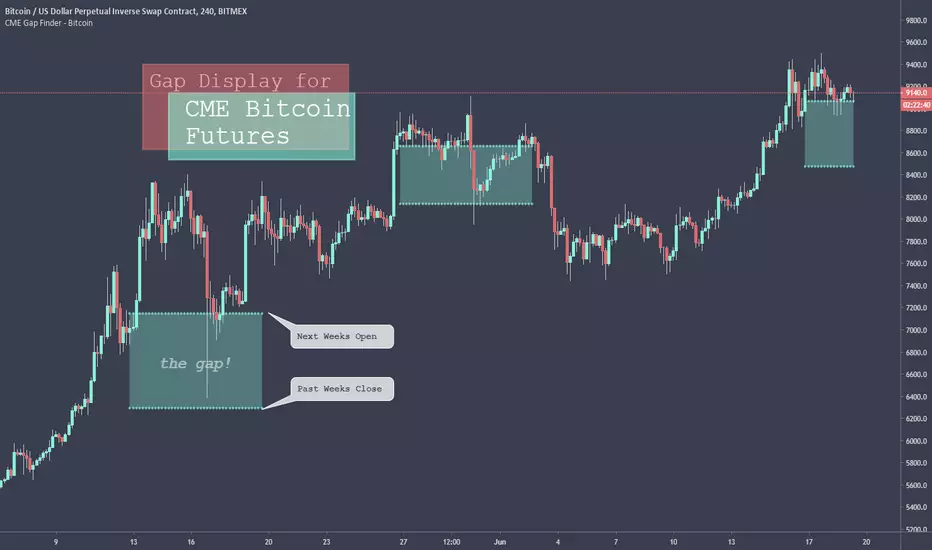
CME Gap Finder - BitcoinOnly for Bitcoin!
This indicator locates weekly gaps created by the CME Futures market for Bitcoin.
As you can see, Bitcoin tends to close the weekly gaps created in the futures market so I thought this could be a very useful tool.
Instead of having to look between multiple charts, this simply overlays the past weeks open and close should a gap appear.
I hope you find this indicator useful!
Cheers!
Recherche dans les scripts pour "bitcoin"
Bitcoin: Pi Cycle Top & Bottom | QuantumResearchBitcoin: Pi Cycle Top & Bottom | QuantumResearch
Adaptive Deviation Model for Bitcoin Macro Extremes
Bitcoin: Pi Cycle Top & Bottom by QuantumResearch is a proprietary interpretation of the famous Pi Cycle concept—enhanced with normalized deviation logic, adjustable thresholds, and visual clarity. Unlike traditional models that simply cross two moving averages, this tool calculates the dynamic spread between a short-term and amplified long-term exponential average, delivering a continuous score that adapts to Bitcoin's evolving volatility profile.
🧠 What Makes It Unique?
🔹 Pi Deviation Engine:
This creates a centered, symmetric oscillator that better visualizes overextended conditions—something the original Pi Cycle model does not offer.
🔹 Dynamic Zoning via Thresholds:
Users can set custom top and bottom thresholds to adjust sensitivity based on current market regimes, making it more flexible than static crossover models.
🔹 Gradient-Powered Area Fill:
The oscillator plot is filled with directional gradients that react to the score's magnitude, creating an intuitive visual spectrum between bullish and bearish extremes.
🔹 Macro-Focused, Overlay-Free:
The indicator runs in a clean subpanel, preserving chart space and allowing better integration into multi-layered macro dashboards.
🔹 Built for BTC’s Unique Structure:
The moving average lengths and logic are specifically calibrated to Bitcoin’s halving-driven cycles, unlike generic Pi models applied across asset classes.
🔍 Key Features
✅ Continuous Cycle Score (not binary crosses)
✅ Custom upper/lower thresholds for signal flexibility
✅ Visual gradient fill and background shading
✅ Zero chart clutter (non-overlay)
✅ Fully customizable moving average lengths
✅ Designed for macro cycle top/bottom detection
📌 Ideal For:
Long-term Bitcoin investors
Macro traders and analysts
Those seeking early warning signs of euphoria or despair
Anyone using on-chain + cyclical tools to time large market pivots
⚠️ Disclaimer
This indicator is for educational and research purposes only.
It does not provide financial advice or guarantees.
Past performance does not predict future behavior.
Always confirm with additional tools and analysis.

Pi Cycle Bitcoin Top and Bottom (Daily)Pi Cycle Bitcoin Top and Bottom (Daily)
This indicator combines the renowned Pi Cycle Top and Pi Cycle Bottom indicators into one comprehensive tool designed to identify Bitcoin's market cycle tops and bottoms with precision.
Pi Cycle Top
The Pi Cycle Top indicator uses the 111-day moving average (111DMA) and a multiple of the 350-day moving average (350DMA x 2). Historically, this indicator has identified Bitcoin’s price cycle peaks with an accuracy of up to 3 days.
📈 When the 111DMA crosses above the 350DMA x 2, it signals a market cycle top.
Pi Cycle Bottom
The Pi Cycle Bottom indicator utilizes the 150-day exponential moving average (150EMA) and a multiple of the 471-day simple moving average (471SMA x 0.745). Over past cycles, this combination has effectively pinpointed Bitcoin’s market bottoms with the same level of accuracy.
📉 When the 150EMA crosses below the 471SMA x 0.745, it signals a market cycle bottom.
Parabola
As an additional feature, the indicator identifies moments when the 150EMA crosses back above the 471SMA x 0.745, suggesting a potential parabolic price movement.
Features
Precision: Both indicators have historically aligned with major market turning points.
Customizable settings: Adjust the short and long moving averages to fit your analysis needs.
Alerts: Real-time alerts can be enabled for identifying market tops and bottoms.
Clear visualization: Optional moving average lines and signal markers make it easy to track market trends.
Full credits to Philip Swift, PositiveCrypto, Tondy, BilzerianCandle.

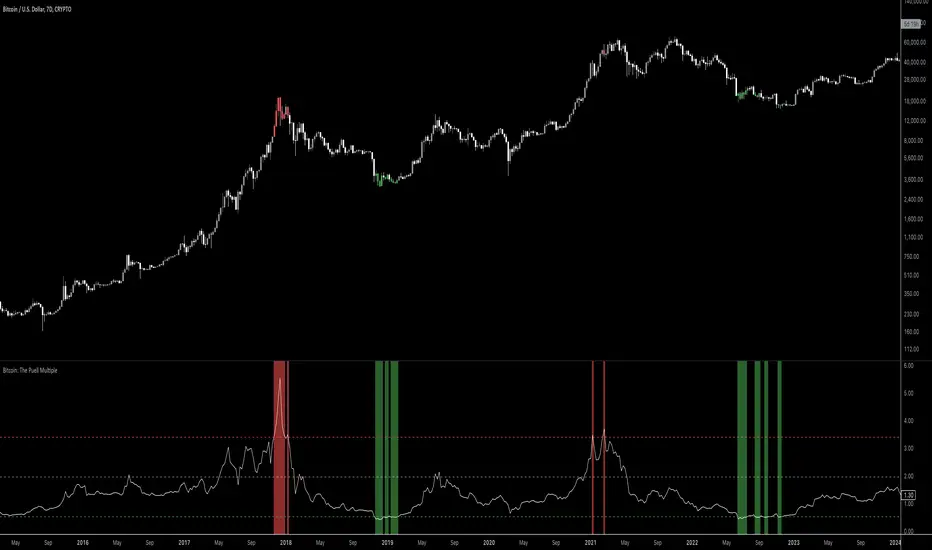
Bitcoin: The Puell MultipleBitcoin: The Puell Multiple Indicator Overview
The Puell Multiple is an indicator originally used to analyze Bitcoin's valuation based on mining revenue. However, this approximate version uses Bitcoin's current price to give us a similar perspective. It’s helpful for understanding whether Bitcoin’s price is currently high or low compared to its historical trend.
Recommended Timeframe:
For optimal insights, it’s recommended to use this indicator on the weekly timeframe. This timeframe smooths out daily fluctuations, making it easier to capture long-term valuation trends and better understand market cycles.
What Does the Indicator Show?
This indicator compares the current price of Bitcoin to its average price over the past 365 days. Here’s what it helps you see:
When Bitcoin Might Be Undervalued:
If the indicator value is below a certain low threshold (e.g., 0.51 by default), it suggests that Bitcoin might be undervalued compared to its long-term trend. Historically, periods where the indicator is low have sometimes coincided with good buying opportunities, as Bitcoin is seen as “cheap” in relation to its recent average.
When Bitcoin Might Be Overvalued:
If the indicator value is above a certain high threshold (e.g., 3.4 by default), it suggests that Bitcoin might be overvalued. In the past, these high points have sometimes signaled times to consider selling, as Bitcoin is viewed as “expensive” relative to its recent trend.
How to Read the Indicator
Indicator Line: The main line in the indicator panel shows the value of the Puell Multiple over time, fluctuating based on the comparison between current and past prices.
Threshold Lines: Two horizontal lines represent the high and low thresholds:
Bottom Threshold (Red Line): Indicates a high value, suggesting that Bitcoin might be overvalued.
Top Threshold (Green Line): Indicates a low value, suggesting that Bitcoin might be undervalued.
Color Coding:
The background may appear green when the indicator is below the low threshold (suggesting undervaluation) or red when it’s above the high threshold (suggesting overvaluation).
How You Can Use This Indicator
Long-Term Investment Insights: This indicator can help you identify favorable buying or selling conditions based on historical price trends. When the value is low, Bitcoin might be in a more attractive price range; when it’s high, the price might be inflated compared to its yearly trend.
Market Timing: This tool is best used alongside other indicators, as it’s primarily helpful for understanding broader trends rather than predicting short-term movements.
The Puell Multiple (Approximate) indicator thus offers a historical lens on Bitcoin’s valuation, helping you make decisions informed by past price trends. For best results, keep in mind the weekly timeframe recommendation to capture meaningful market cycles.
Intellect_city - Halvings Bitcoin CycleWhat is halving?
The halving timer shows when the next Bitcoin halving will occur, as well as the dates of past halvings. This event occurs every 210,000 blocks, which is approximately every 4 years. Halving reduces the emission reward by half. The original Bitcoin reward was 50 BTC per block found.
Why is halving necessary?
Halving allows you to maintain an algorithmically specified emission level. Anyone can verify that no more than 21 million bitcoins can be issued using this algorithm. Moreover, everyone can see how much was issued earlier, at what speed the emission is happening now, and how many bitcoins remain to be mined in the future. Even a sharp increase or decrease in mining capacity will not significantly affect this process. In this case, during the next difficulty recalculation, which occurs every 2014 blocks, the mining difficulty will be recalculated so that blocks are still found approximately once every ten minutes.
How does halving work in Bitcoin blocks?
The miner who collects the block adds a so-called coinbase transaction. This transaction has no entry, only exit with the receipt of emission coins to your address. If the miner's block wins, then the entire network will consider these coins to have been obtained through legitimate means. The maximum reward size is determined by the algorithm; the miner can specify the maximum reward size for the current period or less. If he puts the reward higher than possible, the network will reject such a block and the miner will not receive anything. After each halving, miners have to halve the reward they assign to themselves, otherwise their blocks will be rejected and will not make it to the main branch of the blockchain.
The impact of halving on the price of Bitcoin
It is believed that with constant demand, a halving of supply should double the value of the asset. In practice, the market knows when the halving will occur and prepares for this event in advance. Typically, the Bitcoin rate begins to rise about six months before the halving, and during the halving itself it does not change much. On average for past periods, the upper peak of the rate can be observed more than a year after the halving. It is almost impossible to predict future periods because, in addition to the reduction in emissions, many other factors influence the exchange rate. For example, major hacks or bankruptcies of crypto companies, the situation on the stock market, manipulation of “whales,” or changes in legislative regulation.
---------------------------------------------
Table - Past and future Bitcoin halvings:
---------------------------------------------
Date: Number of blocks: Award:
0 - 03-01-2009 - 0 block - 50 BTC
1 - 28-11-2012 - 210000 block - 25 BTC
2 - 09-07-2016 - 420000 block - 12.5 BTC
3 - 11-05-2020 - 630000 block - 6.25 BTC
4 - 20-04-2024 - 840000 block - 3.125 BTC
5 - 24-03-2028 - 1050000 block - 1.5625 BTC
6 - 26-02-2032 - 1260000 block - 0.78125 BTC
7 - 30-01-2036 - 1470000 block - 0.390625 BTC
8 - 03-01-2040 - 1680000 block - 0.1953125 BTC
9 - 07-12-2043 - 1890000 block - 0.09765625 BTC
10 - 10-11-2047 - 2100000 block - 0.04882813 BTC
11 - 14-10-2051 - 2310000 block - 0.02441406 BTC
12 - 17-09-2055 - 2520000 block - 0.01220703 BTC
13 - 21-08-2059 - 2730000 block - 0.00610352 BTC
14 - 25-07-2063 - 2940000 block - 0.00305176 BTC
15 - 28-06-2067 - 3150000 block - 0.00152588 BTC
16 - 01-06-2071 - 3360000 block - 0.00076294 BTC
17 - 05-05-2075 - 3570000 block - 0.00038147 BTC
18 - 08-04-2079 - 3780000 block - 0.00019073 BTC
19 - 12-03-2083 - 3990000 block - 0.00009537 BTC
20 - 13-02-2087 - 4200000 block - 0.00004768 BTC
21 - 17-01-2091 - 4410000 block - 0.00002384 BTC
22 - 21-12-2094 - 4620000 block - 0.00001192 BTC
23 - 24-11-2098 - 4830000 block - 0.00000596 BTC
24 - 29-10-2102 - 5040000 block - 0.00000298 BTC
25 - 02-10-2106 - 5250000 block - 0.00000149 BTC
26 - 05-09-2110 - 5460000 block - 0.00000075 BTC
27 - 09-08-2114 - 5670000 block - 0.00000037 BTC
28 - 13-07-2118 - 5880000 block - 0.00000019 BTC
29 - 16-06-2122 - 6090000 block - 0.00000009 BTC
30 - 20-05-2126 - 6300000 block - 0.00000005 BTC
31 - 23-04-2130 - 6510000 block - 0.00000002 BTC
32 - 27-03-2134 - 6720000 block - 0.00000001 BTC

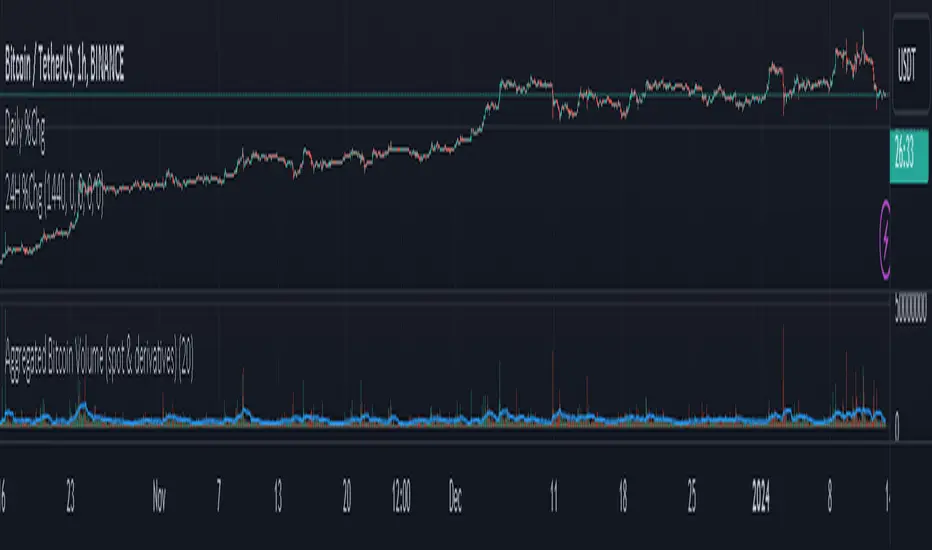
Aggregated Bitcoin Volume (spot & derivatives)AGGREGATED BITCOIN VOLUME INDICATOR (spot & derivatives)
This indicator aggregates volume for the most liquid bitcoin pairs AND instruments, from exchanges known to *not* have fake volume. A few legit exchanges are missing as not available in Tradingview at the moment (e.g. FTX US).
Volume is separated into four categories: spot (stablecoin pairs), spot (fiat pairs), derivatives (perpetuals), and tradfi derivatives (CME futures). Can plot them all four together (default setting) or individually.
Volume is "aggregated in equivalent number of bitcoin" (default setting) -- although users can change that to "aggregated in total USD". Doing so required converting volume for some bitcoin pairs and (derivatives) contracts that don't record volume in number of bitcoin (but rather record it in USD or number of contracts).
Volume from crypto futures contracts (i.e. not Tradfi) is missing given how these contracts expire, and rolling them over would require extensive manual input. Futures' volume track perpetuals' volume, and are considerably smaller than perpetuals', therefore its absence does not have a noticeable impact on output. Time series for CME futures don't suffer from this inconvenient as the CME offers a continuous time series.
For the sake of simplicity, the price time series used for normalizing volume into BTC units is Bitstamp's (as it is the longest time series available).
List of exchanges included: Binance, Binance US, OKX, Huobi, FTX, Bittrex, Gate, Kucoin, Poloniex, Coinbase, Bitfinex, Bitstamp, Gemini, Bitflyer, Upbit, Kraken, Bybit, Bitmex, Deribit, CME
List of pairs/instruments that had to be converted from total USD into number of bitcoin: FTX:BTCUSDT, FTX:BTCUSD, BITMEX:XBTUSD, BYBIT:BTCUSD, DERIBIT:BTCPERP, FTX:BTCPERP
List of pairs/instruments that had to be converted from number of contracts into number of bitcoin: BINANCE:BTCPERP, OKEX:BTCPERP, OKEX:BTCUSDTPERP, CME:BTC
Final note: I recommend to look at aggregated bitcoin volume in bitcoin (not in USD) and for all categories (spot and derivatives) to get a better picture of what's happening in the market. Looking at volume in USD rather than in BTC makes volume obviously dependent on bitcoin's price. This is a major problem for volume analysis. Given how volatile BTCUSD is, price then accounts for most of the variance in volume, making volume comparisons across time difficult.
If you have any suggestions please drop them in the comments.
MacroCorrelation (Bitcoin Real Value)The best minds in the financial world think about how to determine the real value of an asset.
I constantly say that it is necessary to buy an asset only at the moment when its market price is below or equal to its fundamental value. Let's see what is the difference between these two concepts.
Fundamental value
Imagine that we decided to grow and sell, for example, strawberries. For this, we purchased the necessary equipment, tools, fertilizers, seeds, and more. Let's say that we needed $ 3000 for this purpose.
To facilitate the task, in our calculation we will not take into account all types of possible costs (electricity cost, workers' wages, necessary tax deductions, etc.).
If we had to take a loan to meet the initial needs, for example, at 10% per annum , then each borrowed $ 1000 in a year would cost us $ 1100. That is, $ 3000 would cost us $ 3300 per year.
Let's agree that our initial funds were completely enough to buy everything we needed, and we didn't need to take out a loan at a certain percentage. In this case, we exclude from the calculation the cost of the capital required to start your own business.
Suppose we managed to harvest 100 kg of strawberries. This means that the real value (fundamental value) of 1 kg of our strawberries is $ 30.
Market price
Things are a little different with the market price. The market price is determined by the volume of supply and demand for a particular product or service at a particular point in time.
By demand, we mean the intention to purchase a product or service (secured by the ability to pay a set price for it). A need that exceeds solvency is not a demand.
By offer, we mean the willingness to provide ownership (use) of the object of demand for a certain fee.
Simply put, the market price is the price at which the buyer is willing to buy (and the seller to sell) the volume of goods we need.
In our case, the price at which we sell 1 kg of our strawberries will depend on how much people really need our strawberries.
If we are the only sellers of strawberries in a certain territory and, at the same time, buyers really want to taste fresh strawberries, its market price can be as high as the last buyer is able to pay. If not, everything will depend on how high quality our product will be for its price. At the same time, the price constantly varies over a certain period of time ( seasonality and other factors). For example, if in winter we could sell 1 kg of our strawberries for $ 90, then in summer for $ 50. Strawberry prices range from $ 50 to $ 90.
Magic formula
We now understand what is the difference between fundamental value and market price. If the first is made up exclusively of a set of real metrics, the second is a variable factor that depends primarily on “human factors” (what is the maximum price the buyer is willing to pay, what is the minimum price the seller is willing to set at a particular moment in time).
You should try to buy an asset only at the moment when its market price is below or equal to its fundamental value.
However, how can you independently determine the fundamental value of an asset?
Unfortunately, there is no universal answer to this question, just as there is no universal “magic formula” in nature (my sincere respect, Joel Greenblatt) that could determine the fundamental value of any asset on the planet. The point is precisely in the criterion of universality. If we consider each asset (or at least the market) separately, we can well determine its fundamental value.
Even those things that seem free to us in everyday life (just their cost are negligible) have a fundamental value.
Three factors to assess the fundamental value of Bitcoin
Let's try to take a separate asset, for example Bitcoin , and do with it everything that we did earlier with our “strawberry business”.
When assessing the real (fundamental) value of Bitcoin , we will take into account 3 main factors.
1. The maximum possible and current supply in the Bitcoin market
The reward for mining a Bitcoin block is halved every 210,000 blocks. This fact is called halving (halving). When all blocks are mined, the total amount of existing bitcoins will be 21 million coins.
Accordingly, the maximum supply in the Bitcoin network will not exceed 21 million coins.
In reality, things are even better, since this volume also includes a certain amount of lost coins. By lost, we mean all those coins whose “private keys” the last owner no longer has access to. For example, at the time of the appearance of Bitcoin in 2009, its real value was doubtful and not obvious to most of its owners, many of whom did not pay due attention to understanding the safe storage of an asset, periodically losing access to hundreds and thousands of coins.
As a result, we understand that the total supply in the Bitcoin market will be significantly less than 21 million coins.
To evaluate the proposal, it is not enough to understand how much of the asset exists, because a certain amount of it, as we have already understood, can either be lost or be blocked for a long time. It is also important to take into account the criterion of “supply in time”. That is, the current total “liquidity” of the network.
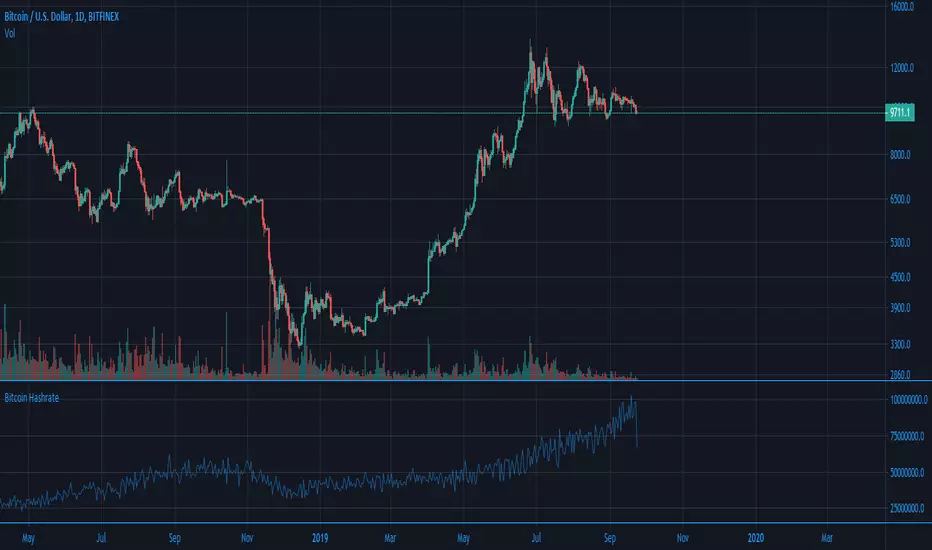
2. Bitcoin network hashrate
The main indicator of the viability and stability of the Bitcoin network is the hash rate (computing power). Stable hashrate = network security.
3. The real value of the US dollar
When analyzing the Bitcoin / Dollar pair, in addition to the real value of Bitcoin , it is also necessary to take into account the real value of the US Dollar .
It is believed that assets such as stocks or cryptocurrencies are extremely volatile (the price can change over a wide range within a relatively short period of time). At the same time, to reduce volatility , experts advise using the so-called “currency baskets”.
A currency basket is a certain percentage of foreign currencies in which the investor's capital can be distributed. The ratio of currency units in the basket is used to reduce the potential risk of currency fluctuations.
The main problem is that, due to inflation , the purchasing power of the currencies themselves drops significantly over time.
With the $ 100 we earned in 1913, already in the 1920s we could have purchased 50% fewer goods and services than before. In the 1980s, it was 90% less, and in the 2010s it was already 98% less.
This fact must also be taken into account when assessing the real value of Bitcoin , since everything is relative, and in the Bitcoin / Dollar pair, we determine the value of Bitcoin , expressed in US dollars.
The real value of Bitcoin
After assessing the relationship of the factors described above and drawing up a mathematical formula, we can proceed to the analysis of the results. In order to cut off unnecessary noise when constructing the function, we will use the graph for 1 month.
Analyzing the resulting chart, first of all, the following is striking: the fundamental value of Bitcoin grows over time. This is due to the gradual expansion of the "user base" of the network, as well as the growth of its popularity among investors of completely different classes.
I propose to compare the graph obtained earlier with the graph of Internet users (in% of the number of adult US citizens ). Similar, don't they?
The more the number of Internet users, the higher its influence and economic potential. The more the number of users of the Bitcoin network, the higher its economic potential and fundamental value.
However, understanding the fundamental value alone is not enough. We, as investors, first of all need to understand when to buy any asset.
To do this, compare the chart of the market price of Bitcoin with the chart of its fundamental value obtained earlier.
Now that we have a complete picture of what is happening and understand both the fundamental value of the asset and its market price, the fact of the numerical prevalence of the price over the fundamental value for 116 out of 133 months becomes quite clear. Periods of Bitcoin being below its fundamental value are extremely rare and only take ~ 13% of the trading time.
For about 87% of all trading time, Bitcoin's market price is above its fundamental value. Those rare periods when traders are willing to sell bitcoin below its fundamental value are an incredible gift for a long-term investor.
Bull and Bear Markets
If you buy Bitcoin (like any other asset) below its fundamental value, this is an absolutely incredible idea in terms of potential profitability, who in their right mind would sell their assets below this mark ?!
It's all about the emotionality of people. Saying “I will not do stupid things when the time is right” is easier than actually maintaining composure. Especially when it comes to money. Your money. And sometimes even dreams.
The classical market theory usually divides the market into two main phases: A bull market is a period of time during which the price rises systematically (accordingly, the demands and expectations of traders gradually grow). A bear market is a period of time during which the price gradually falls (accordingly, traders' requests and expectations gradually fall).
There is also the concept of “correction”: A correction is a temporary change in the price of an asset, contrary to the main trend.
For the current day, there is not a single clear criterion that separates the concept of a bear / bull market from the concept of a correction. However, we can say with confidence that the market change (from bullish to bearish or from bearish to bullish ) is interconnected with the fundamental factors of the market. Corrections, on the other hand, have significantly less connection with fundamental indicators.
and are rather related to the “physiology of the market” (nothing can only rise in price every unit of time for a significantly long time, nothing can only fall in price every unit of time for a significantly long time).
In this case, the most rational would be to define a bear market as a delay in updating the absolute historical highs of the price with a preliminary touch of the fundamental value.
Buying below the fundamental value is always a smarter idea than buying above the fundamental value, since, in most cases, it is the touch of the fundamental value that globally separates a bear and a bull market.
Fun fact: If we were to buy Bitcoin every time it touched the fundamental value, the average buy price as of July 2021 would be $ 1,506.65, which is 87% less than the current fundamental value of Bitcoin .
Conclusions
1. The total amount of Bitcoins , as well as the speed of their production (mining) over time, are programmatically limited, which limits the volume of the maximum possible supply
2. Bitcoin is transported, which means that the volume of supply for the current minute will also depend on the actual volume of assets available for sale
3. The viability of the network is based on the amount of computer power supporting it (network hash rate)
4. When analyzing the Bitcoin / Dollar pair, in addition to the real value of Bitcoin , it is also necessary to take into account the real value of the US Dollar
5. Price ≠ fundamental value
6. Buying below the fundamental is always a smarter idea than buying above the fundamental.
7. Don't believe the headlines of financial news and the public words of financiers
8. Selling strawberries can make a fortune too

Metcalfes Law - Bitcoin Fair PriceMetcalfe's Law has been successfully used to value a variety of network effect technologies and businesses, including Facebook and Tencent.
Applying Metcalfe's Law to Bitcoin, using "Daily Active Addresses" (DAA) as the "n" value, yields interesting results.
Historically, Bitcoin has tracked the Metcalfe Law Fair Price reasonably well. A number of studies have been performed over recent years which validate this and have used various derivations of Metcalfe’s Law. Note: this indicator sticks to the original Metcalf’s Law.
Prior to 2018, every time Bitcoin was above the Metcalfe’s Law fair price (calculated using a default “A” of 0.5 here), a bubble had formed, and price quickly reverted back down to the mean.
Nonetheless, since February 2018, Metcalfe's Law Fair Price has remained below the actual Bitcoin price, suggesting Bitcoin is currently overvalued.
There may be a few reasons for this:
1. Possibility A: Bitcoin may still be extremely overvalued. Since the December 2017 peak, Bitcoin has only reverted to the Metcalfe’s Law Fair Price briefly during the December 2018 bottom. If this case is true, there could be further to fall unless DAA numbers pick up to fill the gap.
2. Possibility B: The introduction of side-chains, private transactions and the Lightning Network may have fundamentally altered the effectiveness of using DAA to value Bitcoin. As more daily transactions are completed off-chain, or on large platforms/exchanges which use fewer addresses, the relative number and growth of DAA may be misrepresented and artificially low. In this case, DAA as it is reported today is no longer useful in assessing the fair value of Bitcoin with Metcalfe’s Law and this Indicator is effectively useless.
3. Possibility C: Neither of the above are true. We are just in an anomalous period in which price and Metcalfe’s Law Fair Price have deviated from the mean for an extended period (and will meet again in the future, potentially at a higher price).
4. Possibility D: Metcalfe’s Law doesn’t really work for Bitcoin.
I am inclined to believe Possibilities “C” and “D” are unlikely. Given the way Bitcoin infrastructure is being developed and used in 2019, Possibility “B” seems the most likely, as this case is supported by the fact that a number of other metrics indicate that Bitcoin is currently on the lower side of “fair value” (including Dynamic Range NVT Signal).
Regardless, Possibility “A” remains a strong candidate. Only time will tell. It will be interesting to check back on this indicator in 12-24 months time. Hopefully this indicator has been proven redundant by then.

Creating long term bitcoin data
One of the problems, with bitcoin, is that we miss long term bitcoin data. There is not a single source from which to gather the value of bitcoin in any moment from it's inception. Or at least from when it was first exchanged into exchanges. If you look at coinmarketcap the data go back to the 28 apr 2013. But mtgox started in July 2010. If you go to yahoo, you will be able to gather data, but once you start working with this data you soon find out how poor is it. Basically it follows mtgox data while mtgox was alive, and then switched to some other exchange. But this means that we see a sudden jump in data which makes any indicator go wild. Basically it's really difficult to gather long term data on bitcoin. Also consider that mtgox did not just "go away" when it stopped trading. But in the database here it is still present with the fixed exchange rate of when it stopped.
So I tried to create the data we need. How? By taking three exchanges, and taking the median between them. The three exchanges I took were MTGOX: , BITFINEX: and KRAKEN: XBTUSD . We cannot avoid mtgox because it's the only source of data for the first years. But then as soon as the other exchanges come in we are going to use the median between them.
The indicator must be overlaid on another chart. And I use the forex usdeur which I then hide (If someone has a better idea, maybe something which is open 24/7, I would be happy to hear it).

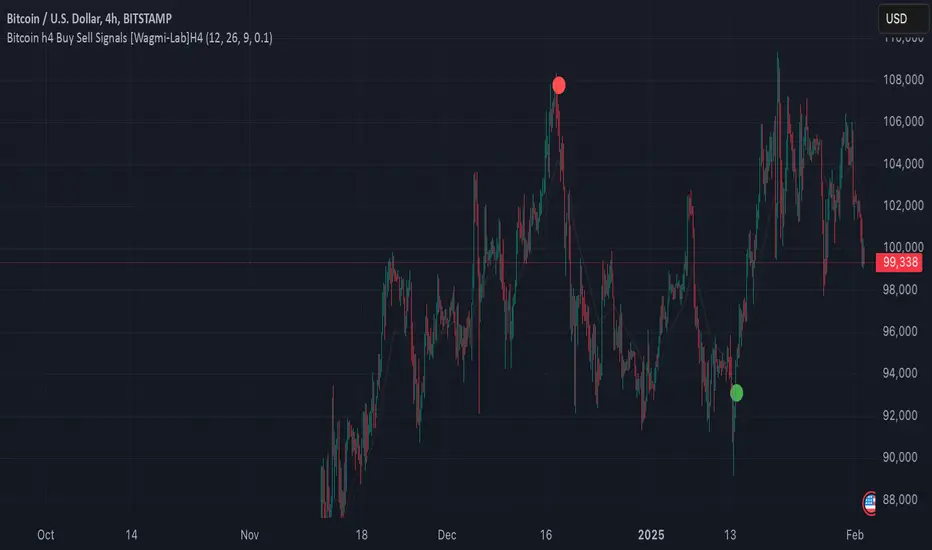
Wagmi Lab- Bitcoin H4 Buy Sell Signals This indicator, designed primarily for Bitcoin on the H4 timeframe, is a versatile tool that can also be applied to other assets and timeframes by adjusting its parameters. It combines Exponential Moving Averages (EMAs), MACD (Moving Average Convergence Divergence), and a crossover filtering mechanism to generate reliable buy and sell signals. The indicator is ideal for traders looking to identify trend direction and potential entry/exit points with added precision.
Key Features:
Customizable EMAs and MACD:
Fast EMA (default: 12): Tracks short-term price momentum.
Slow EMA (default: 26): Tracks long-term price momentum.
Signal SMA (default: 9): Smooths the MACD line to generate the signal line.
MACD Crossover Signals:
The indicator calculates the MACD line and signal line to identify potential buy and sell opportunities.
Buy signals are generated when the MACD line crosses above the signal line, indicating bullish momentum.
Sell signals are generated when the MACD line crosses below the signal line, indicating bearish momentum.
Crossover Strength Filter:
A minimum crossover distance percentage (default: 0.1%) ensures that only significant crossovers are considered, reducing false signals.
This filter helps traders avoid weak or insignificant crossovers that may not lead to strong price movements.
Trend Visualization:
The indicator highlights the trend direction by filling the area between the fast and slow EMAs with colors:
Green: Uptrend (MACD > Signal Line).
Red: Downtrend (MACD < Signal Line).
Buy/Sell Signal Markers:
Buy signals are marked with green circles below the price bars.
Sell signals are marked with red circles above the price bars.
These markers provide clear visual cues for potential entry and exit points.
Adaptable to Other Timeframes and Assets:
While optimized for the H4 timeframe, the indicator can be adjusted for other timeframes (e.g., M15, H1, D1) by modifying the EMA and SMA settings.
It can also be applied to other assets, such as stocks, forex, or commodities, by tweaking the parameters to suit the asset's volatility and characteristics.
How to Use:
Identify Trends:
Use the colored areas (green for uptrend, red for downtrend) to determine the overall market direction.
Wait for Confirmation:
Look for buy or sell signals (green or red circles) that align with the trend direction.
Ensure the crossover meets the minimum distance requirement to filter out weak signals.
Enter and Exit Trades:
Enter a long position when a buy signal appears during an uptrend.
Enter a short position or exit a long position when a sell signal appears during a downtrend.
Adjust Settings for Other Timeframes/Assets:
Experiment with the EMA and SMA periods to optimize the indicator for different timeframes or assets.
Why Use This Indicator?
Precision: The crossover strength filter reduces noise and false signals.
Versatility: Works across multiple timeframes and assets with customizable settings.
Visual Clarity: Clear trend visualization and signal markers make it easy to interpret.
This indicator is a powerful tool for traders seeking to capitalize on Bitcoin's volatility or other assets' price movements, providing a structured approach to identifying trends and potential trading opportunities.
Leonid's Bitcoin Sharpe RatioThe Sharpe ratio is an old formula used to value the risk-adjusted return of an asset. It was developed by Nobel Laureate William F. Sharpe. In this case, I have applied it to Bitcoin with an adjustable look-back date.
The Sharpe Ratio shows you the average return earned after subtracting out the risk-free rate per unit of volatility (I've defaulted this to 0.02 ).
Volatility is a measure of the price fluctuations of an asset or portfolio. Subtracting the risk-free rate from the mean return allows you to understand what the extra returns are for taking the risk.
If the indicator is flashing red, Bitcoin is temporarily overbought (expensive).
If the indicator is flashing green, Bitcoin is temporarily oversold (cheap).
The goal of this indicator is to signal out local tops & bottoms. It can be adjusted as far as the lookback time but I have found 25-26 days to be ideal.

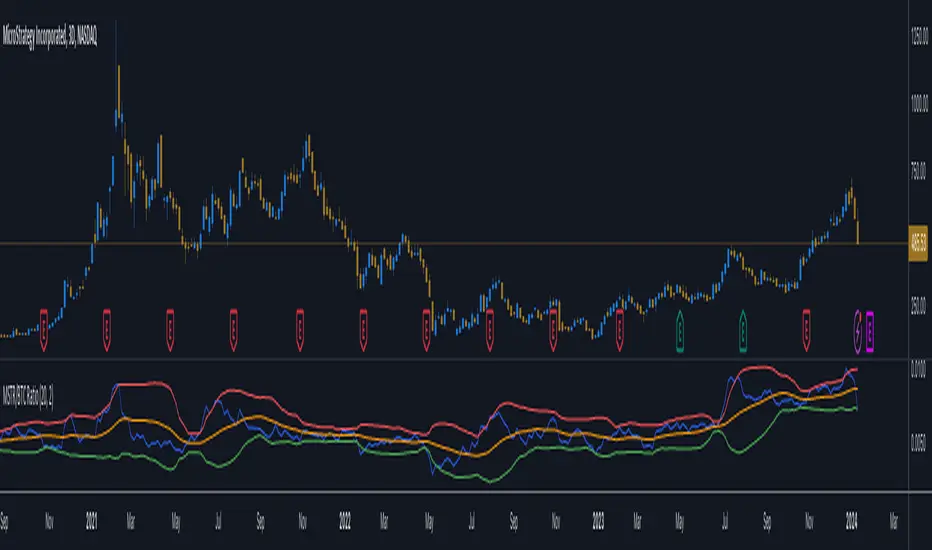
MicroStrategy / Bitcoin Market Cap RatioThis indicator offers a unique analytical perspective by comparing the market capitalization of MicroStrategy (MSTR) with that of Bitcoin (BTC) . Designed for investors and analysts interested in the correlation between MicroStrategy's financial performance and the Bitcoin market, the script calculates and visualizes the ratio of MSTR's market capitalization to Bitcoin's market capitalization.
Key Features:
Start Date: The script considers data starting from July 28, 2020, aligning with MicroStrategy's initial announcement to invest in Bitcoin.
Data Sources: It retrieves real-time data for MSTR's total shares outstanding, MSTR's stock price, and BTC's market capitalization.
Market Cap Calculations: The script calculates MicroStrategy's market cap by multiplying its stock price with the total shares outstanding. It then forms a ratio of MSTR's market cap to BTC's market cap.
Bollinger Bands: To add a layer of analysis, the script includes Bollinger Bands around the ratio, with customizable parameters for length and multiplier. These bands can help identify overbought or oversold conditions in the relationship between MSTR's and BTC's market values.
The indicator plots the MSTR/BTC market cap ratio and the Bollinger Bands, providing a clear visual representation of the relationship between these two market values over time.
This indicator is ideal for users who are tracking the impact of Bitcoin's market movements on MicroStrategy's valuation or vice versa. It provides a novel way to visualize and analyze the interconnectedness of a leading cryptocurrency asset and a major corporate investor in the space.
TARVIS Labs - Bitcoin Macro Bottom/Top SignalsSCRIPT DESCRIPTION
This is a script specifically written to help provide indicators from a macro view. This script is best run on the 1 day interval on Bitstamp's $BTCUSD chart. It helps indicate when to accumulate bitcoin, and when its in a bull run when there are local tops, strong top warnings, and a signal to exit a bull run. This is described further below.
If you don't have interest in trading on the way to the top I suggest turning off the following indicators in the settings of the indicator:
- Opportunity To Buy Back In Indicator
- Local Top Near Bull Run Top Indicator
ACCUMULATION ZONE INDICATOR - LIGHT GREEN
Description
When we look at the history of Bitcoin every bottom has crossed below the 100 week EMA. Once it does its accompanied by hash ribbon cross with miner capitulation. After that is the prime time to accumulate as theres a clearer signal the bottom is in. Specifically, a signal to look for is the 14 day MACD/signal cross and the 14 day MACD continuing to stay above the signal until the price returns above the 100 week EMA. This is prime accumulation territory.
Strategy for Usage
A good strategy to use when accumulating the bottom is dollar-cost averaging over a 30 day period. The accumulation zone can last longer than 30 days but 30 days is a good range of time to DCA.
STRONG BUY IN ACCUMULATION ZONE INDICATOR - DARK GREEN
Description
We can add to the bottoming signal by looking for post-downtrend reversals inside the bottoming signal. We do this by using a 9/19 daily cross.
Strategy for Usage
These post-downtrend reversals can potentially provide better targeted days for accumulation than the broader bottoming signal and can be used to add more on that day than on an average day for the dollar cost average strategy. Say for example, use 1/3 of funds on these days rather than 1/30th.
OPPORTUNITY TO BUY BACK IN INDICATOR - BLUE
Description
When the 1d 18 EMA > 1d 63 EMA and the 12/52 1d crosses. These together provide good buy opportunities to buy bitcoin.
Strategy for Usage
If you happen to find yourself out of the market from your own TA or a trade, this signal can provide a buy opportunity to reenter the market if you're out of it.
BULL RUN LOCAL TOP INDICATOR - ORANGE
Description
We will similarly use the 100 week EMA to determine trend reversal into a bull run. When we see the 100 week EMA uptrending, we can begin to look for local tops using the 9/19 daily MACD/signal bearish cross along with the 12 EMA having a negative slope, which could be the beginning signal for a local top.
Strategy for Usage
This is a rather light indicator, but can be used in tandem with your own technical analysis to determine if you want to reenter after you exit from its signal.
LOCAL TOP NEAR BULL RUN TOP INDICATOR - RED
Description
When the 100 week EMA is in an uptrend we can look for significant loss of momentum in order to determine if a local top is in near a bull run top. Similar to the Bull Run Local Top Indicator, this strategy uses a MACD/signal cross but instead uses the 30/65 day EMAs.
Strategy for Usage
Ideally the right strategy to use here is to exit the market when this indicator starts. When the indicator ends if the "End of Bull Run Indicator" is not showing on the chart you can buy back into the market.
TOP IS LIKELY IN INDICATOR
Description
When the 100 week EMA is in a very strong uptrend and the 9/19 weekly MACD/signal bearish cross occurs, and the 63 EMA begins to downtrend.
Strategy for Usage
This signal typically accompanies the "Local Top Near Bull Run Top Indicator" therefore if you're following the strategy you would likely already be out of the market, but if you're not and this signal fires its a strong signal the top is in and we're likely going to start seeing a strong retrace. This is typically right before we see the "End of Bull Run Indicator". There is only one occurrence where it wasn't followed by a large drop & the "End of Bull Run Indicator" and that was in the 2017 bull run where there were many strong retracements post local top. The likelihood we see that again is low, but if it were to happen you can buy back into the market when the "Top is Likely In Indicator" and the "Local Top Near Bull Run Top Indicator" are not firing.
TOP IS LIKELY IN INDICATOR
Description
When the 100 week EMA is in a strong uptrend and the 9/19 weekly MACD/signal bearish cross occurs, and the 63 EMA begins to downtrend.
Strategy for Usage
This signal typically accompanies the "Local Top Near Bull Run Top Indicator" therefore if you're following the strategy you would likely already be out of the market, but if you're not and this signal fires its a strong signal the top is in and we're likely going to start seeing a strong retrace. This is typically right before we see the "End of Bull Run Indicator". There is only one occurrence where it wasn't followed by a large drop & the "End of Bull Run Indicator" and that was in the 2017 bull run where there were many strong retracements post local top. The likelihood we see that again is low, but if it were to happen you can buy back into the market when the "Top is Likely In Indicator" and the "Local Top Near Bull Run Top Indicator" are not firing.
END OF BULL RUN INDICATOR
Description
When the 100 week EMA is in an uptrend and the 1d 18 EMA crosses the 1d 63 EMA.
Strategy for Usage
When the 100 week EMA is a strong uptrend and the 18/63 cross occurs the top is very likely in. It has occurred in every bull run top leading to the bear market.

[5F] Bitcoin Hash Rate + Miners revenue-═════════════════════════-
📋 Description :
This script display the Bitcoin' Hash Rate and the Miners revenue based on the data provided by Quandl.
Hashrate is displayed in TH/s : trillion hashes per second with an moving average.
Miners revenue is calculated by : (the number of bitcoins mined per day + transaction fees) * market price
The dates of previous halving are also displayed.
🛠 Note :
There is a multiplier on the miners revenue that you can configurate. It's only used to bring the 2 curves closer together for better visibility but the multiplier don't affect the revenue's data.
You can choose between different types of moving average for the hashrate's signal : SMA, EMA, DEMA, TEMA, WMA, VWMA or TMA.
You can show and hide each elements of the indicator
Thanks to all Pinecoders who share their work with the community.
-═════════════════════════-

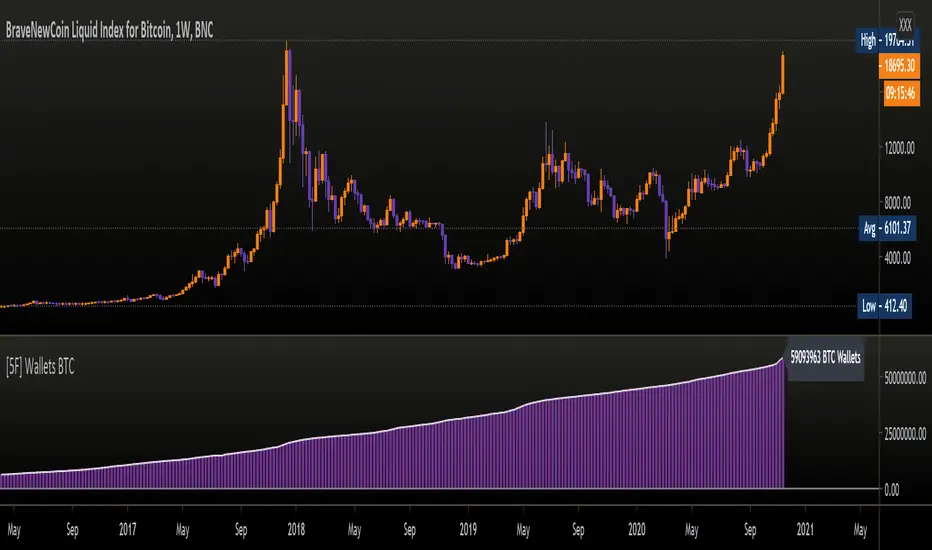
[5F ] Number of Bitcoin wallets-═════════════════════════-
This is a simple script that displays the total number of Bitcoins wallets based on the data provided by Quandl.
Use it in dayli resolution minimum
Refresh every day
Thanks to all Pinecoders who share their work with the community.
-═════════════════════════-
QUICK BITCOIN VALUATION ~ FILBFILBThis indicator uses On chain Transactions and Total Bitcoins to arrive at an under/over valuation.
>1 Overvalued
<1 Undervalued
>2 - Severe Overvaluation
<0.5 Severe Undervaluation
You need to change the scale to Log, i couldn't work out how to do it, if you can tell me i will update the script.
** Review previous day's candles to avoid transactional lag. **

Cyatophilum BITCOIN Daily IndicatorFree indicator
To get it, add it to your favorites using the button below, then you will find it on your chart in the "favorites scripts" tab
I wanted to have a tool that would quickly show me an overview of the Bitcoin chart each day, and receive alerts when something was happening, so I made this indicator.
Optimized for Bitcoin / USD on the daily timeframe, this indicator uses many technical tools such as a double Donchian channel, momentum, volume, RSI, divergences and moving averages.
HOW TO USE
Signals - You can create Automated Alerts corresponding to the graphic labels on chart.
BUY: Most bullish signal. Go long or buy bitcoin if you haven't already.
⚠️ REVERSAL: The bear trend might be over soon. Prepare some stable coins on your exchange to make sure you are ready to trade.
⚠️ RISE: Very bullish signal meaning a lot of people are buying. At this point you should just follow the sheep herd and buy.
⚠️ DROP: A drop is very likely to happen. Take your profits even though the rally can continue. Most of the time the price will drop significantly.
SELL: Most bearish signal. Go short or sell bitcoin.
Note: Use 'Once per bar close' option when creating alerts to get the exact same signals as on the chart, but only at candle close. Otherwise use 'Oncer per bar' to get them as soon as possible but the graphic-signal can disappear (unvalidated) at candle close.
Parameters
"Show 3 EMAs": Show a 50, 100 and 200 EMA. Usefull for golden/death cross.
"Channel_Length" Length in bars for the double Donchian Channel. Default is 30.
Any feedback is welcome!
To get access to my private strategies, use the link below

Ori Unique Bitcoin Addresses UsedThis indicator shows number of unique Bitcoin addresses used . Have options to toggle line/trend view, log on/off and smoothing for line view.

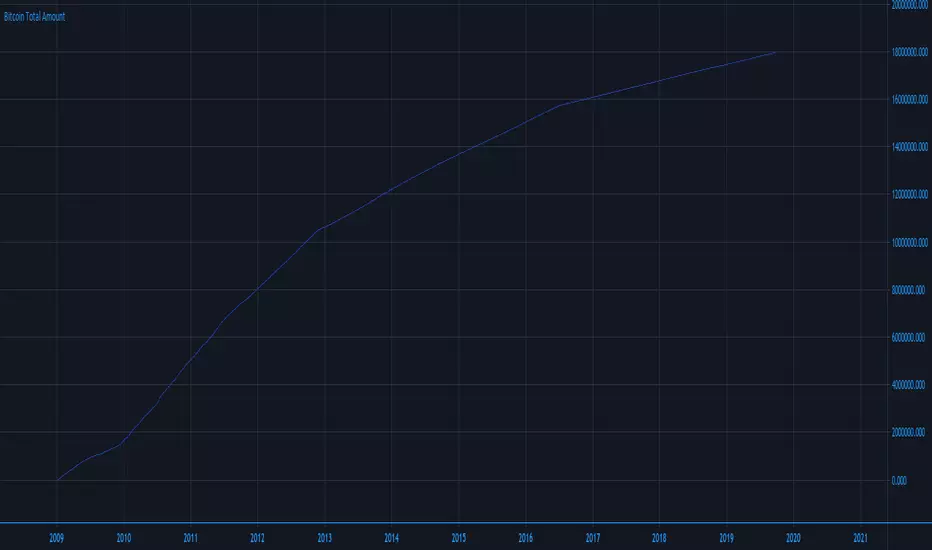
Ori Bitcoin Total AmountThis indicator shows total amount of Bitcoin. Have options to toggle line/trend view, log on/off and smoothing for line view.
Ori Bitcoin HashrateThis indicator shows Bitcoin Hashrate. Have options to toggle line/trend view, log on/off and smoothing for line view.
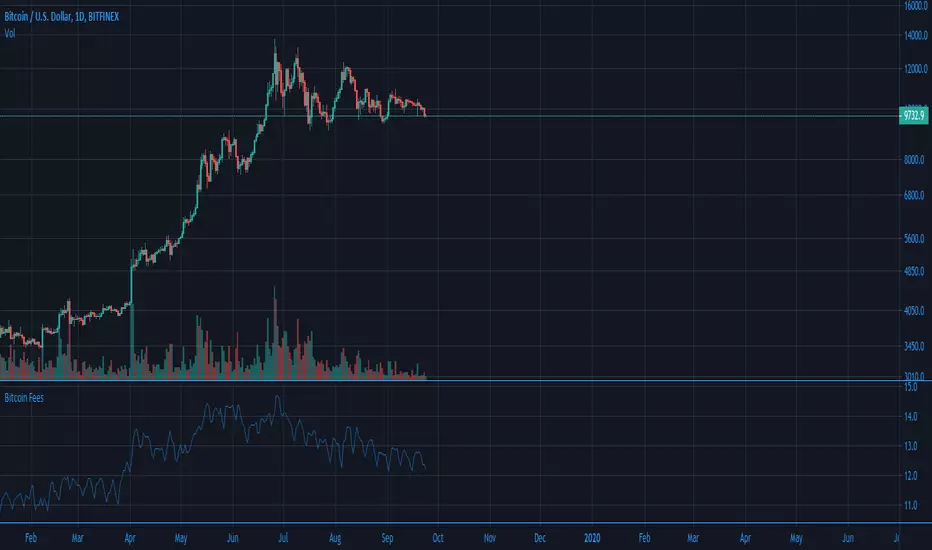
Ori Bitcoin Transaction FeesThis indicator shows natural logarithm of Bitcoin fees with Ori Trend. There is also a toggle for line view.
Slices of Bitcoin
A very simple indicator that shows how many times a currency fits into Bitcoin. In other words, the higher the value, the weaker the currency against Bitcoin.
You can easily see that since the beginning of 2019 Stellar Lumen (XLM) lost half of its BTC-value while the USD-value was constant.

🔗Blockchain Fundamentals - Bitcoin's Stock to Flow Ratio🔗Blockchain Fundamentals - Bitcoin's Stock to Flow Ratio by Cryptorhythms
Intro
What is a stock to flow ratio and why is it important? The stock-to-flow ratio of a commodity is the amount of the asset that is held in reserves divided by the amount produced every year.
The higher the stock-to-flow ratio the reduced inflation occurs on the asset annually. Commodities with a higher stock-to-flow ratio are preferred for their scarcity.
How does it relate to Bitcoin?
Today, Bitcoin has a considerable lower stock-to-flow ratio than gold and this is where the opportunity presents itself. Bitcoin’s software has a core component cooked into the protocol in the form of an event called “the halvening”
‘The halving’ is an event that happens every 210,000 blocks or roughly every 4 years where the block reward given to the miners for securing the network gets halved. For example in 2009 the block reward was 50 BTC and today in 2019 it currently sits at 12.5 BTC with the ETA for next halving happening on Mon, 25 May 2020 which will take reward down to 6.25 BTC.
The idea that Bitcoin is the first ever truly verifiable, non-confiscatable fixed asset to exist is an extremely powerful concept. Without its strong and non-inflatable monetary policy Bitcoin would have a futile attempt of being able to disrupt gold and even accrue value in the first place.
Over the next several decades we will see Bitcoin’s stock-to-flow ratio increase significantly into never before seen water. No other asset will have anywhere near the scarcity of bitcoin.
With the incredible influx of talent coming into the industry to build out the infrastructure (custodial, ETF’s, futures) needed to allow legacy financial institutions to dip their toes in the soon smooth and regulated crypto asset waters. The next few years will be very interesting.
You might say "where will all this capital come from to propel bitcoin to new all time highs?"
1. Well asteroid mining is coming which could well eliminate golds scarcity. Your garden variety metallic asteroid could contain as much gold as half the gold humanity has ever mined!
2. Countries/economies with negative interest rate monetary policy and /or heavy quantitative easing. Their currency supply and debt just keep increasing...
3. Countries looking for ways around the USD dominated and US controlled financial systems (Iran, Russia, Venezuela, North Korea, etc)
4. There's tons more I just wanted to highlight a few.
Usage
You can compare Bitcoin with various other precious metals and commodities from the settings panel. I suggest a logarithmic scale for this indicator, other wise most assets are clumped at the bottom:
There's also plots for the forecasted (estimated) SFR ratios after the 2020 and 2024 Halvings.
👍 Enjoying this indicator or find it useful? Please give me a like and follow! I post crypto analysis, price action strategies and free indicators regularly.
💬 Questions? Comments? Want to get access to an entire suite of proven trading indicators? Come visit us on telegram and chat, or just soak up some knowledge. We make timely posts about the market, news, and strategy everyday. Our community isn't open only to subscribers - everyone is welcome to join.
For Trialers & Chat: t.me
