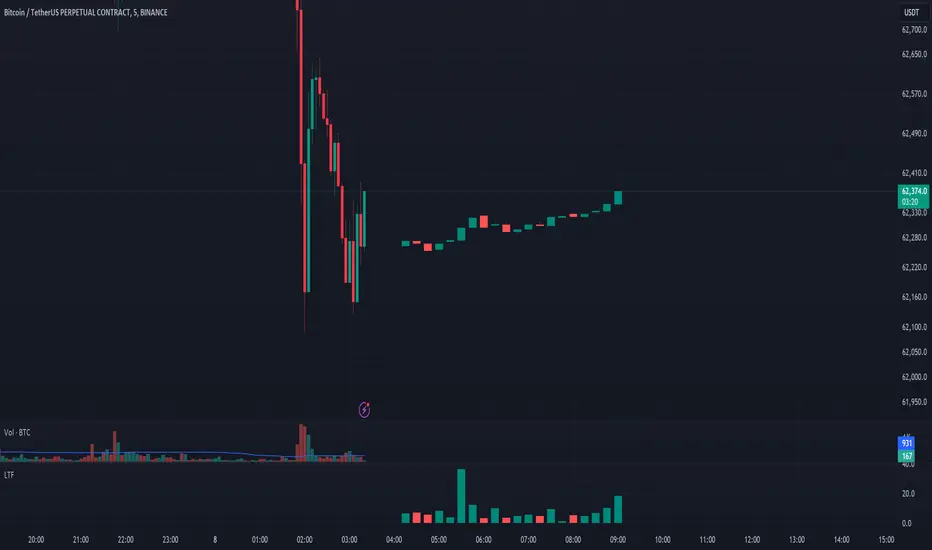
See LTF Candles and VolumeThis indicator will show you the candles, wicks, and their volumes from a lower timeframe chart. You can also select a different symbol in inputs.
This indicator uses requests to receive data from different timeframe or symbols, and it simply draws boxes and lines from the requested data.
Recherche dans les scripts pour "candle"
ICT Single Candle Order Block (SCOB) [UAlgo]The "ICT Single Candle Order Block (SCOB) " designed for traders who utilize the concept of Order Blocks in their trading strategy. Order Blocks are significant price levels where institutions or smart money have placed their trades, leading to potential future price reactions when these levels are revisited. This indicator focuses on identifying and highlighting Single Candle Order Blocks (SCOBs), allowing traders to visually analyze key price levels on their charts.
🔶 What is Single Candle Order Block (SCOB) ?
A Single Candle Order Block (SCOB) is a specific type of Order Block that is identified based on a single candlestick pattern. These patterns indicate potential areas where significant buying or selling interest has occurred, often leading to a notable price reaction when revisited. In the context of this indicator, a bullish SCOB is identified when a specific bullish candlestick pattern is met, and a bearish SCOB is identified based on a bearish candlestick pattern.
Bullish SCOB: Detected when the open price of two bars ago is higher than its close, the close price of the previous bar is higher than its open, the current close price is higher than the open, the low of the previous bar is lower than the low of two bars ago, and the current close is higher than the high of the previous bar.
Bearish SCOB: Detected when the open price of two bars ago is lower than its close, the close price of the previous bar is lower than its open, the current close price is lower than the open, the high of the previous bar is higher than the high of two bars ago, and the current close is lower than the low of the previous bar.
🔶 Key Features
Show Single Candle Order Block (SCOB): Toggle the visibility of the Single Candle Order Blocks on the chart.
Mitigation Method: Choose between "Close" and "Wick" methods for determining whether a SCOB has been mitigated (price has interacted with the block).
Show Last X SCOBs: Control the number of most recent SCOBs displayed on the chart, allowing you to focus on the most relevant price levels.
Volatility Filter: Enable or disable the volatility filter, which uses the Average True Range (ATR) to filter out less significant SCOBs. When enabled, only SCOBs with an ATR above the mean value of the ATR are displayed.
Customizable Colors: Configure the colors for bullish and bearish SCOBs to enhance visual clarity. The indicator uses cooler RGB values to ensure the blocks are distinct and easily noticeable.
🔶 Disclaimer
The "ICT Single Candle Order Block (SCOB) " indicator is provided for educational and informational purposes only. Trading involves significant risk and may not be suitable for all investors.
Past performance is not indicative of future results. Users should use this indicator in conjunction with their own research and trading strategy.

ADX and DI (Colored Candles Open-Source)The "ADX and DI (Colored Candles Open-Source)" indicator is a technical analysis tool used in trading. It utilizes the Average Directional Index (ADX) and the Directional Movement Indicators (+DI and -DI) to assess the strength and direction of a price trend. The ADX is calculated based on a 14-period lookback and is displayed as a histogram.
The color of the ADX histogram varies depending on the ADX value and the relative positions of +DI and -DI. Green and purple colors represent bullish and bearish trends respectively, with variations in shades indicating trend strength. Yellow and red colors indicate potential trend exhaustion for bullish and bearish trends, respectively, when ADX is above 50. Gray color is used when ADX is below 10, indicating a neutral trend.
Additionally, the script plots +DI and -DI lines with a fill between them to visually represent their crossover. Horizontal dotted lines are drawn at key ADX levels (0, 10, 25, 50) for reference. The candles on the chart are also colored to match the ADX histogram, providing a clear visual representation of the market trend.

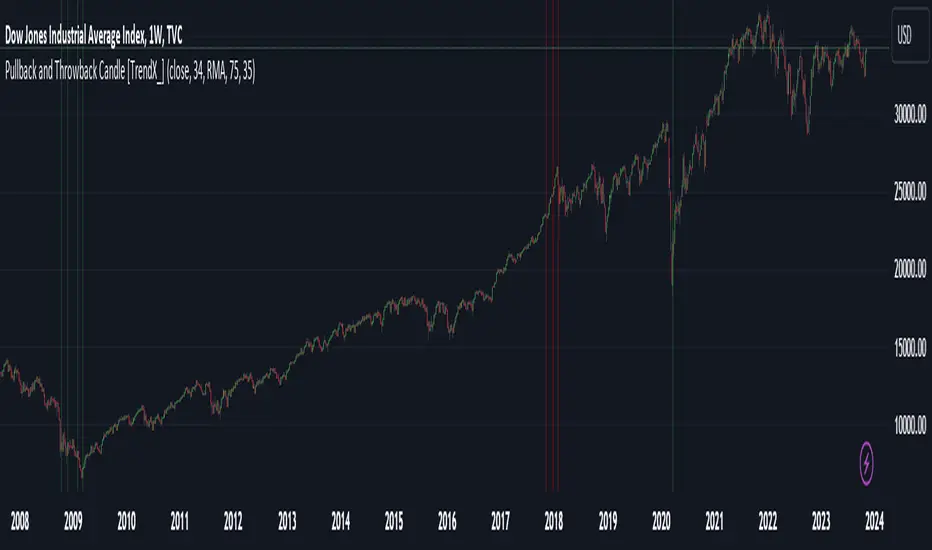
Pullback and Throwback Candle [TrendX_]Pullback and Throwback candles can help traders determine the the potential reversal points
USAGE
The indicator identifies pullback and throwback in overbought and oversold zones by measuring the distance between the price and its relative strength index.
A Pullback is an expected rebound in a downtrend (painted in green area), while a Throwback is a bounceback from an uptrend (painted in red area).
The strategy is useful for valuing reversal points. Accordingly, it can also be helpful for traders to use alongside other Technical Analysis indicators.
DISCLAIMER
This indicator is not financial advice, it can only help traders make better decisions.
There are many factors and uncertainties that can affect the outcome of any endeavor, and no one can guarantee or predict with certainty what will occur.
Therefore, one should always exercise caution and judgment when making decisions based on past performance.
HTF CandlesThis Indicator overlay candles from a timeframe input.
Use it to see Higher Time candles on your current chart
Heikin ashi optionnal

More than three Candles in a roww Changes color of more than three candles in a row, when there are consecutive candles of same color green or red

Kros-CandlesA script that makes it easy to find Kros candles
Kros candles are thick candles without a wick
We look for breakouts with Kros candles and trade

Trapping CandlesIt shows the candles which have higher sell volume then the previous candles and following can show us how the buyers are trapped in.

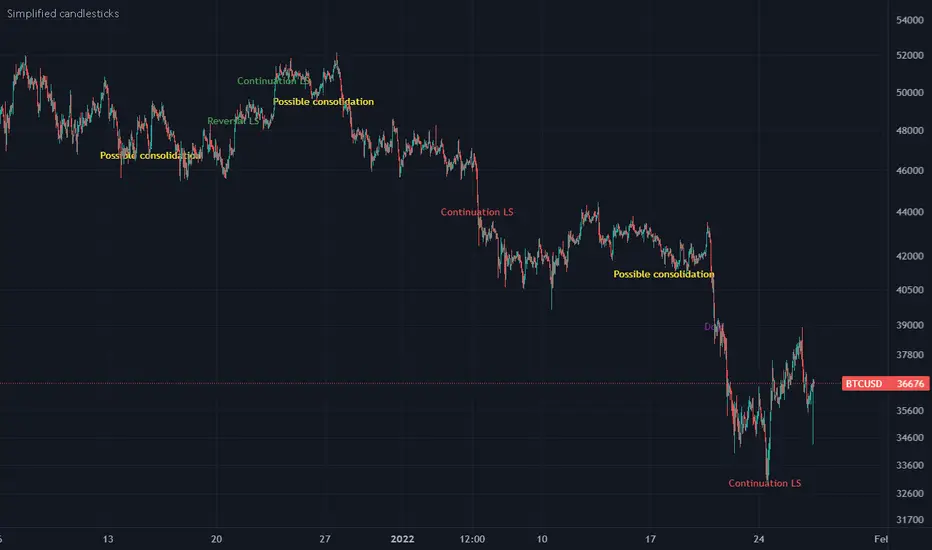
Simplified candlesticksSimplified candlesticks tracks sticks for their body and wick
- For Long bars sticks ( LS ) tracks and marks them on down trend as continuation and reversal if moves appositive direction.
- For largest wicks on ends marks as regular Doji
- For large wicks and medium body marks as possible consolidation
- For only bottom bigger wick as bears weakness if trend down and possible reversal if trend is up.
- For only upper bigger wick as bulls weakness if trend up and possible reversal if trend is down
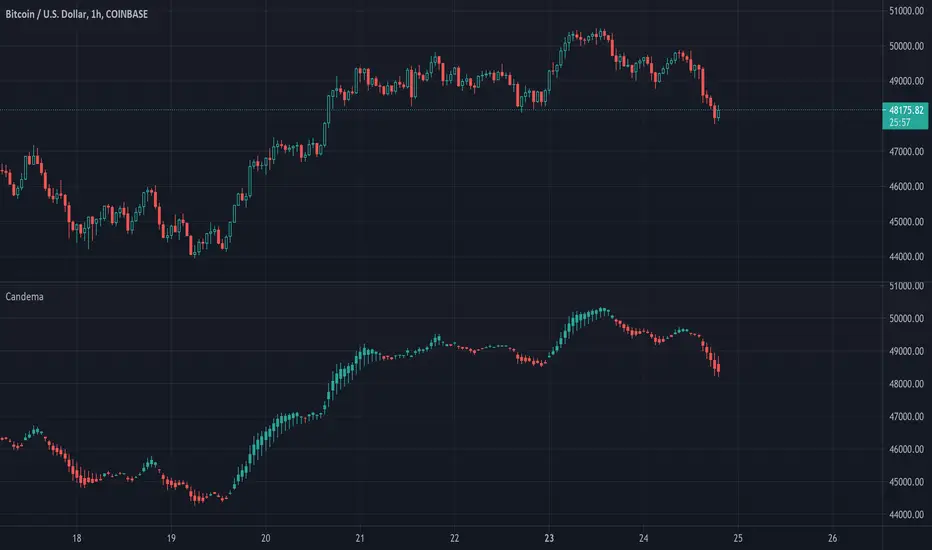
Candle EMAAn other way to plot candles containing 4 ema's (length can be set)
- 'high' = max of 4 ema's
- 'low' = min of 4 ema's
- 'open' = ema with longest length, which is not 'high' or 'low'
- 'close' = ema with shortest length, which is not 'high' or 'low'
Cheers!
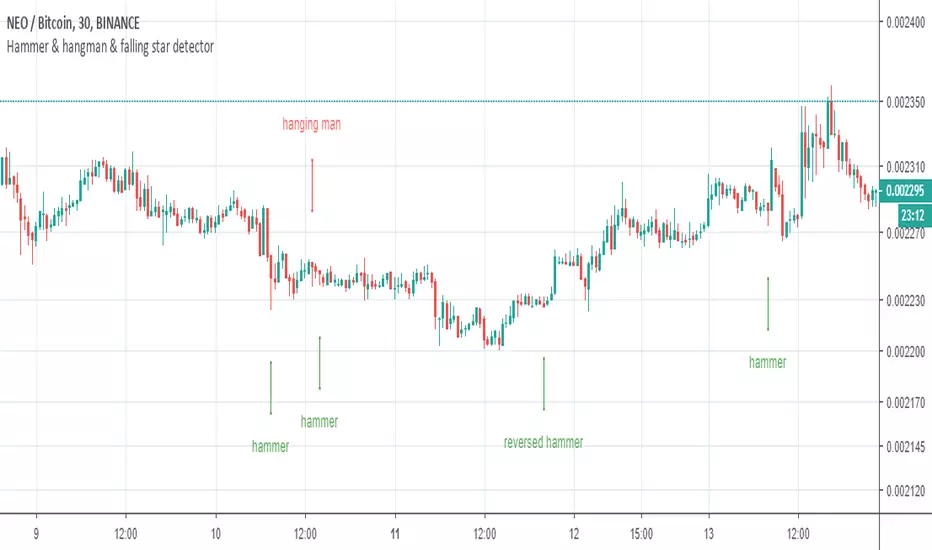
Hammer and Hanging Man candlesticks detectorSimple script to detect and mark possible reversal candlesticks - "hammer" and reversed version "hanging man".
hammer:
en.wikipedia.org(candlestick_pattern)
hanging man:
en.wikipedia.org(candlestick_pattern)
MTF candles by yatrader2Get higher time frame candles overlaid on a lower timeframe chart.
Add 1H candles on 1M or 1D on 30M
Overlaid candles feature wicks and multiple display options to customize appearance.
Add the indicator multiple times to get MTF (multiple time frames) all on one chart.

Reversal Candle Pattern SetUp
An outside reversal candle set up script with buy/sell signals. Looks simple but it's pretty powerful especially if combined with your choice confirming indicator.
The pattern psychology is this one (Frank Ochoa explanation): " The power behind this pattern lies in the psychology behind the traders involved in this setup. If you have ever participated in a breakout at support or resistance only to have the market reverse sharply against you, then you are familiar with the market dynamics of this setup.
[Basically, market participants are testing the waters above resistance or below support to make sure there is no new business to be done at these levels. When no initiative buyers or sellers participate in range extension, responsive participants have all the information they need to reverse price back toward a new area of perceived value.
As you look at a bullish outside reversal pattern, you will notice that the current bar's low is lower than the
prior bar's low. Essentially, the market is testing the waters below recently established lows to see if a downside
follow-through will occur. When no additional selling pressure enters the market, the result is a flood of buying
pressure that causes a springboard effect, thereby shooting price above the prior bar's highs and creating the
beginning of a bullish advance."

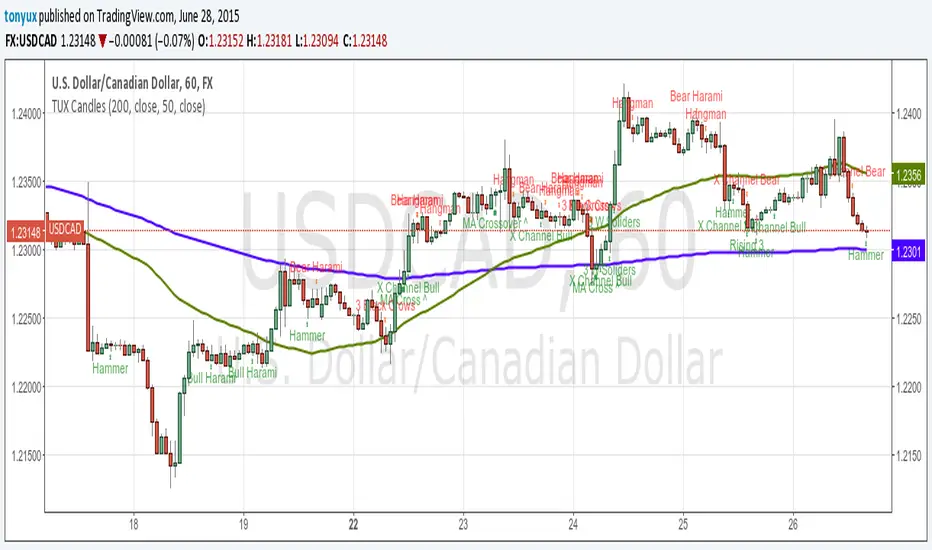
TUX CandlesThis indicator has a lot of information. This is the first version so stay tuned for updates, and please let me know of any bugs.
Candlestick Indicators:
Doji
Shooting Star
Evening Star
Hammer
Hanging Man
Candlestick Formations
Tri-star
Bearish Harami
Bullish Harami
Bearish Harami Cross
Bullish Harami Cross
Bullish Engulfing
Bearish Engulfing
Rising Three
Falling Three
Bearish Abandoned Baby
Bullish Abandoned Baby
Three Black Crows
Three White Soldiers
Technical Indicators:
(You can set you MA periods)
Moving Average Cross
Move Average Crossover

SYXX - HTF Candle Overlay
This script, titled "HTF Candle Overlay by SYXX," is designed to visualize the full range and structure of a higher-timeframe (HTF) candle directly onto a lower-timeframe chart. It helps traders maintain context by showing where the current price action sits relative to a much larger candle's boundaries. Combined with LuxAlgo Volume Node Profile.
1. 🔍 Primary Feature: Higher Timeframe Candle Projection
Configurable Timeframe: The user sets the desired HTF using the Interval input, which defaults to 'D' (Daily). The indicator then tracks the High, Low, Open, and Close of that HTF bar.
Live and Historical Drawing: The script uses box.new to draw boxes representing the candle's full range (High to Low).
Historical Boxes (if changeHTF): When a new HTF candle closes, the completed box for the previous period is drawn.
Live Box (if barstate.islast): The indicator draws a live, dynamic box for the current, incomplete HTF candle, which expands with every new High or Low on the lower chart.
2. 🎨 Visualization & Customization
Color-Coded Bias: The boxes are colored based on the HTF candle's direction:
Bullish/Long (BgLong): Green color is used if the HTF candle closed higher than it opened (close > htfOpen).
Bearish/Short (BgShort): Red color is used if the HTF candle closed lower than it opened.
Box Styling: Users can customize the box's appearance, including border color and style, border thickness, and background opacity (BoxOpacity).
Midline: An optional MidLine is calculated as the average of the HTF High and Low, acting as a potential support/resistance reference point.
Range Display: The indicator can display the range of the box in pips (BoxRangePips) or the percentage of movement relative to the full range (BoxRangePercentage).
Time Labels: It plots time labels that show the start and end time of the completed HTF period (e.g., "07:00 - 11:00").
3. 🚨 Alert System (Placeholders)
The script includes placeholder inputs for standard trading alerts, though the internal logic for checking these conditions is currently commented out or set to false:
Alert: Break Above/Below Box: To signal a breakout of the HTF High or Low.
Alert: Price Re-Enters Box: To signal a pullback back into the range.

AI Candlestick Pattern Identifier — Arrows & AlertsAI shows you high confidence candlestick patterns so that you can identify them quickly. Buy/Sell arrows will be placed alongside the pattern to alert you of which direction the indicator believes the market will go, as well as showing you the confidence in that indicator.

ATR-BHEEM-NOCHANGE-CANDLESCandles remain normal — removed barcolor(barCol)
ATR trailing stop line still shows trend direction (green/red)
Optional buy/sell labels added only when trend flips
Clean and ready for intraday 1-min charts

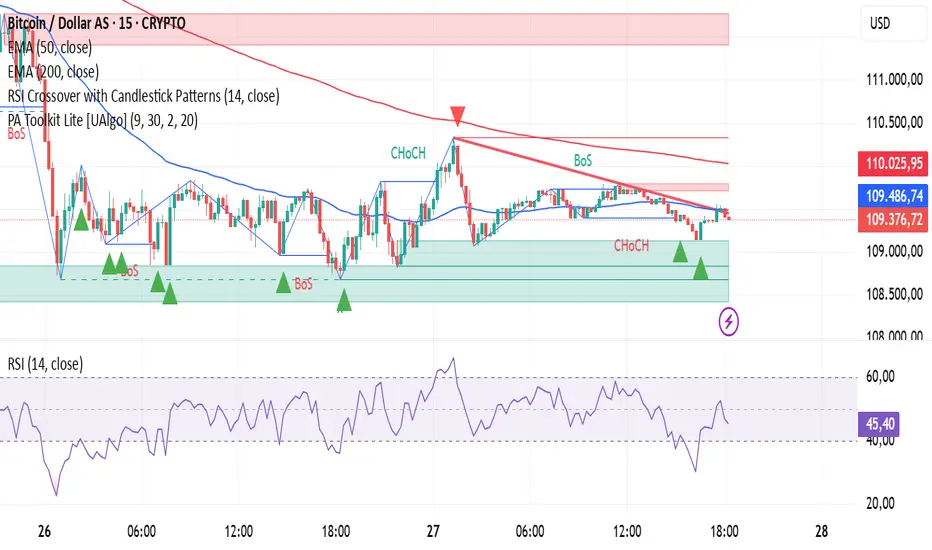
RSI Crossover with Candlestick Patternsusing the RSI indicator levels 40 and 60, where the signal cuts above level 40 with a candlestick hammer or bull engulfing and cuts below level 60 with a candlestick inverter hammer or bearish engulfing.
Alert N seconds before candle closeThe indicator alerts about the closing of the candle in N seconds.
Instruction:
1. Add an indicator
2. Specify the time in the indicator settings
3. Alt+A, Condition - choose indicator

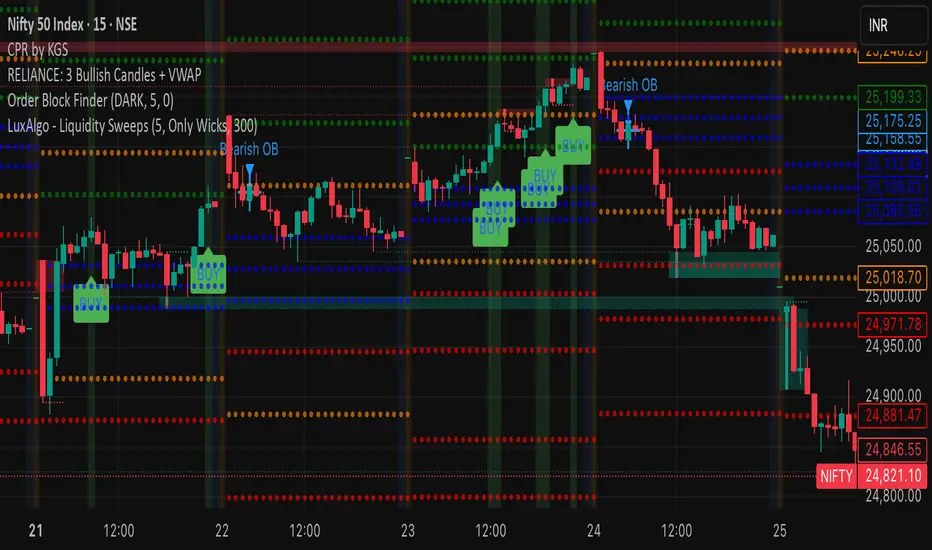
RELIANCE: 3 Bullish Candles + VWAPIts a script to track 3 consecutive candles of any stock. This helps understand the trends and makes up for buy signals. Please test before buying.
Previous Candle High/Low (Clean)✅ Creates one horizontal line for the previous candle’s high (green).
✅ Creates one horizontal line for the previous candle’s low (red).
✅ The lines update on each new candle, always following the most recent previous high/low.
✅ The lines are extended to the right — they don’t stack or clutter the chart.
✅ Works on all timeframes.

Internal Candle Strength [LuxAlgo]The Internal Candle Strength tool allows traders to divide each chart bar into multiple rows of custom size and inspect the strength of the lower timeframes trends located within each row.
This tool effectively helps traders in identifying the power dynamic between bulls and bears within multiple areas within each bar, providing the ability to conduct LTF analysis.
🔶 USAGE
The strength displayed within each row ranges from 0% to 100%, with 0% being the most bearish and 100% being the most bullish.
Traders should be aware of the extreme probabilities located at the higher/lower end of the bars, as this can signal a change in strength and price direction.
Traders can select the lower timeframe to pull the data from or the row size in the scale of the chart. Selecting a lower timeframe will provide more data to evaluate an area's strength.
Do note that only a timeframe lower than the chart timeframe should be selected.
🔹 Row Size
Selecting a smaller row size will increase the number of rows per bar, allowing for a more detailed analysis. A lower value will also generally mean that less data will be considered when calculating the strength of a specific area.
As we can see on the chart above (all BTCUSD 30m), by selecting a different row size, traders can control how many rows are displayed per bar.
🔶 SETTINGS
Timeframe: Lower timeframe used to calculate the candle strength.
Row Size: Size of each row on the chart scale, expressed as a fraction of the candle range.
