Recherche dans les scripts pour "crossover债券是什么"

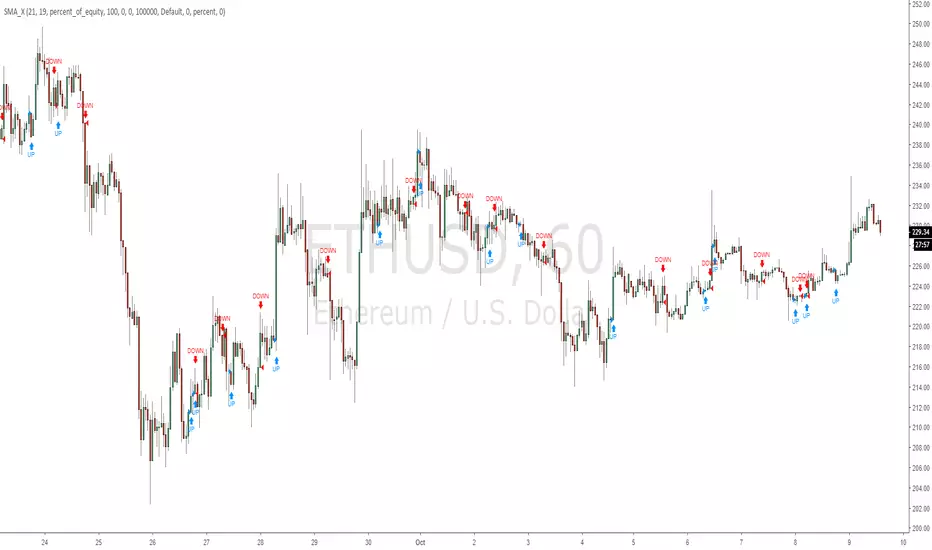
SimpleMA smoothed crossover strategyExperimental simple Bot script for ETH/USD 1 hour chart. welcome to test on other pairs. put feedback in comments.
This is a crossbreed between SMA and HULLMA
Simple TrenderOriginates from:
I was reading some Impulse Trading literature by A. Elder.. In it, someone named Kerry Lovvorn proposed "An End of Day Trend Following System" for someone lazy.
Originally it is just price closing above an 8 ema (low) for long. Exit when price closes below an 8 ema (low). The opposite for a short position.
Conditions: Buy when price closed below ema (low) for two bars or more, then closes above. Opposite for a short position. I do not follow this condition. Though it may help with whipsaw.
My condition is when price closes above the 26 ema (low) (works the best for me) I place orders above the initial crossing bars high. Opposite for lows.
I look for stocks that are low in price to go long on. I want the run from 2's to 15's
I look for stocks that are mid-teens/20's in price to go short on. I want the run from 20's to 2's
I look for stock with news and earnings that are already running (up or down) to play the pullback.
These conditions can easily be scanned for on thinkorswim
From first glance, the system looks like CMsling shotsystem. Although, I plagiarized some parts of the codes, because I am inept when it comes to that shit, it differs as it is not a moving average crossover system.
It is a price crossing over concept. A moving average VWAP is used for best entries on pullbacks.
Purpose:
--To catch the majority of a trend/wave/run.
--To identify pullback areas to go long or short while in midst of trend. To catch pullbacks off news and earning runners.
--To catch the initial start of trend with clear rules to enter
--Clear rules to exit
Issues
--possibilities of getting ninja sliced the fuck up. Can be mitigated by entering stocks with decent average volume. And also only going long above 200 ema and short below it. ADX won't work, at the initial start of the trend it will show not trending. Can look at blow off volume at the bottom followed by increase in buying for long and vice versa for short.
--Can give some huge gains away through gap ups or gap downs from news or earnings during trend. However, can get huge gain on gaps from news or earning. Nature of the game.
--Need some brass balls and a supply of pepto to stomach through some of the pullbacks. Gut wrenching seeing big gains dwindle. But they all even out at the end, you hope. (see NBEV and IGC, and CRON and others. shit don't go in straight lines, homie)
Pros
--It's simple and easy. Overall, you profit
--works with any security
Cons
--It can be stressful.
--does not work well on lower time frames. Do not recommend going below 15 minutes
--Possibility of working on 5 minutes with a time frame breakout strategy (15,30 min).
Couple it with LazyBear "Weis Wave Volume" indicator. Works well for pullback entries.
Enjoy. Ride some waves.

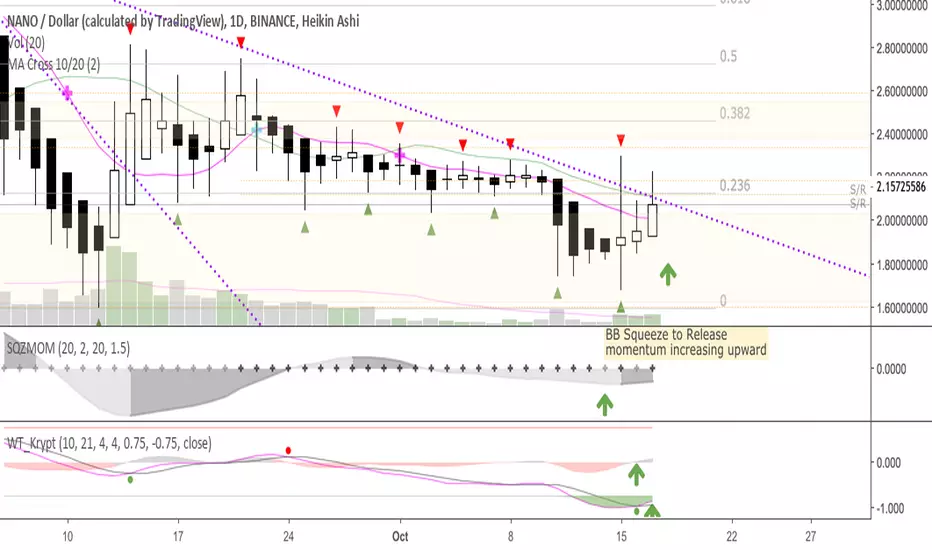
MA Cross 10/20This was originally derived from "MA Cross" indicator, though that one uses 9-21.
Simple 10day and 20day MA crossover indicator
* 10MA crosses from the bottom, goes up and above 20MA—we're bullish, look to long bullish signal candle
* 10MA crosses from the top, goes down and below 20MA—we're bearish, look to short bearish signal candle
Works well w/ Heikin Ashi candles
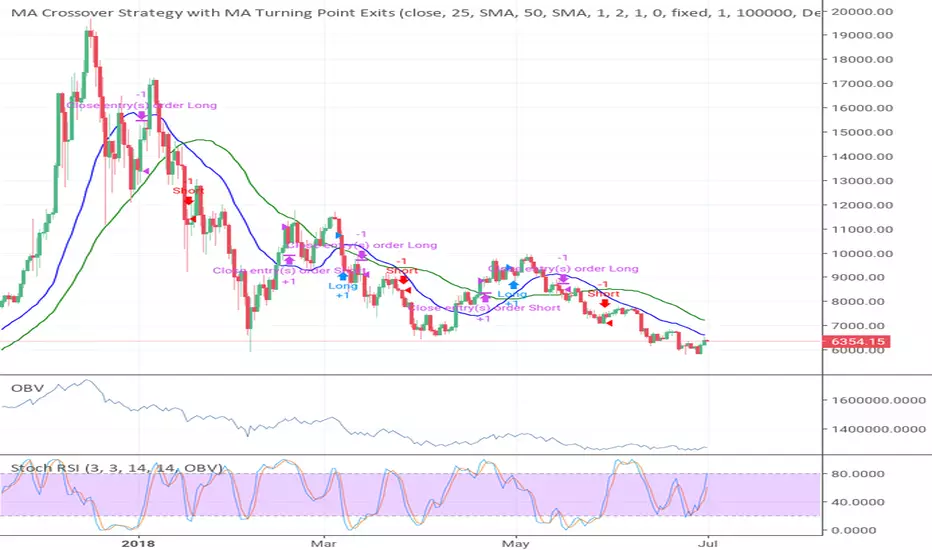
MA Crossover Strategy with MA Turning Point ExitsUser definable lengths of SMA, EMA, HMA, with entries on Crossover and exits on Turning Points. You can backtest different combos easily to see profitability.
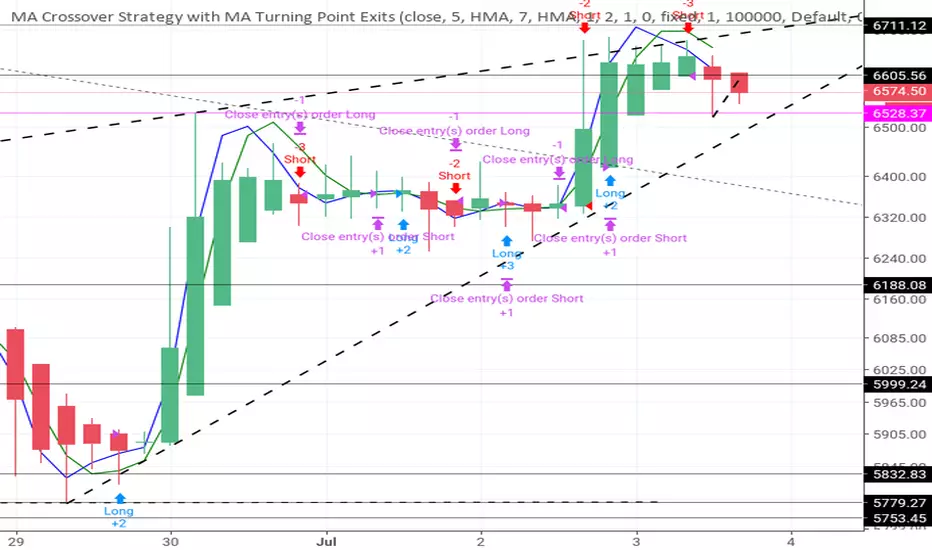
MA Crossover Strategy with MA Turning Point ExitsStrategy based on MA crossover entries and MA turning point (pivots) exits. You can select any SMA or EMA length, with the first faster one being used as the exit trigger. You can backtest different combinations on different timeframes.

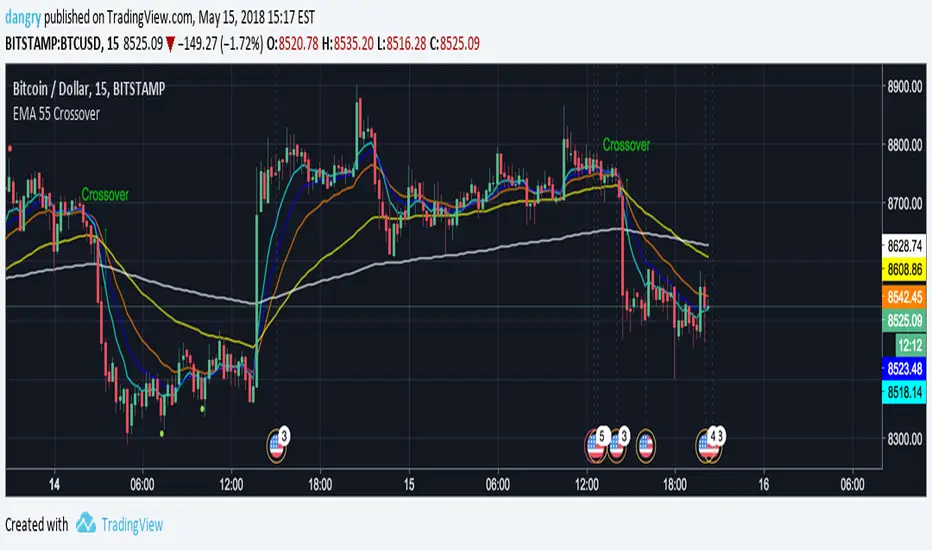
EMA 55 CrossoverBasically what this does is to flag when EMA 55 crosses over EMA 8, 13, 21, and 200. This strategy was described by @Philakone on this tweet , but I'm not really sure if this is the correct strategy he described.

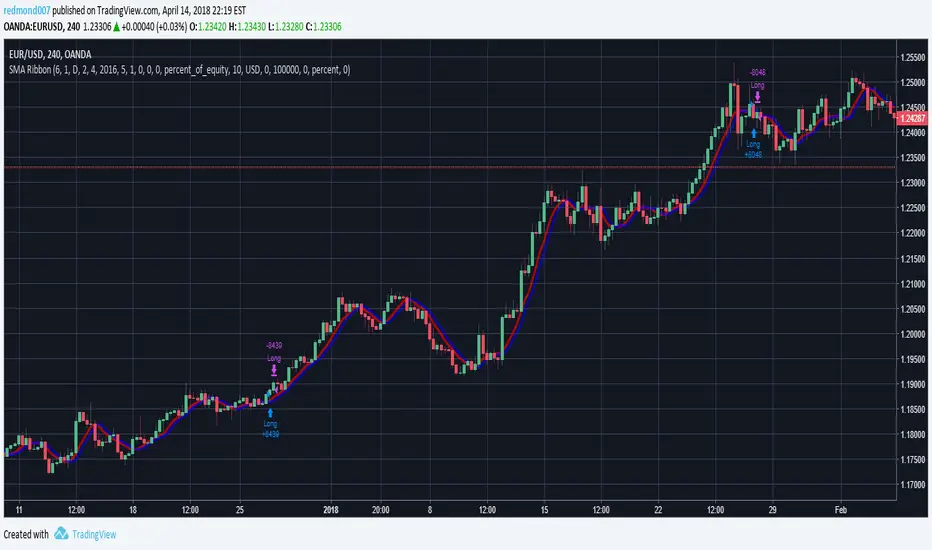
Dual Timeframe SMA Ribbon Crossover Backtest// Backtesting Dual SMA Ribbon Crossover Strategy
// see f.bpcdn.co
// including time limiting
Turned this study into a backtest.


EMA CrossoverSimple script showing two EMA values and a shape(circle) when a crossover has taken place.

RSX CrossoverThis plots an RSX crossover with barcolor, I chose 75 and 100 for optimum smoothality. Very good.

Trend MA 20Simple to use for anyone trading a 20 length moving average.
Crossover is signaled once 20 MA crosses 1 MA at close of selected time interval.


RN MACD SignalsThis is my simple way to quickly see MACD signals without having the MACD taking up space. The one at the bottom is for display to show how this works. A crossover occurs when the arrow flips over. The position of the arrow tells you if it is currently above or below the zero line. You can change the script to overlay and have it show up above or below price also. Let me know what you think.

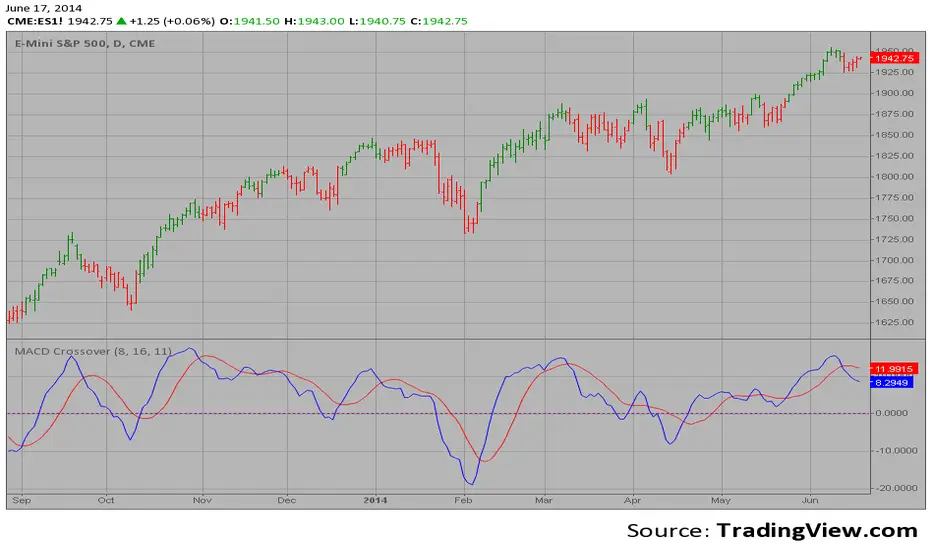
MACD Crossover MACD – Moving Average Convergence Divergence. The MACD is calculated
by subtracting a 26-day moving average of a security's price from a
12-day moving average of its price. The result is an indicator that
oscillates above and below zero. When the MACD is above zero, it means
the 12-day moving average is higher than the 26-day moving average.
This is bullish as it shows that current expectations (i.e., the 12-day
moving average) are more bullish than previous expectations (i.e., the
26-day average). This implies a bullish, or upward, shift in the supply/demand
lines. When the MACD falls below zero, it means that the 12-day moving average
is less than the 26-day moving average, implying a bearish shift in the
supply/demand lines.
A 9-day moving average of the MACD (not of the security's price) is usually
plotted on top of the MACD indicator. This line is referred to as the "signal"
line. The signal line anticipates the convergence of the two moving averages
(i.e., the movement of the MACD toward the zero line).
Let's consider the rational behind this technique. The MACD is the difference
between two moving averages of price. When the shorter-term moving average rises
above the longer-term moving average (i.e., the MACD rises above zero), it means
that investor expectations are becoming more bullish (i.e., there has been an
upward shift in the supply/demand lines). By plotting a 9-day moving average of
the MACD, we can see the changing of expectations (i.e., the shifting of the
supply/demand lines) as they occur.
Strategy Stochastic Crossover This back testing strategy generates a long trade at the Open of the following
bar when the %K line crosses below the %D line and both are above the Overbought level.
It generates a short trade at the Open of the following bar when the %K line
crosses above the %D line and both values are below the Oversold level.


