Future is hereOverview
"Future is Here" is an original, multi-faceted Pine Script indicator designed to provide traders with a comprehensive toolset for identifying high-probability trading opportunities. By integrating volatility-based entry zones, trend-based price targets, momentum confirmation, dynamic support/resistance levels, and risk-reward ratio (RRR) calculations, this indicator offers a cohesive and actionable trading framework. Each feature is carefully designed to complement the others, ensuring a synergistic approach that enhances decision-making across various market conditions. This script is unique in its ability to combine these elements into a single, streamlined interface with clear visual cues and customizable alerts, making it suitable for both novice and experienced traders.
Key Features and How They Work Together
Volatility-Based Entry Zones
Purpose: Identifies overbought and oversold conditions using a volatility-adjusted moving average, helping traders spot potential reversal zones.
Mechanism: Utilizes a user-defined volatility length and multiplier to calculate dynamic overbought/oversold thresholds based on the standard deviation of price. Crossovers and crossunders of these levels trigger "Buy Zone" or "Sell Zone" labels.
Synergy: These zones act as the foundation for entry signals, which are later confirmed by momentum and trend filters to reduce false signals.
Trend-Based Price Targets
Purpose: Projects potential price targets based on the prevailing trend, giving traders clear objectives for profit-taking.
Mechanism: Combines a fast and slow moving average to determine trend direction, then calculates target prices using a multiplier of the price deviation from the slow MA. Labels display bullish or bearish targets when the fast MA crosses the slow MA.
Synergy: Works in tandem with entry zones and momentum signals to align targets with market conditions, ensuring traders aim for realistic price levels supported by trend strength.
Momentum Confirmation
Purpose: Validates entry signals by assessing momentum strength, filtering out weak setups.
Mechanism: Uses the momentum indicator to detect bullish or bearish momentum crossovers, labeling them as "Strong" or "Weak" based on a comparison with a smoothed momentum average.
Synergy: Enhances the reliability of buy/sell signals by ensuring momentum aligns with volatility zones and trend direction, reducing the risk of premature entries.
Dynamic Support/Resistance Levels
Purpose: Highlights key price levels where the market is likely to react, aiding in trade planning and risk management.
Mechanism: Detects pivot highs and lows over a user-defined lookback period, drawing horizontal lines for the most recent support and resistance levels (limited to two each for clarity). Labels mark these levels with price values.
Synergy: Complements entry zones and price targets by providing context for potential reversal or continuation points, helping traders set logical stop-losses or take-profits.
Buy/Sell Signals with Risk-Reward Ratios
Purpose: Generates precise buy/sell signals with integrated take-profit (TP), stop-loss (SL), and RRR calculations for disciplined trading.
Mechanism: Combines volatility zone crossovers, trend confirmation, and positive momentum to trigger signals. ATR-based TP and SL levels are calculated, and the RRR is displayed in labels for quick assessment.
Synergy: This feature ties together all previous components, ensuring signals are only generated when volatility, trend, and momentum align, while providing clear risk-reward metrics for trade evaluation.
Customizable Alerts
Purpose: Enables traders to stay informed of trading opportunities without constant chart monitoring.
Mechanism: Alert conditions are set for buy and sell signals, delivering notifications with the entry price for seamless integration into trading workflows.
Synergy: Enhances usability by allowing traders to act on high-probability setups identified by the indicator’s combined logic.
Originality
"Future is Here" is an original creation that distinguishes itself through its holistic approach to technical analysis. Unlike single-purpose indicators, it integrates volatility, trend, momentum, and support/resistance into a unified system, reducing the need for multiple scripts. The inclusion of RRR calculations directly in signal labels is a unique feature that empowers traders to evaluate trade quality instantly. The script’s design emphasizes clarity and efficiency, with cooldowns to prevent label clutter and a limit on support/resistance lines to maintain chart readability. This combination of features, along with its customizable parameters, makes it a versatile and novel tool for traders seeking a robust, all-in-one solution.
How to Use
Setup: Add the indicator to your TradingView chart and adjust input parameters (e.g., Volatility Length, Trend Length, TP/SL Multipliers) to suit your trading style and timeframe.
Interpretation:
Look for "Buy Zone" or "Sell Zone" labels to identify potential entry points.
Confirm entries with "Bull Mom" or "Bear Mom" labels and trend direction (Bull/Bear Target labels).
Use Support/Resistance lines to set logical TP/SL levels or anticipate reversals.
Evaluate Buy/Sell signals with TP, SL, and RRR for high-probability trades.
Alerts: Set up alerts for Buy/Sell signals to receive real-time notifications.
Customization: Fine-tune multipliers and lengths to adapt the indicator to different markets (e.g., stocks, forex, crypto) or timeframes.
Recherche dans les scripts pour "crossover债券是什么"

ADX Forecast [Titans_Invest]ADX Forecast
This isn’t just another ADX indicator — it’s the most powerful and complete ADX tool ever created, and without question the best ADX indicator on TradingView, possibly even the best in the world.
ADX Forecast represents a revolutionary leap in trend strength analysis, blending the timeless principles of the classic ADX with cutting-edge predictive modeling. For the first time on TradingView, you can anticipate future ADX movements using scientifically validated linear regression — a true game-changer for traders looking to stay ahead of trend shifts.
1. Real-Time ADX Forecasting
By applying least squares linear regression, ADX Forecast projects the future trajectory of the ADX with exceptional accuracy. This forecasting power enables traders to anticipate changes in trend strength before they fully unfold — a vital edge in fast-moving markets.
2. Unmatched Customization & Precision
With 26 long entry conditions and 26 short entry conditions, this indicator accounts for every possible ADX scenario. Every parameter is fully customizable, making it adaptable to any trading strategy — from scalping to swing trading to long-term investing.
3. Transparency & Advanced Visualization
Visualize internal ADX dynamics in real time with interactive tags, smart flags, and fully adjustable threshold levels. Every signal is transparent, logic-based, and engineered to fit seamlessly into professional-grade trading systems.
4. Scientific Foundation, Elite Execution
Grounded in statistical precision and machine learning principles, ADX Forecast upgrades the classic ADX from a reactive lagging tool into a forward-looking trend prediction engine. This isn’t just an indicator — it’s a scientific evolution in trend analysis.
⯁ SCIENTIFIC BASIS LINEAR REGRESSION
Linear Regression is a fundamental method of statistics and machine learning, used to model the relationship between a dependent variable y and one or more independent variables 𝑥.
The general formula for a simple linear regression is given by:
y = β₀ + β₁x + ε
β₁ = Σ((xᵢ - x̄)(yᵢ - ȳ)) / Σ((xᵢ - x̄)²)
β₀ = ȳ - β₁x̄
Where:
y = is the predicted variable (e.g. future value of RSI)
x = is the explanatory variable (e.g. time or bar index)
β0 = is the intercept (value of 𝑦 when 𝑥 = 0)
𝛽1 = is the slope of the line (rate of change)
ε = is the random error term
The goal is to estimate the coefficients 𝛽0 and 𝛽1 so as to minimize the sum of the squared errors — the so-called Random Error Method Least Squares.
⯁ LEAST SQUARES ESTIMATION
To minimize the error between predicted and observed values, we use the following formulas:
β₁ = /
β₀ = ȳ - β₁x̄
Where:
∑ = sum
x̄ = mean of x
ȳ = mean of y
x_i, y_i = individual values of the variables.
Where:
x_i and y_i are the means of the independent and dependent variables, respectively.
i ranges from 1 to n, the number of observations.
These equations guarantee the best linear unbiased estimator, according to the Gauss-Markov theorem, assuming homoscedasticity and linearity.
⯁ LINEAR REGRESSION IN MACHINE LEARNING
Linear regression is one of the cornerstones of supervised learning. Its simplicity and ability to generate accurate quantitative predictions make it essential in AI systems, predictive algorithms, time series analysis, and automated trading strategies.
By applying this model to the ADX, you are literally putting artificial intelligence at the heart of a classic indicator, bringing a new dimension to technical analysis.
⯁ VISUAL INTERPRETATION
Imagine an ADX time series like this:
Time →
ADX →
The regression line will smooth these values and extend them n periods into the future, creating a predicted trajectory based on the historical moment. This line becomes the predicted ADX, which can be crossed with the actual ADX to generate more intelligent signals.
⯁ SUMMARY OF SCIENTIFIC CONCEPTS USED
Linear Regression Models the relationship between variables using a straight line.
Least Squares Minimizes the sum of squared errors between prediction and reality.
Time Series Forecasting Estimates future values based on historical data.
Supervised Learning Trains models to predict outputs from known inputs.
Statistical Smoothing Reduces noise and reveals underlying trends.
⯁ WHY THIS INDICATOR IS REVOLUTIONARY
Scientifically-based: Based on statistical theory and mathematical inference.
Unprecedented: First public ADX with least squares predictive modeling.
Intelligent: Built with machine learning logic.
Practical: Generates forward-thinking signals.
Customizable: Flexible for any trading strategy.
⯁ CONCLUSION
By combining ADX with linear regression, this indicator allows a trader to predict market momentum, not just follow it.
ADX Forecast is not just an indicator — it is a scientific breakthrough in technical analysis technology.
⯁ Example of simple linear regression, which has one independent variable:
⯁ In linear regression, observations ( red ) are considered to be the result of random deviations ( green ) from an underlying relationship ( blue ) between a dependent variable ( y ) and an independent variable ( x ).
⯁ Visualizing heteroscedasticity in a scatterplot against 100 random fitted values using Matlab:
⯁ The data sets in the Anscombe's quartet are designed to have approximately the same linear regression line (as well as nearly identical means, standard deviations, and correlations) but are graphically very different. This illustrates the pitfalls of relying solely on a fitted model to understand the relationship between variables.
⯁ The result of fitting a set of data points with a quadratic function:
_______________________________________________________________________
🥇 This is the world’s first ADX indicator with: Linear Regression for Forecasting 🥇_______________________________________________________________________
_________________________________________________
🔮 Linear Regression: PineScript Technical Parameters 🔮
_________________________________________________
Forecast Types:
• Flat: Assumes prices will remain the same.
• Linreg: Makes a 'Linear Regression' forecast for n periods.
Technical Information:
ta.linreg (built-in function)
Linear regression curve. A line that best fits the specified prices over a user-defined time period. It is calculated using the least squares method. The result of this function is calculated using the formula: linreg = intercept + slope * (length - 1 - offset), where intercept and slope are the values calculated using the least squares method on the source series.
Syntax:
• Function: ta.linreg()
Parameters:
• source: Source price series.
• length: Number of bars (period).
• offset: Offset.
• return: Linear regression curve.
This function has been cleverly applied to the RSI, making it capable of projecting future values based on past statistical trends.
______________________________________________________
______________________________________________________
⯁ WHAT IS THE ADX❓
The Average Directional Index (ADX) is a technical analysis indicator developed by J. Welles Wilder. It measures the strength of a trend in a market, regardless of whether the trend is up or down.
The ADX is an integral part of the Directional Movement System, which also includes the Plus Directional Indicator (+DI) and the Minus Directional Indicator (-DI). By combining these components, the ADX provides a comprehensive view of market trend strength.
⯁ HOW TO USE THE ADX❓
The ADX is calculated based on the moving average of the price range expansion over a specified period (usually 14 periods). It is plotted on a scale from 0 to 100 and has three main zones:
• Strong Trend: When the ADX is above 25, indicating a strong trend.
• Weak Trend: When the ADX is below 20, indicating a weak or non-existent trend.
• Neutral Zone: Between 20 and 25, where the trend strength is unclear.
______________________________________________________
______________________________________________________
⯁ ENTRY CONDITIONS
The conditions below are fully flexible and allow for complete customization of the signal.
______________________________________________________
______________________________________________________
🔹 CONDITIONS TO BUY 📈
______________________________________________________
• Signal Validity: The signal will remain valid for X bars .
• Signal Sequence: Configurable as AND or OR .
🔹 +DI > -DI
🔹 +DI < -DI
🔹 +DI > ADX
🔹 +DI < ADX
🔹 -DI > ADX
🔹 -DI < ADX
🔹 ADX > Threshold
🔹 ADX < Threshold
🔹 +DI > Threshold
🔹 +DI < Threshold
🔹 -DI > Threshold
🔹 -DI < Threshold
🔹 +DI (Crossover) -DI
🔹 +DI (Crossunder) -DI
🔹 +DI (Crossover) ADX
🔹 +DI (Crossunder) ADX
🔹 +DI (Crossover) Threshold
🔹 +DI (Crossunder) Threshold
🔹 -DI (Crossover) ADX
🔹 -DI (Crossunder) ADX
🔹 -DI (Crossover) Threshold
🔹 -DI (Crossunder) Threshold
🔮 +DI (Crossover) -DI Forecast
🔮 +DI (Crossunder) -DI Forecast
🔮 ADX (Crossover) +DI Forecast
🔮 ADX (Crossunder) +DI Forecast
______________________________________________________
______________________________________________________
🔸 CONDITIONS TO SELL 📉
______________________________________________________
• Signal Validity: The signal will remain valid for X bars .
• Signal Sequence: Configurable as AND or OR .
🔸 +DI > -DI
🔸 +DI < -DI
🔸 +DI > ADX
🔸 +DI < ADX
🔸 -DI > ADX
🔸 -DI < ADX
🔸 ADX > Threshold
🔸 ADX < Threshold
🔸 +DI > Threshold
🔸 +DI < Threshold
🔸 -DI > Threshold
🔸 -DI < Threshold
🔸 +DI (Crossover) -DI
🔸 +DI (Crossunder) -DI
🔸 +DI (Crossover) ADX
🔸 +DI (Crossunder) ADX
🔸 +DI (Crossover) Threshold
🔸 +DI (Crossunder) Threshold
🔸 -DI (Crossover) ADX
🔸 -DI (Crossunder) ADX
🔸 -DI (Crossover) Threshold
🔸 -DI (Crossunder) Threshold
🔮 +DI (Crossover) -DI Forecast
🔮 +DI (Crossunder) -DI Forecast
🔮 ADX (Crossover) +DI Forecast
🔮 ADX (Crossunder) +DI Forecast
______________________________________________________
______________________________________________________
🤖 AUTOMATION 🤖
• You can automate the BUY and SELL signals of this indicator.
______________________________________________________
______________________________________________________
⯁ UNIQUE FEATURES
______________________________________________________
Linear Regression: (Forecast)
Signal Validity: The signal will remain valid for X bars
Signal Sequence: Configurable as AND/OR
Condition Table: BUY/SELL
Condition Labels: BUY/SELL
Plot Labels in the Graph Above: BUY/SELL
Automate and Monitor Signals/Alerts: BUY/SELL
Linear Regression (Forecast)
Signal Validity: The signal will remain valid for X bars
Signal Sequence: Configurable as AND/OR
Table of Conditions: BUY/SELL
Conditions Label: BUY/SELL
Plot Labels in the graph above: BUY/SELL
Automate & Monitor Signals/Alerts: BUY/SELL
______________________________________________________
📜 SCRIPT : ADX Forecast
🎴 Art by : @Titans_Invest & @DiFlip
👨💻 Dev by : @Titans_Invest & @DiFlip
🎑 Titans Invest — The Wizards Without Gloves 🧤
✨ Enjoy!
______________________________________________________
o Mission 🗺
• Inspire Traders to manifest Magic in the Market.
o Vision 𐓏
• To elevate collective Energy 𐓷𐓏

ADX Full [Titans_Invest]ADX Full
This is, without a doubt, the most complete ADX indicator available on TradingView — and quite possibly the most advanced in the world. We took the classic ADX structure and fully optimized it, preserving its essence while elevating its functionality to a whole new level. Every aspect has been enhanced — from internal logic to full visual customization. Now you can see exactly what’s happening inside the indicator in real time, with tags, flags, and informative levels. This indicator includes over 22 long entry conditions and 22 short entry conditions , covering absolutely every possibility the ADX can offer. Everything is transparent, adjustable, and ready to fit seamlessly into any professional trading strategy. This isn’t just another ADX — it’s the definitive ADX, built for traders who take the market seriously.
⯁ WHAT IS THE ADX❓
The Average Directional Index (ADX) is a technical analysis indicator developed by J. Welles Wilder. It measures the strength of a trend in a market, regardless of whether the trend is up or down.
The ADX is an integral part of the Directional Movement System, which also includes the Plus Directional Indicator (+DI) and the Minus Directional Indicator (-DI). By combining these components, the ADX provides a comprehensive view of market trend strength.
⯁ HOW TO USE THE ADX❓
The ADX is calculated based on the moving average of the price range expansion over a specified period (usually 14 periods). It is plotted on a scale from 0 to 100 and has three main zones:
Strong Trend: When the ADX is above 25, indicating a strong trend.
Weak Trend: When the ADX is below 20, indicating a weak or non-existent trend.
Neutral Zone: Between 20 and 25, where the trend strength is unclear.
⯁ ENTRY CONDITIONS
The conditions below are fully flexible and allow for complete customization of the signal.
______________________________________________________
🔹 CONDITIONS TO BUY 📈
______________________________________________________
• Signal Validity: The signal will remain valid for X bars .
• Signal Sequence: Configurable as AND or OR .
🔹 +DI > -DI
🔹 +DI < -DI
🔹 +DI > ADX
🔹 +DI < ADX
🔹 -DI > ADX
🔹 -DI < ADX
🔹 ADX > Threshold
🔹 ADX < Threshold
🔹 +DI > Threshold
🔹 +DI < Threshold
🔹 -DI > Threshold
🔹 -DI < Threshold
🔹 +DI (Crossover) -DI
🔹 +DI (Crossunder) -DI
🔹 +DI (Crossover) ADX
🔹 +DI (Crossunder) ADX
🔹 +DI (Crossover) Threshold
🔹 +DI (Crossunder) Threshold
🔹 -DI (Crossover) ADX
🔹 -DI (Crossunder) ADX
🔹 -DI (Crossover) Threshold
🔹 -DI (Crossunder) Threshold
______________________________________________________
______________________________________________________
🔸 CONDITIONS TO SELL 📉
______________________________________________________
• Signal Validity: The signal will remain valid for X bars .
• Signal Sequence: Configurable as AND or OR .
🔸 +DI > -DI
🔸 +DI < -DI
🔸 +DI > ADX
🔸 +DI < ADX
🔸 -DI > ADX
🔸 -DI < ADX
🔸 ADX > Threshold
🔸 ADX < Threshold
🔸 +DI > Threshold
🔸 +DI < Threshold
🔸 -DI > Threshold
🔸 -DI < Threshold
🔸 +DI (Crossover) -DI
🔸 +DI (Crossunder) -DI
🔸 +DI (Crossover) ADX
🔸 +DI (Crossunder) ADX
🔸 +DI (Crossover) Threshold
🔸 +DI (Crossunder) Threshold
🔸 -DI (Crossover) ADX
🔸 -DI (Crossunder) ADX
🔸 -DI (Crossover) Threshold
🔸 -DI (Crossunder) Threshold
______________________________________________________
______________________________________________________
🤖 AUTOMATION 🤖
• You can automate the BUY and SELL signals of this indicator.
______________________________________________________
______________________________________________________
⯁ UNIQUE FEATURES
______________________________________________________
Signal Validity: The signal will remain valid for X bars
Signal Sequence: Configurable as AND/OR
Condition Table: BUY/SELL
Condition Labels: BUY/SELL
Plot Labels in the Graph Above: BUY/SELL
Automate and Monitor Signals/Alerts: BUY/SELL
Signal Validity: The signal will remain valid for X bars
Signal Sequence: Configurable as AND/OR
Table of Conditions: BUY/SELL
Conditions Label: BUY/SELL
Plot Labels in the graph above: BUY/SELL
Automate & Monitor Signals/Alerts: BUY/SELL
______________________________________________________
📜 SCRIPT : ADX Full
🎴 Art by : @Titans_Invest & @DiFlip
👨💻 Dev by : @Titans_Invest & @DiFlip
🎑 Titans Invest — The Wizards Without Gloves 🧤
✨ Enjoy!
______________________________________________________
o Mission 🗺
• Inspire Traders to manifest Magic in the Market.
o Vision 𐓏
• To elevate collective Energy 𐓷𐓏

RSI with HMA & Momentum ZonesRSI with HMA & Momentum Zones — Indicator Description
This indicator combines Relative Strength Index (RSI) analysis with Hull Moving Averages (HMA) and Momentum Zone detection to provide a multi-layered view of market strength, trend shifts, and divergence signals.
It includes:
Main Features:
RSI Core:
Standard RSI calculated from a customizable source (close, open, etc.) with adjustable length.
A dynamic RSI Signal Line is plotted with selectable smoothing types (SMA, EMA, SMMA, WMA, VWMA) to enhance trend-following signals.
RSI crossovers of its signal line change color (green for bullish crossovers, red for bearish crossunders).
Hull Moving Averages (HMA):
Two HMA lines are plotted based on the RSI:
Short HMA (fast) and Long HMA (slow).
Color shifts indicate crossovers between RSI and Short HMA (short-term trend change) and Short HMA vs Long HMA (longer-term trend shifts).
Momentum Zones:
When the gap between the RSI and the Long HMA exceeds a user-defined threshold:
A green background highlights strong bullish momentum.
A red background highlights strong bearish momentum.
Helps visualize when momentum becomes extended.
Divergence Detection (Optional):
Regular and hidden bullish and bearish divergences are automatically detected between price and RSI.
Divergences are plotted on the RSI pane with labels ("Bull", "H Bull", "Bear", "H Bear").
Adjustable lookback settings for fine-tuning sensitivity.
Alerts are available for all divergence events.
Visual Enhancements:
A shaded cloud fills between RSI and its signal line, green for bullish bias and red for bearish bias.
Horizontal bands at 70, 50, and 30 levels to mark traditional RSI zones (overbought, neutral, oversold).
Customization Options:
All major components — RSI settings, Signal Line type, HMA lengths, Momentum Zone threshold, and Divergence controls — are fully adjustable.

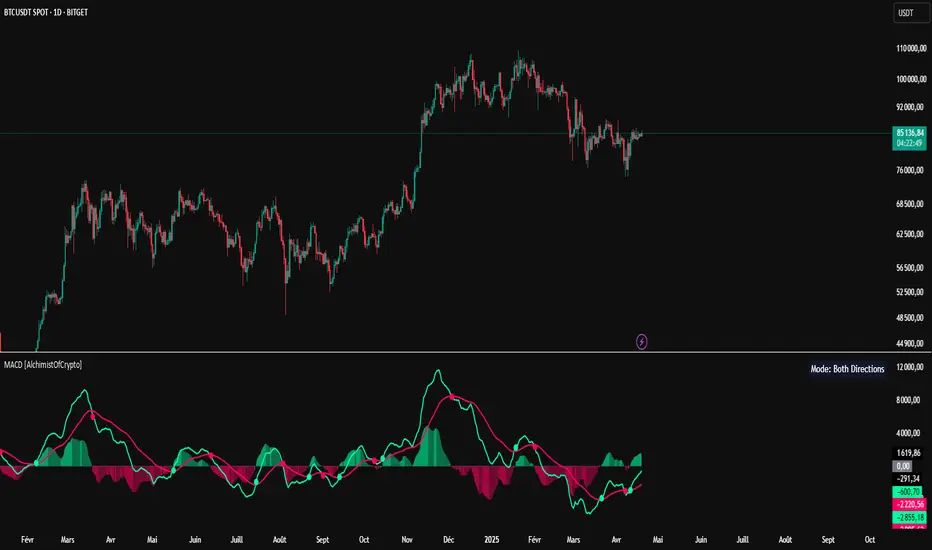
MACD [AlchimistOfCrypto]🌠 MACD Optimized with Python – Decoding the Chaos of Markets 🌠
Category: Trend Analysis 📈
"Like the dynamic systems studied in chaos theory, financial markets appear unpredictable at first glance. Yet, as Edward Lorenz demonstrated, even in apparent chaos reside harmonious mathematical structures. The MACD (Moving Average Convergence Divergence) represents this quest for order within disorder—a mathematical formulation that extracts coherent signals from price noise. By combining moving averages of different periods, this indicator reveals hidden cycles and precise moments when market energy shifts, like a pendulum obeying the immutable laws of physics."
📊 Technical Overview
The MACD Optimized with Python is a revolutionary take on the classic Moving Average Convergence Divergence indicator. Powered by Python-driven optimizations 🐍, it adapts to specific timeframes, delivering razor-sharp signals for traders seeking to navigate the market’s chaos with precision.
⚙️ How It Works
- Python-Optimized Parameters 🔧: Unlike the standard MACD (12,26,9), our version uses mathematically tailored parameters for each timeframe:
- 1H: 11/38/27
- 4H: 9/98/27
- 1D: 45/90/29
- 1W: 9/16/3
- 2W: 5/20/5
- Intuitive Visuals 🎨:
- Crossovers marked by colored dots 🟢🔴 for clear entry/exit signals.
- Histogram with a color gradient 🌈 to show direction and momentum intensity.
- Customizable Signals 🎯: Choose to display long, short, or both signals to match your trading style.
🚀 How to Use This Indicator
1. Select Your Timeframe ⏰: Choose the timeframe aligned with your trading horizon (1H, 4H, 1D, 1W, or 2W).
2. Spot Crossovers 🔍: Watch for the MACD line (green) crossing the signal line (red) to identify potential trend changes.
3. Confirm with Divergence ✅: Combine crossovers with price-MACD divergence for high-probability trend reversal signals.
📅 Release Notes
Unlock the hidden order of markets with this Python-optimized MACD. Stay tuned for future enhancements! ✨
🏷️ Tags
#Trading #TechnicalAnalysis #MACD #TrendAnalysis #Python #MultiTimeframe #Divergence #Momentum #TradingStrategy #RiskManagement #Forex #Stocks #Crypto #ChaosTheory #OptimizedTrading
Multi-Timeframe MA DashboardThis indicator monitors 5 timeframes: 5min, 15min, 1hr, 4hr, and Daily. It displays fast and slow moving averages for each timeframe, along with the current price. The trend direction is color-coded: green for bullish (fast MA above slow MA) and red for bearish (fast MA below slow MA).
The dashboard also shows the last crossover signal (Buy/Sell) for each timeframe.
Visual arrows are plotted on the chart for the current timeframe. A green up arrow indicates a potential bullish crossover (Buy signal), while a red down arrow indicates a potential bearish crossover (Sell signal).
The dashboard is elegant and professional, with alternating row colors for better readability. It can be placed in any corner of the screen and customized with user-defined colors for bullish and bearish trends.
Alerts are triggered when a crossover occurs on any timeframe. These alerts include the timeframe and signal type (e.g., "5min: ↑ BUY").
How to Read the Indicator
The dashboard displays the following for each timeframe:
Fast MA: The value of the fast moving average.
Slow MA: The value of the slow moving average.
Price: The current price for the timeframe.
Trend: The current trend direction (Bullish or Bearish).
Signal: The last crossover signal (↑ BUY or ↓ SELL).
On the chart, green up arrows indicate a bullish crossover (Fast MA crosses above Slow MA), while red down arrows indicate a bearish crossover (Fast MA crosses below Slow MA).
Green text in the dashboard indicates a bullish trend or signal, while red text indicates a bearish trend or signal.
How to Use the Indicator
Use the dashboard to monitor the trend direction across multiple timeframes. Look for confluence (agreement) between timeframes to identify stronger trends. Observe the "Signal" column in the dashboard for the last crossover on each timeframe. Use the arrows on the chart to identify potential crossover points for the current timeframe.
Enable alerts to be notified of crossover signals on any timeframe. Alerts include the timeframe and signal type for easy reference.
Adjust the fast and slow moving average lengths to suit your trading style. Choose between EMA, SMA, or WMA for the moving average type. Customize the dashboard placement and colors for better visibility.
Important Notes
This indicator is not a buy or sell recommendation. It is a tool to assist traders in their analysis. Always use this indicator in conjunction with other tools, such as support/resistance levels, volume analysis, and price action. Past performance of moving averages does not guarantee future results.
How to Add the Indicator
Add the indicator to your chart from the TradingView library. Configure the inputs:
Fast MA Length: Default is 20.
Slow MA Length: Default is 50.
MA Type: Choose between EMA, SMA, or WMA.
Dashboard Placement: Select the corner of the screen where the dashboard will appear.
Colors: Customize the colors for bullish and bearish trends.
Monitor the dashboard and chart for trends and signals.
Disclaimer
This indicator is for educational and informational purposes only. It does not provide financial, investment, or trading advice. Always perform your own analysis and consult with a financial advisor before making trading decisions.

Supertrend + MACD Trend Change with AlertsDetailed Guide
1. Indicator Overview
Purpose:
This script combines the Supertrend and MACD indicators to help you detect potential trend changes. It plots a Supertrend line (green for bullish, red for bearish) and marks the chart with shapes when a trend reversal is signaled by both indicators. In addition, it includes alert conditions so that you can be notified when a potential trend change occurs.
How It Works:
Supertrend: Uses the Average True Range (ATR) to determine dynamic support and resistance levels. When the price crosses these levels, it signals a possible change in trend.
MACD: Focuses on the crossover between the MACD line and the signal line. A bullish crossover (MACD line crossing above the signal line) suggests upward momentum, while a bearish crossover (MACD line crossing below the signal line) suggests downward momentum.
2. Supertrend Component
Key Parameters:
Factor:
Function: Multiplies the ATR to create an offset from the mid-price (hl2).
Adjustment Impact: Lower values make the indicator more sensitive (producing more frequent signals), while higher values result in fewer, more confirmed signals.
ATR Period:
Function: Sets the number of bars over which the ATR is calculated.
Adjustment Impact: A shorter period makes the ATR react more quickly to recent price changes (but can be noisy), whereas a longer period provides a smoother volatility measurement.
Trend Calculation:
The script compares the previous close with the dynamically calculated upper and lower bands. If the previous close is above the upper band, the trend is set to bullish (1); if it’s below the lower band, the trend is bearish (-1). The Supertrend line is then plotted in green for bullish trends and red for bearish trends.
3. MACD Component
Key Parameters:
Fast MA (Fast Moving Average):
Function: Represents a shorter-term average, making the MACD line more sensitive to recent price movements.
Slow MA (Slow Moving Average):
Function: Represents a longer-term average to smooth out the MACD line.
Signal Smoothing:
Function: Defines the period for the signal line, which is a smoothed version of the MACD line.
Crossover Logic:
The script uses the crossover() function to detect when the MACD line crosses above the signal line (bullish crossover) and crossunder() to detect when it crosses below (bearish crossover).
4. Combined Signal Logic
How Signals Are Combined:
Bullish Scenario:
When the MACD shows a bullish crossover (MACD line crosses above the signal line) and the Supertrend indicates a bullish trend (green line), a green upward triangle is plotted below the bar.
Bearish Scenario:
When the MACD shows a bearish crossover (MACD line crosses below the signal line) and the Supertrend indicates a bearish trend (red line), a red downward triangle is plotted above the bar.
Rationale:
By combining the signals from both indicators, you increase the likelihood that the detected trend change is reliable, filtering out some false signals.
5. Alert Functionality
Alert Setup in the Code:
The alertcondition() function is used to define conditions under which TradingView can trigger alerts.
There are two alert conditions:
Bullish Alert: Activated when there is a bullish MACD crossover and the Supertrend confirms an uptrend.
Bearish Alert: Activated when there is a bearish MACD crossover and the Supertrend confirms a downtrend.
What Happens When an Alert Triggers:
When one of these conditions is met, TradingView registers the alert condition. You can then create an alert in TradingView (using the alert dialog) and choose one of these alert conditions. Once set up, you’ll receive notifications (via pop-ups, email, or SMS, depending on your settings) whenever a trend change is signaled.
6. User Adjustments and Their Effects
Factor (Supertrend):
Adjustment: Lowering the factor increases sensitivity, resulting in more frequent signals; raising it will filter out some signals, making them potentially more reliable.
ATR Period (Supertrend):
Adjustment: A shorter ATR period makes the indicator more responsive to recent price movements (but can introduce noise), while a longer period smooths out the response.
MACD Parameters (Fast MA, Slow MA, and Signal Smoothing):
Adjustment:
Shortening the Fast MA increases sensitivity, generating earlier signals that might be less reliable.
Lengthening the Slow MA produces a smoother MACD line, reducing noise.
Adjusting the Signal Smoothing changes how quickly the signal line responds to changes in the MACD line.
7. Best Practices and Considerations
Multiple Confirmation:
Even if both indicators signal a trend change, consider confirming with additional analysis such as volume, price action, or other indicators.
Market Conditions:
These indicators tend to perform best in trending markets. In sideways or choppy conditions, you may experience more false alerts.
Backtesting:
Before applying the indicator in live trading, backtest your settings to ensure they suit your trading style and the market conditions.
Risk Management:
Always use proper risk management, including stop-loss orders and appropriate position sizing, as alerts may occasionally produce late or false signals.
Happy trading!

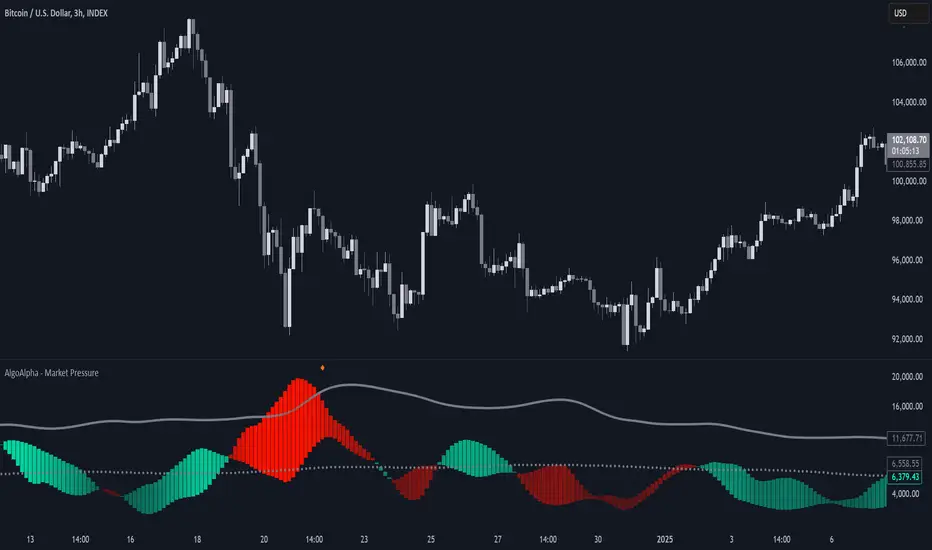
Market Pressure Index [AlgoAlpha]The Market Pressure Index is a cutting-edge trading tool designed to measure and visualize bullish and bearish momentum through a unique blend of volatility analysis and dynamic smoothing techniques. This indicator provides traders with an intuitive understanding of market pressure, making it easier to identify trend shifts, breakout opportunities, and key moments to take profit. Perfect for scalpers and swing traders looking for a strategic edge in volatile markets.
Key Features:
🔎 Bullish and Bearish Volatility Separation : Dynamically calculates and displays bullish and bearish momentum separately, helping traders assess market direction with precision.
🎨 Customizable Appearance: Set your preferred colors for bullish and bearish signals to match your chart's theme.
📊 Deviation-Based Upper Band : Tracks extreme volatility levels using a configurable deviation multiplier, highlighting potential breakout points.
📈 Real-Time Signal Alerts : Provides alerts for bullish and bearish crossovers, as well as take-profit signals, ensuring you never miss key market movements.
⚡ Gradient-Based Visualization : Uses color gradients to depict the intensity of market pressure, making it easy to spot changes in momentum at a glance.
How to Use:
Add the Indicator : Add the Market Pressure Index to your TradingView chart by clicking the star icon. Customize inputs like the pressure lookback period, deviation settings, and colors to fit your trading style.
Interpret the Signals : Monitor the bullish and bearish momentum columns to gauge market direction. Look for crossovers to signal potential trend changes.
Take Action : Use alerts for breakouts above the upper band or for take-profit levels to enhance your trade execution.
How It Works:
The Market Pressure Index separates bullish and bearish momentum by analyzing price movement (close vs. open) and volatility. These values are smoothed using Hull Moving Averages (HMA) to highlight trends while minimizing noise. A deviation-based upper band dynamically tracks market extremes, signaling breakout zones. Color gradients depict the intensity of momentum, offering a clear, visually intuitive representation of market pressure. Alerts are triggered when significant crossovers or take-profit conditions occur, giving traders actionable insights without constant chart monitoring.
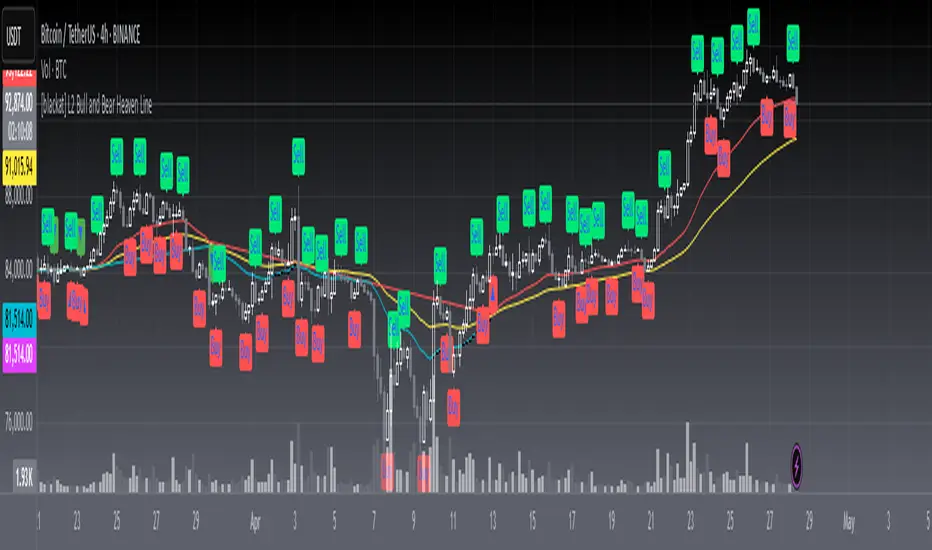
[blackat] L2 Bull and Bear Heaven LineOVERVIEW
The L2 Bull and Bear Heaven Line script is a custom indicator designed to visualize trend directions using Exponential Moving Average (EMA)-based lines and generate trade signals based on crossovers between those lines. It also incorporates an RSI-like feature to provide additional insight into overbought and oversold conditions.
FEATURES
Utilizes two EMAs: a longer-term "Heaven Line" (default 60 bars) and a shorter-term "Trading Line" (default 30 bars).
Generates buy/sell signals based on crossovers between the "Trading Line" and "Heaven Line".
Identifies potential turning points in the market, indicating shifts from bullish to bearish or vice versa.
Includes an "Operation Line" similar to RSI, aiding in detecting overbought/oversold levels.
HOW TO USE
Add the script to your TradingView chart.
Observe the crossovers between the "Trading Line" and "Heaven Line":
Buy signal when the "Trading Line" crosses above the "Heaven Line".
Sell signal when the "Trading Line" crosses below the "Heaven Line".
Monitor the "Operation Line" for additional confirmation:
Secondary sell signal when the "Operation Line" drops below 90% and there is downward price action.
Complementary buy signal when the "Operation Line" rises above 10% and there is upward price action.
Consider the identified trend direction and potential turning points to make informed trading decisions.
LIMITATIONS
The effectiveness of the signals depends on the chosen time frame and specific market conditions.
False signals may occur due to volatile price movements or rapid changes in market sentiment.
NOTES
This script combines traditional technical analysis tools like EMAs with an RSI-like approach to enhance decision-making processes. Users should backtest the strategy under various market scenarios before implementing it in live trading.
THANKS
Special thanks to the contributors whose work inspired parts of this script.
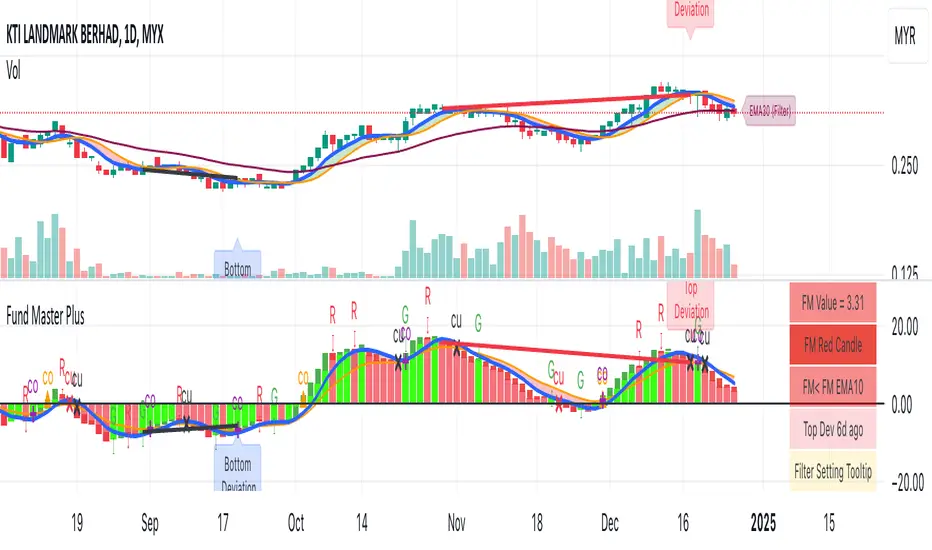
Fund Master Plus (TV Rev1, Dec2024)License: Mozilla Public License 2.0 (Open Source)
Version: Pine Script™ v6
Indicator Name: Fund Master Plus (TV Rev1, Dec2024)
Short Title: Fund Master Plus
About Fund Master Plus
Fund Master Plus indicator is an oscillating technical analysis tool designed to simulate the fund inflow and outflow trend.
Key features:
1. Fund Master Value and Candle
The candle highlights the direction of the Fund Master value.
Green candles represent an upward trend, while red candles indicate a downward trend.
When the candle crossover 0, it is a sign of the start of mid term bull, vice versa.
When the candle is above 0, it is a sign of mid-term bull, vice versa.
2. Fund Master Bar
This bar provides added visual representation of the Fund Master value.
Green bars represent and upward trend, while red bars indicate a downward trend.
3. FM EMA (Exponential Moving Average)
The Fund Master EMA (Exponential Moving Average) helps smooth out FM value fluctuations
and identify the overall trend.
When the candle crossover FM EMA, it is a sign of the start of short term bull, vice vera.
When the candle is above FM EMA, it is a sign of short term bull, vice versa.
4. EMA of FM EMA
This is an EMA of the Fund Master EMA, which can provide additional insights into the
trend's strength.
5. Candle Turn Green or Red
This feature generates alerts to signal potential trend changes.
6. Bottom Deviation & Top Deviation
Line plot and label of these deviation will show on indicator and the price chart to help user
identify potential buying and selling opportunities.
7. Alertcondition for Turn Green or Turn Red
User can set the alert using the Create Alert (the Clock Icon).
8. Table Summary
A table summary is provided to show indicator name, FM value, FM candle status,
Crossover, Crossunder, Turn Green, Turn Red status, Bar Number etc.
A tooltip for Filter Setting and a filter status check.
SOP to use the indicator:
Table (GR1):
Show Table: This option enables or disables the display of the table.
Text Size: This option allows you to set the text size for the table entries.
Width: This option sets the width of the table.
Fund Master Candle Color Setting (GR2):
FM candle will up by default.
This option enables the color setting of Fund Master candle.
Up: This option sets the color of the Fund Master candle for uptrend.
Down: This option sets the color of the Fund Master candle for downtrend.
Fund Master Bar and Color Setting (GR3):
Show Fund Master Bar: This option enables or disables the display of the Fund Master bar.
Up: This option sets the color of the Fund Master bar for uptrend.
Down: This option sets the color of the Fund Master bar for downtrend.
Fund Master EMA plots (GR4):
Show FM EMA: This option enables or disables the display of the Fund Master EMA line.
Look Back Period: This option sets the lookback period for the Fund Master EMA calculation.
EMA Color: This option sets the color of the Fund Master EMA line.
Show EMA of FM EMA: This option enables or disables the display of the EMA of the Fund Master EMA line.
Look Back Period 2: This option sets the lookback period for the EMA of the Fund Master EMA calculation.
Alerts: Fund Master Crossover & Crossunder EMA Line or 0 (GR5):
Show FM Crossover 0: This option enables or disables the display of the alert for FM crossover above the 0 line.
Show FM Crossunder 0: This option enables or disables the display of the alert for FM crossover below the 0 line.
Show FM Crossover EMA: This option enables or disables the display of the alert for FM crossover above the EMA line.
Show FM Crossunder EMA: This option enables or disables the display of the alert for FM crossover below the EMA line.
Bottom and Top Deviation (GR6):
Show Bottom Deviation: This option enables or disables the display of the bottom deviation line.
Show Top Deviation: This option enables or disables the display of the top deviation line.
Turn Green, Turn Red Alert (GR7):
Show Turn Green/Red Alerts: This option enables or disables the display of alerts for when the Fund Master value changes direction.
Current & Turn Green/Red Alerts: This option sets the number of bars to look back for the turn green/red alerts.
Band and User Input Setting (GR8):
100: This option enables or disables the display of the 100 band.
0: This option enables or disables the display of the 0 band.
-100: This option enables or disables the display of the -100 band.
User Input: This option enables or disables the display of a custom band based on user input.
Value: This option sets the value for the custom band.
Disclaimer
Attached chart is for the purpose of illustrating the use of indicator, no recommendation of buy/sell.
In this chart, all features in the setting are turned on (default and non default).
This chart is used to demonstrate the FM trend movement from mid-term bear to mid-term bull,
short-term bear and bull, bottom deviation and top deviation.
Hope this help. Merry Christmas and Happy New Year.
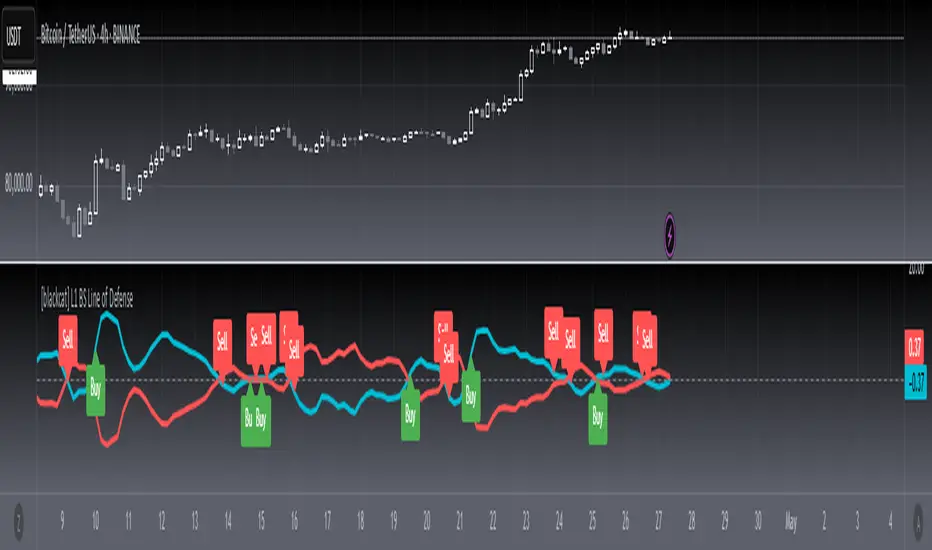
[blackcat] L1 BS Line of Defense █ OVERVIEW
The Pine Script provided is an advanced technical indicator designed to generate reliable buy and sell signals by integrating momentum, moving averages, and price level analyses. It employs a custom weighted moving average (WMA) and exponential moving averages (EMAs) to compute key signals known as the "Buy/Sell Signal" and the "Short Line." These signals aim to pinpoint optimal entry and exit points for trades by evaluating their relationship with current market dynamics.
█ FEATURES
Key Components:
• Custom Weighted Moving Average ( WMA ): Provides enhanced flexibility compared to traditional moving averages.
• Exponential Moving Averages ( EMA ): Smooths the defense line and its short-term counterpart to filter out market noise.
• Momentum Indicators: Includes both short-term and long-term momentum adjusted via custom WMA and EMAs.
• Conditional Signal Generation: Signals are triggered based on precise crossovers and price conditions.
Logical Framework:
1 — Input Parameters:
No explicit user-defined inputs; defaults are used for internal calculations.
2 — Custom Functions:
• custom_wma : Calculates a custom WMA.
• calculate_buy_sell_signals : Generates buy and sell signals.
3 — Calculations:
• Momentum and Range Analysis over 9, 34, and 60-bar periods.
• Application of custom WMA and EMAs to smooth and refine data.
• Derivation of the "defense line" and "short_ema_defense."
4 — Plotting:
• Main signal lines ("Buy/Sell Signal" and "Short Line") are visualized.
• A horizontal zero line serves as a reference point.
█ HOW TO USE
To utilize this script effectively:
1 — Add the script to your TradingView chart.
2 — Observe the "Buy/Sell Signal" and "Short Line" relative to the zero line and each other.
3 — Look for crossovers and divergence patterns to identify potential trade opportunities.
4 — Combine the signals with additional technical indicators or fundamental analysis for better accuracy.
█ LIMITATIONS
While the script provides valuable insights, users should consider the following limitations:
• Default settings may not suit all markets or instruments; customization might be necessary.
• False signals can occur during volatile or ranging markets.
• Backtesting and optimization are recommended before live trading.
█ NOTES
For further enhancement and personalization:
• Introduce adjustable input parameters for WMA and EMA lengths and weights.
• Extend the script into a full-fledged trading strategy with entry and exit rules.
• Apply the script across multiple timeframes for comprehensive analysis.
• Incorporate risk management practices such as stop-loss and take-profit levels.
• Explore related Pine Script functions like security() for multi-timeframe analysis and [pine>alertcondition() for automated alerts.
Understanding core concepts like momentum, moving averages, and crossovers will aid in developing similar indicators or refining existing ones.
Dynamic Volume RSI (DVRSI) [QuantAlgo]Introducing the Dynamic Volume RSI (DVRSI) by QuantAlgo 📈✨
Elevate your trading and investing strategies with the Dynamic Volume RSI (DVRSI) , a powerful tool designed to provide clear insights into market momentum and trend shifts. This indicator is ideal for traders and investors who want to stay ahead of the curve by using volume-responsive calculations and adaptive smoothing techniques to enhance signal clarity and reliability.
🌟 Key Features:
🛠 Customizable RSI Settings: Tailor the indicator to your strategy by adjusting the RSI length and price source. Whether you’re focused on short-term trades or long-term investments, DVRSI adapts to your needs.
🌊 Adaptive Smoothing: Enable adaptive smoothing to filter out market noise and ensure cleaner signals in volatile or choppy market conditions.
🎨 Dynamic Color-Coding: Easily identify bullish and bearish trends with color-coded candles and RSI plots, offering clear visual cues to track market direction.
⚖️ Volume-Responsive Adjustments: The DVRSI reacts to volume changes, giving greater significance to high-volume price moves and improving the accuracy of trend detection.
🔔 Custom Alerts: Stay informed with alerts for key RSI crossovers and trend changes, allowing you to act quickly on emerging opportunities.
📈 How to Use:
✅ Add the Indicator: Set up the DVRSI by adding it to your chart and customizing the RSI length, price source, and smoothing options to fit your specific strategy.
👀 Monitor Visual Cues: Watch for trend shifts through the color-coded plot and candles, signaling changes in momentum as the RSI crosses key levels.
🔔 Set Alerts: Configure alerts for critical RSI crossovers, such as the 50 line, ensuring you stay on top of potential market reversals and opportunities.
🔍 How It Works:
The Dynamic Volume RSI (DVRSI) is a unique indicator designed to provide more accurate and responsive signals by incorporating both price movement and volume sensitivity into the RSI framework. It begins by calculating the traditional RSI values based on a user-defined length and price source, but unlike standard RSI tools, the DVRSI applies volume-weighted adjustments to reflect the strength of market participation.
The indicator dynamically adjusts its sensitivity by factoring in volume to the RSI calculation, which means that price moves backed by higher volumes carry more weight, making the signal more reliable. This method helps identify stronger trends and reduces the risk of false signals in low-volume environments. To further enhance accuracy, the DVRSI offers an adaptive smoothing option that allows users to reduce noise during periods of market volatility. This adaptive smoothing function responds to market conditions, providing a cleaner signal by reducing erratic movements or price spikes that could lead to misleading signals.
Additionally, the DVRSI uses dynamic color-coding to visually represent the strength of bullish or bearish trends. The candles and RSI plots change color based on the RSI values crossing critical thresholds, such as the 50 level, offering an intuitive way to recognize trend shifts. Traders can also configure alerts for specific RSI crossovers (e.g., above 50 or below 40), ensuring that they stay informed of potential trend reversals and significant market shifts in real-time.
The combination of volume sensitivity, adaptive smoothing, and dynamic trend visualization makes the DVRSI a robust and versatile tool for traders and investors looking to fine-tune their market analysis. By incorporating both price and volume data, this indicator delivers more precise signals, helping users make informed decisions with greater confidence.
Disclaimer:
The Dynamic Volume RSI is designed to enhance your market analysis but should not be used as a sole decision-making tool. Always consider multiple factors before making any trading or investment decisions. Past performance is not indicative of future results.

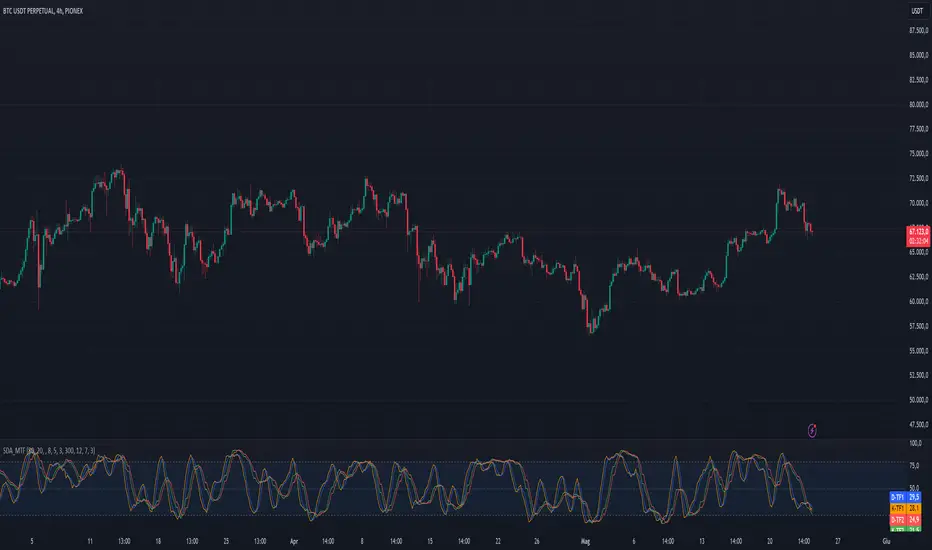
Stoch Double Analysis MTFThis indicator utilizes the Stochastic Oscillator on two different timeframes and generates alerts for potential long and short conditions based on the crossovers of the %K and %D lines of the Stochastic Oscillator. Here's a detailed breakdown of the code:
Inputs
Overbought and Oversold Levels:
ob_stc: Overbought level (default 80).
os_stc: Oversold level (default 20).
Timeframe 1 Configuration:
tf_stoch_1: The first timeframe for analysis.
length: Stochastic length (default 8).
smoothK: Smoothing for %K line (default 5).
smoothD: Smoothing for %D line (default 3).
Timeframe 2 Configuration:
tf_stoch_2: The second timeframe for analysis.
length_another: Stochastic length for the second timeframe (default 12).
smoothK_another: Smoothing for %K line for the second timeframe (default 7).
smoothD_another: Smoothing for %D line for the second timeframe (default 3).
Calculations
Volume Trend Calculation:
For both timeframes, the script calculates the volume trend. It determines up days and down days based on whether the closing price is higher or lower than the opening price and accumulates the volume accordingly.
Cumulative Volume:
Calculates the cumulative volume for up days and down days using the average of the high prices and the respective volumes.
Stochastic Oscillator Calculation:
Computes the %K and %D lines of the Stochastic Oscillator for both timeframes using the given lengths and smoothing factors.
Alerts
The script generates alerts for potential long and short conditions based on the crossovers of the %K and %D lines for both timeframes:
Long Condition: When %K crosses above %D.
Short Condition: When %D crosses above %K.
Plotting
Stochastic Lines:
Plots the %K and %D lines for both timeframes with different colors (orange and blue for the first timeframe, green and red for the second timeframe).
Overbought/Oversold Bands:
Adds horizontal lines at the overbought and oversold levels and a middle band at 50.
Fills the background between the overbought and oversold levels with a semi-transparent color.
Code Structure
Inputs Definition:
Defines all input variables for customization.
Volume Trend and Cumulative Volume Calculation:
Computes volume trends and cumulative volumes for both timeframes.
Stochastic Oscillator Calculation:
Calculates the %K and %D lines using the request.security function to get data from the specified timeframes and apply the smoothing functions.
Alert Conditions:
Checks for crossovers between the %K and %D lines to generate alerts for potential trading signals.
Plotting:
Plots the %K and %D lines for both timeframes and adds visual elements for overbought and oversold levels.
This indicator helps traders analyze market trends using the Stochastic Oscillator on multiple timeframes, providing potential buy and sell signals based on the interaction of the %K and %D lines.
The alerts generated by the "Stoch Double Analysis MTF" indicator can be viewed as part of a broader educational and training path for traders!
Philpose's Binary Turbo 1.2Hello there,
I'm thrilled to introduce my very first TradingView indicator - "Philpose's Binary Turbo 1.0." This indicator isn't just another tool; it's my unique take on binary options trading, powered by the Relative Strength Index (RSI).
Differences from Other Indicators:
This indicator is designed for traders who prefer short-term trading, as it uses a 1-minute timeframe.
It assumes that RSI crossovers of overbought and oversold levels can be used to generate binary options signals.
Users should backtest and evaluate the indicator's performance in different market conditions and consider risk management strategies.
Custom Logic: This indicator implements a custom trading logic based on RSI crossovers of overbought and oversold levels. Many indicators on TradingView use standard indicators, but this script incorporates unique logic.
Signal Tracking: It tracks and displays the last buy and sell signals on the chart. This visual representation can be helpful for traders to see when signals were generated.
Streak Tracking: The script keeps track of winning and losing streaks, which can provide traders with insights into their trading performance over time.
Table Summary: It creates a table summarizing various statistics related to the signals generated, such as total signals, wins, losses, and streaks. This tabular representation can be useful for traders to assess the indicator's performance.
How to Use:
To use this indicator effectively, follow these steps:
Add the Indicator: Copy and paste the script into TradingView's Pine Script editor. Then, apply the indicator to the chart.
Customize Parameters: Adjust the RSI parameters (period, overbought, and oversold levels) and the minimum bars between signals according to your trading strategy and preferences.
Interpret Signals: Buy signals are generated when the RSI crosses above the oversold level, and sell signals occur when it crosses below the overbought level.
Analyze Streaks: Keep an eye on the win and loss streaks to assess the indicator's performance and your trading strategy.
Review Table: The table at the top-right corner of the chart provides a summary of important statistics related to signals, wins, losses, and streaks.
Markets and Conditions:
The script can be used in various financial markets, including stocks, forex, commodities, and indices. However, it's important to note that binary options trading has a distinct risk profile and is available on certain platforms. Therefore, you should ensure that your chosen binary options platform supports TradingView indicators and that you understand the specific conditions of binary options trading.
Conditions for Use:
This indicator is designed for traders who prefer short-term trading, as it uses a 1-minute timeframe.
It assumes that RSI crossovers of overbought and oversold levels can be used to generate binary options signals.
Users should backtest and evaluate the indicator's performance in different market conditions and consider risk management strategies.
Please exercise caution when using any trading indicator or strategy, especially in binary options trading, as it involves a high level of risk, and you may lose your entire investment. It's advisable to thoroughly test any strategy on a demo account before trading with real funds and to seek the advice of a qualified financial advisor if you are unsure about your trading decisions.

Multi-Timeframe Trend Detector [Alifer]Here is an easy-to-use and customizable multi-timeframe visual trend indicator.
The indicator combines Exponential Moving Averages (EMA), Moving Average Convergence Divergence (MACD), and Relative Strength Index (RSI) to determine the trend direction on various timeframes: 15 minutes (15M), 30 minutes (30M), 1 hour (1H), 4 hours (4H), 1 day (1D), and 1 week (1W).
EMA Trend : The script calculates two EMAs for each timeframe: a fast EMA and a slow EMA. If the fast EMA is greater than the slow EMA, the trend is considered Bullish; if the fast EMA is less than the slow EMA, the trend is considered Bearish.
MACD Trend : The script calculates the MACD line and the signal line for each timeframe. If the MACD line is above the signal line, the trend is considered Bullish; if the MACD line is below the signal line, the trend is considered Bearish.
RSI Trend : The script calculates the RSI for each timeframe. If the RSI value is above a specified Bullish level, the trend is considered Bullish; if the RSI value is below a specified Bearish level, the trend is considered Bearish. If the RSI value is between the Bullish and Bearish levels, the trend is Neutral, and no arrow is displayed.
Dashboard Display :
The indicator prints arrows on the dashboard to represent Bullish (▲ Green) or Bearish (▼ Red) trends for each timeframe.
You can easily adapt the Dashboard colors (Inputs > Theme) for visibility depending on whether you're using a Light or Dark theme for TradingView.
Usage :
You can adjust the indicator's settings such as theme (Dark or Light), EMA periods, MACD parameters, RSI period, and Bullish/Bearish levels to adapt it to your specific trading strategies and preferences.
Disclaimer :
This indicator is designed to quickly help you identify the trend direction on multiple timeframes and potentially make more informed trading decisions.
You should consider it as an extra tool to complement your strategy, but you should not solely rely on it for making trading decisions.
Always perform your own analysis and risk management before executing trades.
The indicator will only show a Dashboard. The EMAs, RSI and MACD you see on the chart image have been added just to demonstrate how the script works.
DETAILED SCRIPT EXPLANATION
INPUTS:
theme : Allows selecting the color theme (options: "Dark" or "Light").
emaFastPeriod : The period for the fast EMA.
emaSlowPeriod : The period for the slow EMA.
macdFastLength : The fast length for MACD calculation.
macdSlowLength : The slow length for MACD calculation.
macdSignalLength : The signal length for MACD calculation.
rsiPeriod : The period for RSI calculation.
rsiBullishLevel : The level used to determine Bullish RSI condition, when RSI is above this value. It should always be higher than rsiBearishLevel.
rsiBearishLevel : The level used to determine Bearish RSI condition, when RSI is below this value. It should always be lower than rsiBullishLevel.
CALCULATIONS:
The script calculates EMAs on multiple timeframes (15-minute, 30-minute, 1-hour, 4-hour, daily, and weekly) using the request.security() function.
Similarly, the script calculates MACD values ( macdLine , signalLine ) on the same multiple timeframes using the request.security() function along with the ta.macd() function.
RSI values are also calculated for each timeframe using the request.security() function along with the ta.rsi() function.
The script then determines the EMA trends for each timeframe by comparing the fast and slow EMAs using simple boolean expressions.
Similarly, it determines the MACD trends for each timeframe by comparing the MACD line with the signal line.
Lastly, it determines the RSI trends for each timeframe by comparing the RSI values with the Bullish and Bearish RSI levels.
PLOTTING AND DASHBOARD:
Color codes are defined based on the EMA, MACD, and RSI trends for each timeframe. Green for Bullish, Red for Bearish.
A dashboard is created using the table.new() function, displaying the trend information for each timeframe with arrows representing Bullish or Bearish conditions.
The dashboard will appear in the top-right corner of the chart, showing the Bullish and Bearish trends for each timeframe (15M, 30M, 1H, 4H, 1D, and 1W) based on EMA, MACD, and RSI analysis. Green arrows represent Bullish trends, red arrows represent Bearish trends, and no arrows indicate Neutral conditions.
INFO ON USED INDICATORS:
1 — EXPONENTIAL MOVING AVERAGE (EMA)
The Exponential Moving Average (EMA) is a type of moving average (MA) that places a greater weight and significance on the most recent data points.
The EMA is calculated by taking the average of the true range over a specified period. The true range is the greatest of the following:
The difference between the current high and the current low.
The difference between the previous close and the current high.
The difference between the previous close and the current low.
The EMA can be used by traders to produce buy and sell signals based on crossovers and divergences from the historical average. Traders often use several different EMA lengths, such as 10-day, 50-day, and 200-day moving averages.
The formula for calculating EMA is as follows:
Compute the Simple Moving Average (SMA).
Calculate the multiplier for weighting the EMA.
Calculate the current EMA using the following formula:
EMA = Closing price x multiplier + EMA (previous day) x (1-multiplier)
2 — MOVING AVERAGE CONVERGENCE DIVERGENCE (MACD)
The Moving Average Convergence Divergence (MACD) is a popular trend-following momentum indicator used in technical analysis. It helps traders identify changes in the strength, direction, momentum, and duration of a trend in a financial instrument's price.
The MACD is calculated by subtracting a longer-term Exponential Moving Average (EMA) from a shorter-term EMA. The most commonly used time periods for the MACD are 26 periods for the longer EMA and 12 periods for the shorter EMA. The difference between the two EMAs creates the main MACD line.
Additionally, a Signal Line (usually a 9-period EMA) is computed, representing a smoothed version of the MACD line. Traders watch for crossovers between the MACD line and the Signal Line, which can generate buy and sell signals. When the MACD line crosses above the Signal Line, it generates a bullish signal, indicating a potential uptrend. Conversely, when the MACD line crosses below the Signal Line, it generates a bearish signal, indicating a potential downtrend.
In addition to the MACD line and Signal Line crossovers, traders often look for divergences between the MACD and the price chart. Divergence occurs when the MACD is moving in the opposite direction of the price, which can suggest a potential trend reversal.
3 — RELATIVE STRENGHT INDEX (RSI):
The Relative Strength Index (RSI) is another popular momentum oscillator used by traders to assess the overbought or oversold conditions of a financial instrument. The RSI ranges from 0 to 100 and measures the speed and change of price movements.
The RSI is calculated based on the average gain and average loss over a specified period, commonly 14 periods. The formula involves several steps:
Calculate the average gain over the specified period.
Calculate the average loss over the specified period.
Calculate the relative strength (RS) by dividing the average gain by the average loss.
Calculate the RSI using the following formula: RSI = 100 - (100 / (1 + RS))
The RSI oscillates between 0 and 100, where readings above 70 are considered overbought, suggesting that the price may have risen too far and could be due for a correction. Readings below 30 are considered oversold, suggesting that the price may have dropped too much and could be due for a rebound.
Traders often use the RSI to identify potential trend reversals. For example, when the RSI crosses above 30 from below, it may indicate the start of an uptrend, and when it crosses below 70 from above, it may indicate the start of a downtrend. Additionally, traders may look for bullish or bearish divergences between the RSI and the price chart, similar to the MACD analysis, to spot potential trend changes.

MAGIC MACDMAGIC MACD ( MACD Indicator with Trend Filter and EMA Crossover confirmation and Momentum). This MACD uses Default Trading view MACD
from Technical indicators library and adding a second MACD along with 3 EMA's to detect Trend and confirm MACD Signal.
Eliminates usage of 3different indicators (Default MACD , MACD-2,EMA5, EMA20, EMA50)
Basic IDEA.
Idea is to filter Histogram when price is above or below 50EMA. Similar to QQE -mod oscillator but Has a EMA Filter
1.Take DEFAULT MACD crossover signals with lower period
2.check with a Higher MACD Histogram.
3.Enter upon EMA crossover signal and Histogram confirmation.
Histogram changes to GRAY when price is below EMA 50 or above EMA 50 (Follows Trend)
4.Exit on next Default MACD crossover signal.
Overview :
Moving Average Convergence Divergence Indicator Popularly Known as MACD is widely used. MACD Usually generates a lots of False signals
and noise in Lower Time Frames, making it difficult to enter a trade in sideways market. Divergence is a major issue along with sideways
movement and tangling of MACD and Signal Lines. There is no way to confirm a Default MACD signal, except to switch time frames and
verify.
Magic MACD Can be used to in combination with other signals.
This MACD uses two MACD Signals to verify the signal given by Default MACD . The Histogram Plot shown is of a higher period
MACD (close,5,50,30) values. When a signal is generated on a lower MACD it is verified by the histogram with higher time period.
Technicals Used:
1. Lower MACD-1 values 12,26 and signal-9 (crossover Signals)
2. Higher MACD-2 values 5,50 and signal-30 (Histogram)
3. EMA 50 (Histogram Filter to allow only if price above or below Ema 50)
4. EMA 5 and EMA 20 for crossover confirmation of trend
What's is in this Indicator?
1.Histogram-(higher period 5,50 and 30signal)
2. MACD crossover Signals-(lower period Default MACD setting)
3.Signal Lines-( EMA 5 & 20)
Implemented & Removed in this Indicator
1. Default MACD and Signal Lines are removed completely
2. MACD crossover are taken on lower periods and plotted as signals(Blue Triangle or Red Triangle)
3. Histogram is plotted from a higher Period providing a clear picture with Higher Time period
4. EMA 5 and EMA 20 are used for MACD signal confirmation
How to use?
Up Signal
1. MACD Default (12,26,30) up signals are shown in Blue
2. Wait till the Histogram changes Blue
3. Look for EMA signals crossover near by
Down Signal
1. MACD Default (12,26,30) up signals are shown in Red
2. Wait till the Histogram changes Red
3. Look for EMA signals crossover near by
Do's
Consider only opposite color as signals
1. Red Triangle on Blue Histogram(likely to move down direction)
2. Blue Triangle on Red Histogram (Likely to move up direction)
Don'ts
1.Ignore Blue Signal on Blue Histogram (pull back signals can be used to enter trade if you miss first crossover)
2.Ignore Red Signal on Red Histogram(pull back signals can be used to enter trade if you miss first crossover)
3.Ignore Up and Down signals till Gray or Blacked out area is finished in Histogram
Tips:
1. EMA plot also shows pull back areas along with signals
2.side by side opposite signals shows sides ways movement
3. EMA 5,20 is plotted on MACD Histogram for Additional Benefit
Thanks & Credits
To Tradingview Team for allowing me to use their default MACD version and coding it in to a MAGIC MACD by adding a few lines of code that
makes it more enhanced.
Warning...!
This is purely for Educational purpose only. Not to be used as a stand alone indicator. Usage is at your own Risk. Please get familiar with its working before implementing. Its not a Financial Advice or Suggestion . Any losses or gains is at your own risk.

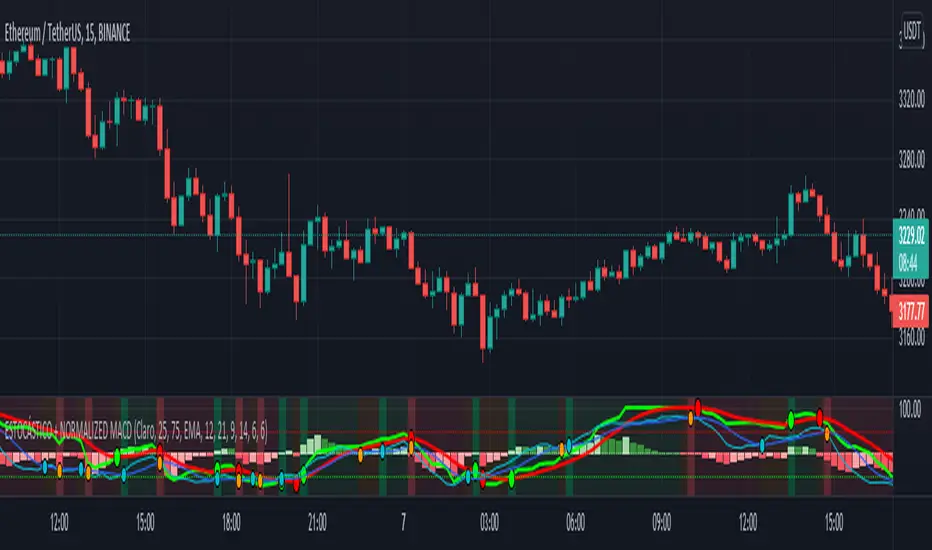
ESTOCÁSTICO + NORMALIZED MACD=== INTRO ===
This is a 2 in 1 indicator, STOCHASTIC + NORMALIZED MACD.
I release this script as public because both stochastic and normalized macd are public, so I cannot find any reason to post it as private :)
=== USAGE ===
You can use any of the indicators by itself as usual, stochastic as a oversold/overbought indicator as a momentum/trend indicator.
Usually, crossovers are used for LONG/SHORT entries.
I added dots for crossovers as well as background colors to show movement direction when both indicators agree: green = bullish, red = bearish and orange = range/consolidation.
=== SETTINGS ===
Default settings for both indicators have been changed (but they're of course configurable), to make them work better together.
You can also change NMACD moving average time to SMA or WMA instead of SMA, SMA is really slow for me but give it a try, WMA is more aggressive.
=== RECOMMENDATIONS ===
Always look for higher timeframes, for example, if you're trading 1h, don't try to catch a 1H "ALL GREEN" LONG while 4H is "ALL RED" because otherwise you're just "trying" to catch a bounce in the 1H chart that could never happen, always trade with the main trend.
Try to catch both crossovers in the opposite area, ex: try to LONG when both indicators are below 50 and SHORT above.
I did not test divergences on this indicator, as the MACD is normalized i prefer to use a standard MACD for that, but you can use the stochastic for sure.
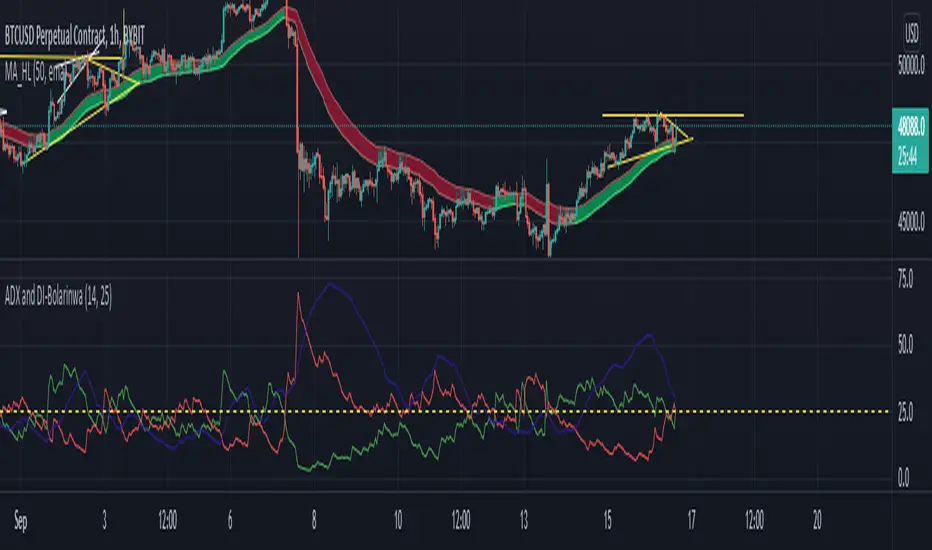
ADX and DI-BolarinwaThe Average Directional Movement Index (ADX) is a technical indicator that measures the strength of a trend. While the indicator itself doesn’t give an insight into the direction of the trend, the Directional Movement lines can be used to determine if the market moves up or down.
The ADX can return a value between 0 and 100. The usual threshold for a market to be considered as trending by the ADX is a value of 25 or above. Values between 25 and 50 signal a trending market, between 50 and 75 very strong trends and between 75 and 100 extremely strong trends.
The ADX Crossover Trading Strategy
A popular trading strategy to trade on the ADX is based on a crossover of the directional movement lines (+DI and -DI) which was developed directly by the indicator’s creator Mr. Wilder.
The trading strategy states that the first condition for a trade setup is that the ADX has a value of 25 or above, which indicates a trending market.
A buy order is triggered when +DI crosses above -DI, i.e. the underlying trend is an uptrend, while a sell signal is triggered when -DI crosses above +DI, i.e. the underlying trend is a downtrend.
Stop-losses are placed at the low of the current trading day, and the trade setup remains valid even if the directional movement lines cross again after the trade signal. Only a break of the current trading day’s low would lead to the trade setup becoming invalid.
If the ADX remains above 25 or rises even higher, indicating that the strength of the underlying trend increases, then traders can put a trailing stop on the trade.
The following chart shows an example of the ADX crossover strategy on the daily EUR/USD pair.
ADX Crossover Strategy
The first cross of -DI above +DI didn’t send a sell signal because the ADX was below 25. The sell signal came with ADX crossing above 25, while the -DI was still above +DI. On the chart, the SL was put just above the day’s high.
The second signal was a buy signal, with the cross of +DI above -DI and the ADX above 25, signaling a strong trend. The stop-loss is placed just below the day’s low, indicated by the dotted line on the chart.
Finally, the third sell signal came with the cross of -DI above -DI and the ADX above 25. Again, the stop-loss is placed just above the day’s high.
While the ADX crossover strategy can also be applied to lower timeframes, you need to be aware that the increased market noise may create more false signals than on the higher timeframes. The following chart is a 5-minute chart with buy and sell signals based on the crossover strategy. Notice that we placed the stop-losses slightly different than in the previous example. In this case, stop-losses have been placed at the recent highs and lows of the price.
ADX Trading Graph
The first buy signal came with +DI crossing above -DI and ADX above 25. In the middle of the chart, you can notice the crosses of the directional movement lines (+DI and -DI) while the ADX was below 25. As ADX needs to be above 25, those crosses are not used as entry triggers based on the ADX crossover strategy.
After that we received a sell signal with -DI crossing above +DI and ADX above 25, which is followed by a buy signal when +DI crossed above -DI.
Using ADX for Trade Confirmations
Beside the ADX crossover strategy which is based on the crosses of +DI and -DI, traders can also use the ADX indicator to supplement other trading strategies. For example, you might want to use a trend-following strategy when ADX shows a strong trend (value above 25), or a trading strategy that is more suited for ranging markets in times when the ADX shows an absence of trends (value below 25).
Before You Trade
The Average Directional Movement Index is a versatile technical indicator that can be used as a stand-alone trading strategy, or in combination with other trading strategies. The ADX crossover strategy is based on the crossover of the directional movement lines (+DI and -DI) and an ADX reading of above 25. While it can be used across all timeframes, it usually returns the best results on higher ones.
As the ADX measures the strength of the underlying trend, trend-following traders can use it to filter flat and ranging markets and avoid trading during those times.
CCI BBThis indicator is the idea of giorno_4_16 .
It shows some indicator lines in your main chart as following:
SMA300, EMA200
BB 20 1,2,3sigma and middle
BB 300 1,2,3sigma and middle
You should put CCI (12, 14) into your separated chart to use the idea.
It shows arrows for registance trading when:
CCI(12) crossovers -200 or corssunders 200 in recent 6bars,
and the price crosses indicator line of SMA200, EMA200 and BB300 1,2,3sigma.
When CCI crossovers -200, you can condisider buying.
When CCI crossunders 200, you can condisider selling.
You should use this indicator in 1H or 4H.
When an arrow appears in 1H, change timeframe to 4H and check the slope of BB20.
If the slope is gentle, take-profit target is MA20 of 1H.
If the slope is steep(ex. CCI crossovers -200 and 4H BB20 go up steeply), take-profit target is BB20 2sigma of 1H.
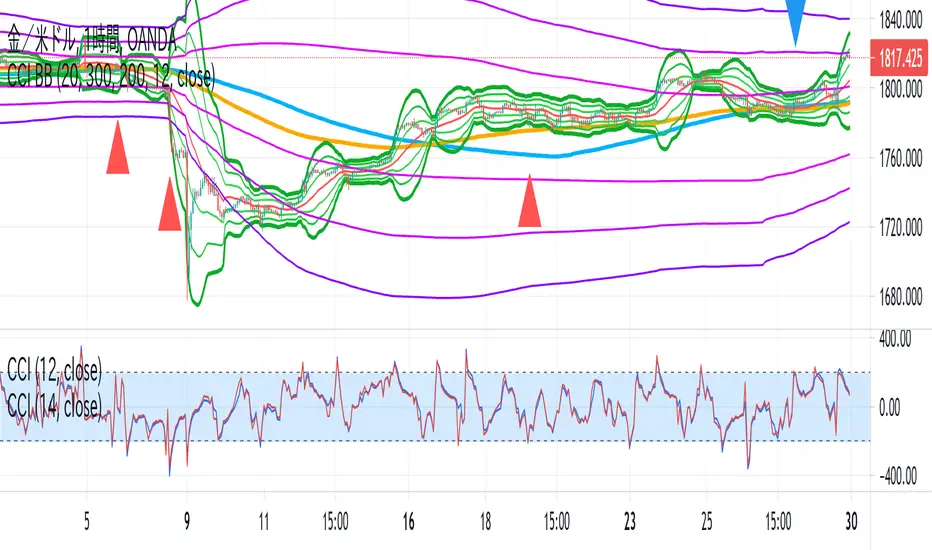
Barholle eMA and RSI Movement TestThis is a test that offers insight into whether and asset is heading into bullish or bearish territory.
This indicator/test offers insight into the Exponential Moving Average's velocity and acceleration as well as the Stochastic RSI's velocity, acceleration and jerk. Included is a 'Stochastic Difference' and 'Stochastic Growth' indicators (commented out) that measure the difference between K and D in the Stoch RSI as well as the rate of it's change. This test is all about crossovers - the best leading indicator is a downward cross of the eMA velocity over the eMA acceleration, indicating a drop in price in the current or next bar.
The lines or importance have been set to -2 and 5, but these should be adjusted to suit your preferences. These numbers were chosen in order to try and create some kind of threshold after which action might be suggested. Backtesting is highly recommended so you can see how the test does and does not work. It is super powerful, but it is not omniscient - its an RSI and eMA derivative, past success does not necessarily dictate future success.
Please look at the code for several more plots you can use of derivatives and other ideas explore but commented out for greater legibility of the graph. Commenting and commenting (or uncommenting all and just disabling some in the settings) and comparing the graphs and crossovers is a useful exercise. To that end, one last concept - the MARSI - a combined moving averages and RSI measurement - was abandoned because it didn't appear to indicate anything of use, however you may find crossovers or patterns with it comparing it to other graphs, so it was left in but commented.
Please take a look at the comments and all the math and indicators 'left on the cutting room floor' in the script. Maybe you'll find a gem in the redux version of this script.
Outreach regarding the script, patterns noticed and full-on stealing of the script are all permitted. Many elements of this script were nabbed from other scripts - thank you to a community of coders who put it all out there.
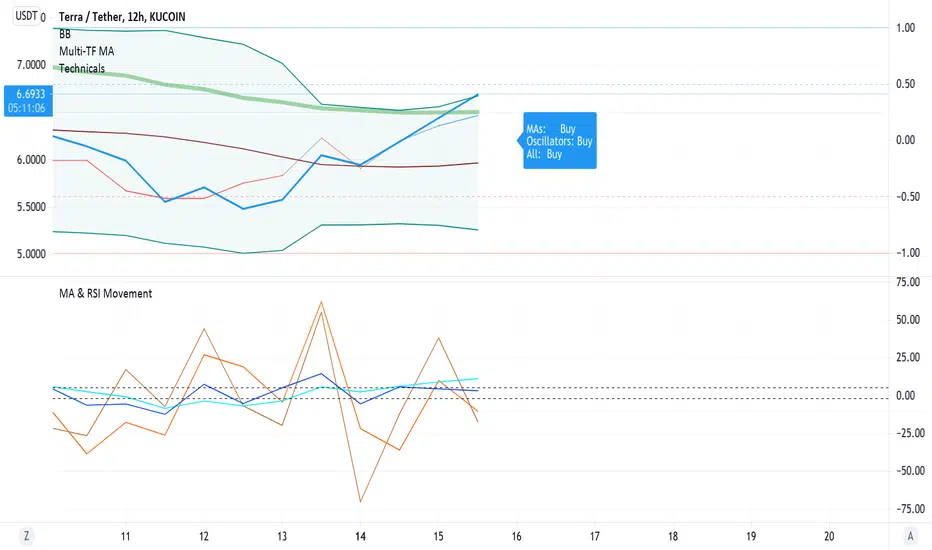
Percentage Price Oscillator (PPO)The Percentage Price Oscillator (PPO) is a momentum oscillator that measures the difference between two moving averages as a percentage of the larger moving average. As with its cousin, MACD, the Percentage Price Oscillator is shown with a signal line, a histogram and a centerline. Signals are generated with signal line crossovers, centerline crossovers, and divergences. First, PPO readings are not subject to the price level of the security. Second, PPO readings for different securities can be compared, even when there are large differences in the price.
Calculations
PPO: {(12-day EMA - 26-day EMA)/26-day EMA} x 100
Signal Line: 9-day EMA of PPO
PPO Histogram: PPO - Signal Line
While MACD measures the absolute difference between two moving averages, PPO makes this a relative value by dividing the difference by the slower moving average (26-day EMA). PPO is simply the MACD value divided by the longer moving average. The result is multiplied by 100 to move the decimal place two spots.
Interpretation
As with MACD, the PPO reflects the convergence and divergence of two moving averages. PPO is positive when the shorter moving average is above the longer moving average. The indicator moves further into positive territory as the shorter moving average distances itself from the longer moving average. This reflects strong upside momentum. The PPO is negative when the shorter moving average is below the longer moving average. Negative readings grow when the shorter moving average distances itself from the longer moving average (goes further negative). This reflects strong downside momentum. The histogram represents the difference between PPO and its 9-day EMA, the signal line. The histogram is positive when PPO is above its 9-day EMA and negative when PPO is below its 9-day EMA. The PPO-Histogram can be used to anticipate signal line crossovers in the PPO.
MACD, PPO and Price
MACD levels are affected by the price of a security. A high-priced security will have higher or lower MACD values than a low-priced security, even if volatility is basically equal. This is because MACD is based on the absolute difference in the two moving averages. Because MACD is based on absolute levels, large price changes can affect MACD levels over an extended period of time. If a stock advances from 20 to 100, its MACD levels will be considerably smaller around 20 than around 100. The PPO solves this problem by showing MACD values in percentage terms.
Conclusions
The Percentage Price Oscillator (PPO) generates the same signals as the MACD, but provides an added dimension as a percentage version of MACD. The PPO levels of the Dow Industrials (price > 20K) can be compared against the PPO levels of IBM (price < 200) because the PPO “levels” the playing field. In addition, PPO levels in one security can be compared over extended periods of time, even if the price has doubled or tripled. This is not the case for the MACD.
Limitations
Despite its advantages, the PPO is still not the best oscillator to identify overbought or oversold conditions because movements are unlimited (in theory). Levels for RSI and the Stochastic Oscillator are limited and this makes them better suited to identify overbought and oversold levels.
Source: Stockcharts

SMAs Ghost in the Machine v3SMAs Ghost in the Machine v3
Created by: MecarderoAurum
Overview
The "SMAs Ghost in the Machine" is a powerful multi-timeframe analysis tool designed for traders who want to align their entries and exits with the trend on several different chart periods simultaneously. At its core, the indicator plots the 9-period and 20-period Simple Moving Averages (SMAs) from up to three user-defined timeframes directly onto your active chart.
Its most powerful feature is the Combined Crossover Signal, which allows you to create highly specific, custom trading setups by defining conditions that must occur at the same time across any of the enabled timeframes. This eliminates guesswork and helps you visually confirm when your precise market conditions are met.
Important Note on Line Drawing
This indicator allows you to see trends of other timeframes. A specific design choice was made not to smooth the moving average lines. This is to ensure that the crossover signals appear on the exact candle where the cross occurs in real-time. Smoothing the lines can cause a delay and shift the signal to a later candle.
The side effect of this accuracy is that the lines will appear "stepped." As new data comes in on your current chart, you may need to refresh the chart to keep the higher timeframe lines updated. We are working on a solution to this.
Capabilities
Multi-Timeframe Analysis: Plot the 9 and 20 SMAs from three different timeframes (e.g., 1-minute, 5-minute, and 30-minute) on a single chart.
Individual Crossover Signals: Automatically plots a green triangle (▲) for a "Golden Cross" (9 SMA crosses above 20) and a red triangle (▼) for a "Death Cross" (9 SMA crosses below 20) on each individual timeframe.
Combined Crossover Engine: Define a custom bullish or bearish signal by combining multiple events. The indicator will plot a green diamond (◆) for your bullish setup and a red diamond (◆) for your bearish setup when all specified conditions are met on the same candle.
Customizable Alerts: Create alerts for both the individual 9/20 SMA crosses and your custom Combined Crossover Signal to ensure you never miss a potential setup.
How to Use the Indicator
Basic Setup
Add the "SMAs Ghost in the Machine v3" indicator to your TradingView chart.
Open the indicator settings.
Under the Timeframe Settings, enable the timeframes you want to monitor and select the desired period for each (e.g., TF1: '1', TF2: '5', TF3: '30').
Configuring the Combined Crossover Signal
This is the core feature for defining your specific trading setups.
In the settings, go to the "Combined Crossover Signal" group and check the box to "Enable Combined Signal."
Decide if you are building a bullish (long) or bearish (short) setup.
Under the "Bullish Setup" or "Bearish Setup" sections, check the boxes for every event that must happen at the same time for your signal to trigger.
Example Bullish Setup:
Let's say your strategy is to go long when:
On the 1-minute chart (TF1), the price crosses above the 9 SMA.
AND, on the 5-minute chart (TF3), the price also crosses above its 9 SMA.
To configure this, you would check the following two boxes under the "Bullish Setup":
TF1: Price crosses above 9 SMA
TF3: Price crosses above 9 SMA
Now, a green diamond (◆) will only appear on your chart when both of those conditions are true on the exact same bar, giving you a precise entry signal.
Setting Up Alerts
Go to the "Alert Settings" tab in the indicator options.
Check the boxes for the alerts you want to enable (e.g., "Alert on TF1 SMA Cross," "Alert on Combined Signal").
Close the settings. Now, right-click on the chart and choose "Add alert."
In the "Condition" dropdown, select "SMA Ghosts v3."
A second dropdown will appear. Choose the specific event you want an alert for, such as Combined Bullish Signal or TF1 Golden Cross.
Configure the alert options as desired and click "Create."
Trading Strategies
Trend Confirmation: Use the indicator on a 1-minute chart with the 5-minute 9/20 SMA lines enabled to see the 5-minute trend. Only take 1-minute trades that are in the same direction as the 5-minute SMAs.
Multi-Flow Alignment: Keep track of bigger timeframes (like the 30-min or 4-hour) to also match your entries with longer-term market flows.
Avoid Flat Markets: Avoid taking trades when the SMA lines from multiple timeframes are flat or moving sideways, as this indicates a lack of clear trend.
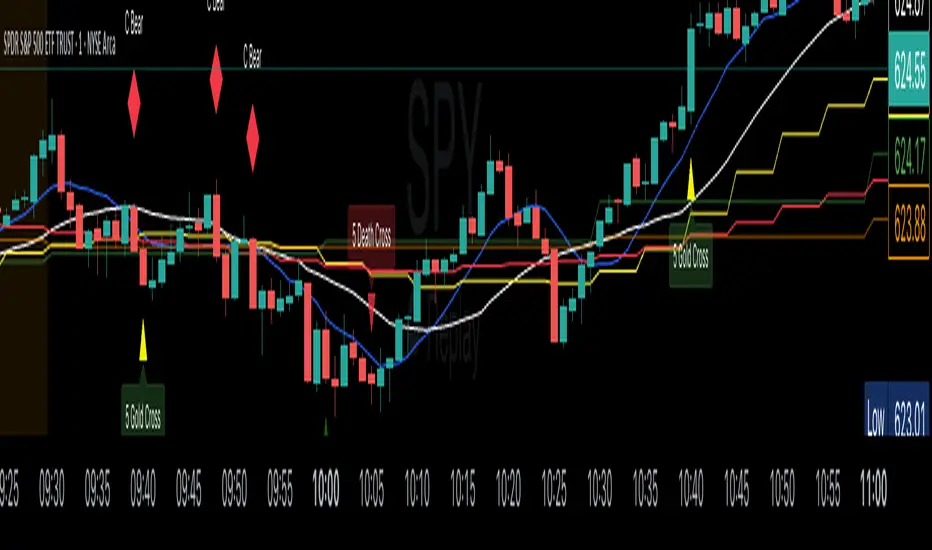
EMA 50 200 Multi-Scanner
EMA 50 200 Multi-Scanner: İndikatör Açıklaması ve Kullanım Kılavuzu
"EMA 50 200 Multi-Scanner" indikatörü, birden fazla kripto para çiftini farklı zaman dilimlerinde tarayan güçlü bir teknik analiz aracıdır. Bu indikatör, 50 periyotluk ve 200 periyotluk Üssel Hareketli Ortalamalar (EMA) arasındaki ilişkiyi analiz ederek, çeşitli zaman dilimlerinde potansiyel alım ve satım fırsatlarını tespit etmenizi sağlar. Hem kısa vadeli trendleri hem de uzun vadeli trendleri gözlemleyerek, piyasa koşullarına uygun stratejiler geliştirmenize yardımcı olur.
Ne İşe Yarar?
Trend Yönünü Belirleme: İndikatör, seçtiğiniz kripto para çiftlerinin her birinde 50 EMA ve 200 EMA arasındaki ilişkiyi analiz eder. Bu analiz, hem kısa vadeli hem de uzun vadeli trendlerin yönünü belirlemenize olanak tanır.
Zaman Dilimleri Arası Analiz: Farklı zaman dilimlerinde çalışabilen bu indikatör, günlük, saatlik, dakikalık gibi çeşitli periyotlarda trendleri ve fiyat hareketlerini incelemenizi sağlar. Bu, hem kısa vadeli ticaret fırsatlarını yakalamak hem de uzun vadeli yatırım kararlarını desteklemek için idealdir.
Alım/Satım Sinyalleri: İndikatör, fiyatın 50 EMA ve 200 EMA ile olan ilişkisini temel alarak alım ve satım sinyalleri üretir. Bu sinyaller, piyasa trendlerinden yararlanarak pozisyon açma veya kapama kararlarınızı destekler.
Dinamik Destek ve Direnç Seviyeleri: EMA seviyeleri, aynı zamanda dinamik destek ve direnç seviyeleri olarak kullanılabilir. Fiyatın bu seviyelere yaklaşması, potansiyel geri dönüş noktalarını veya trendin devamını işaret edebilir.
Nasıl Kullanılır?
İndikatör Ayarları:
EMA Uzunlukları: İhtiyacınıza göre 50 EMA ve 200 EMA'nın periyot uzunluklarını ayarlayabilirsiniz.
Renkler: EMA çizgilerinin rengini tercihinize göre özelleştirebilirsiniz.
Negatif Değerleri Gösterme: Fiyatın EMA seviyelerinin altında olduğu durumlarda negatif değerleri görmek isterseniz, bu özelliği aktif hale getirebilirsiniz.
Semboller: İndikatör, önceden tanımlanmış kripto para çiftleri üzerinde çalışır. Her bir sembol, seçtiğiniz zaman diliminde taranır ve sonuçlar gösterilir. Gereksinimlerinize göre bu sembolleri seçebilir veya çıkarabilirsiniz.
Zaman Dilimleri: İndikatör, TradingView platformundaki tüm zaman dilimlerinde çalışır. Bu, hem kısa vadeli hem de uzun vadeli yatırımcılar için esnek bir analiz olanağı sunar.
Al/Sat Sinyalleri:
Alım Sinyali: 50 EMA, 200 EMA'yı yukarı yönde kestiğinde ve fiyat bu kesişimin üzerinde olduğunda yeşil bir "BUY" etiketi ile gösterilir.
Satım Sinyali: 50 EMA, 200 EMA'yı aşağı yönde kestiğinde ve fiyat bu kesişimin altında olduğunda kırmızı bir "SELL" etiketi ile gösterilir.
"EMA 50 200 Multi-Scanner," çoklu zaman dilimlerinde ve kripto para çiftlerinde trend takibi yapmak isteyen yatırımcılar için etkili ve kullanımı kolay bir araçtır. Piyasa koşullarını daha iyi anlamak ve ticaret stratejilerinizi optimize etmek için bu indikatörü kullanabilirsiniz.
-------------
The "EMA 50 200 Multi-Scanner" is a powerful technical analysis tool designed to scan multiple cryptocurrency pairs across different timeframes. This indicator analyzes the relationship between the 50-period and 200-period Exponential Moving Averages (EMA) to help you identify potential buying and selling opportunities across various timeframes. It enables you to observe both short-term and long-term trends, aiding in the development of market-appropriate strategies.
Purpose
Trend Direction Identification: The indicator analyzes the relationship between the 50 EMA and 200 EMA for each selected cryptocurrency pair, allowing you to determine the direction of both short-term and long-term trends.
Multi-Timeframe Analysis: This indicator can operate across different timeframes, such as daily, hourly, and minute-based periods, allowing you to examine trends and price movements in multiple contexts. It is ideal for capturing short-term trading opportunities and supporting long-term investment decisions.
Buy/Sell Signals: The indicator generates buy and sell signals based on the relationship between the price and the 50 EMA and 200 EMA. These signals support your decision-making process by highlighting opportunities to open or close positions based on market trends.
Dynamic Support and Resistance Levels: The EMA levels can also serve as dynamic support and resistance levels. When the price approaches these levels, it can indicate potential reversal points or trend continuations.
How to Use
Indicator Settings:
EMA Lengths: Adjust the period lengths of the 50 EMA and 200 EMA to suit your needs.
Colors: Customize the colors of the EMA lines according to your preferences.
Show Negative Values: If you want to see negative values when the price is below the EMA levels, you can enable this feature.
Symbols: The indicator works on predefined cryptocurrency pairs. Each symbol is scanned within the selected timeframe, and results are displayed. You can select or deselect symbols according to your requirements.
Timeframes: The indicator functions across all timeframes available on the TradingView platform, offering flexible analysis for both short-term and long-term traders.
Buy/Sell Signals:
Buy Signal: A green "BUY" label is shown when the 50 EMA crosses above the 200 EMA and the price is above this crossover.
Sell Signal: A red "SELL" label is shown when the 50 EMA crosses below the 200 EMA and the price is below this crossover.
The "EMA 50 200 Multi-Scanner" is an effective and user-friendly tool for traders looking to track trends across multiple timeframes and cryptocurrency pairs. You can use this indicator to gain a better understanding of market conditions and optimize your trading strategies.