Three Candle Rolling Pivot Range**Strategy Description: Three Previous Candle Rolling Pivot Range**
**Introduction:**
This trading strategy is based on the concept of the rolling pivot range calculated from the high, low, and close prices of the three previous candles. The rolling pivot range serves as a dynamic support and resistance level, and this strategy aims to capture potential trading opportunities based on the price relationship with this range.
**Strategy Components:**
**1. Rolling Pivot Range Calculation:**
- **Rolling Pivot:** Calculate the rolling pivot by averaging the high, low, and close prices of the three previous candles.
- **Second Number:** Find the midpoint between the high and low of the three previous candles.
- **Pivot Differential:** Measure the difference between the rolling pivot and the second number.
- **Rolling Pivot Range High:** Set as rolling pivot + pivot differential.
- **Rolling Pivot Range Low:** Set as rolling pivot - pivot differential.
**2. Entry Rules:**
- **Long Entry:**
- Initiate a long entry when the current close is above both the rolling pivot range high and the rolling pivot.
- Continue the long entry as long as both the rolling pivot range high and low are higher than the corresponding values of the previous candle.
- **Short Entry:**
- Start a short entry when the current close is below both the rolling pivot range high and the rolling pivot.
- Continue the short entry as long as both the rolling pivot range high and low are lower than the corresponding values of the previous candle.
**Visualization:**
- **Plotting:**
- The rolling pivot range high, rolling pivot, and rolling pivot range low are plotted on the chart for visual reference.
- Long entry points are marked with a green triangle below the corresponding candle.
- Short entry points are marked with a red triangle above the corresponding candle.
**Conclusion:**
This strategy leverages the rolling pivot range to identify potential reversal points in the market. By considering the relative position of the current price compared to the dynamic support and resistance levels, the strategy aims to capture favorable trading opportunities. However, like all trading strategies, it should be used cautiously and backtested thoroughly on historical data to ensure its effectiveness before implementation in a live trading environment. Additionally, risk management techniques should always be applied to safeguard trading capital.
Recherche dans les scripts pour "entry"

TradeTrackerLibrary "TradeTracker"
Simple Library for tracking trades
method track(this)
tracks trade when called on every bar
Namespace types: Trade
Parameters:
this (Trade) : Trade object
Returns: current Trade object
Trade
Has the constituents to track trades generated by any method.
Fields:
id (series int)
direction (series int) : Trade direction. Positive values for long and negative values for short trades
initialEntry (series float) : Initial entry price. This value will not change even if the entry is changed in the lifecycle of the trade
entry (series float) : Updated entry price. Allows variations to initial calculated entry. Useful in cases of trailing entry.
initialStop (series float) : Initial stop. Similar to initial entry, this is the first calculated stop for the lifecycle of trade.
stop (series float) : Trailing Stop. If there is no trailing, the value will be same as that of initial trade
targets (float ) : array of target values.
startBar (series int) : bar index of starting bar. Set by default when object is created. No need to alter this after that.
endBar (series int) : bar index of last bar in trade. Set by tracker on each execution
startTime (series int) : time of the start bar. Set by default when object is created. No need to alter this after that.
endTime (series int) : time of the ending bar. Updated by tracking method.
status (series int) : Integer parameter to track the status of the trade
retest (series bool) : Boolean parameter to notify if there was retest of the entry price
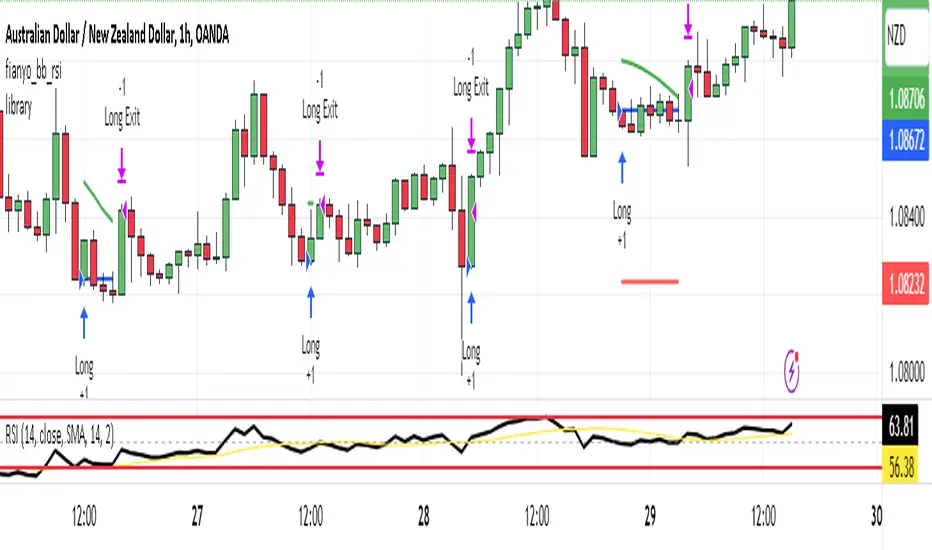
peterzorve-libraryLibrary "library"
is_bullish_engulfing()
is_bearish_engulfing()
is_hammer(fib_level)
Parameters:
fib_level (float)
is_shooting_star(fib_level)
Parameters:
fib_level (float)
is_hammer_and_star(fib_level)
Parameters:
fib_level (float)
is_star_and_hammer(fib_level)
Parameters:
fib_level (float)
is_dogi(dogi_body_ratio)
Parameters:
dogi_body_ratio (float)
is_bear_bear_bullish_engulf()
is_atr_stoploss_takeprofit(atr_multiplier, atr_length, reward_ratio)
Parameters:
atr_multiplier (float)
atr_length (simple int)
reward_ratio (float)
is_fixed_stoploss_takeprofit(stoploss_pips, reward_ratio)
Parameters:
stoploss_pips (float)
reward_ratio (float)
is_step_trailing_stoploss(stoploss_pips)
Parameters:
stoploss_pips (float)
is_atr_trailing_stoploss(atr_multiplier, break_even_pip)
Parameters:
atr_multiplier (float)
break_even_pip (int)
is_pull_back_strategy(length)
Parameters:
length (simple int)
is_trade_statistics(condition, entrypoint, stoploss, takeprofit)
Parameters:
condition (bool)
entrypoint (float)
stoploss (float)
takeprofit (float)
is_table_of_statistics(win_trades, lost_trades, even_trades, pips_won, pips_lost)
Parameters:
win_trades (int)
lost_trades (int)
even_trades (int)
pips_won (float)
pips_lost (float)
is_pine_info(lotsize, stoploss, takeprofit)
Parameters:
lotsize (float)
stoploss (float)
takeprofit (float)
is_support_and_resistance_strategy(look_back, look_forward)
Parameters:
look_back (int)
look_forward (int)
is_choral_strategy(smoothing_period, constant_d)
Parameters:
smoothing_period (int)
constant_d (float)
is_bollinger_band_strategy(length, dev_entry, dev_stoploss, dev_takeprofit)
Parameters:
length (int)
dev_entry (simple float)
dev_stoploss (simple float)
dev_takeprofit (simple float)
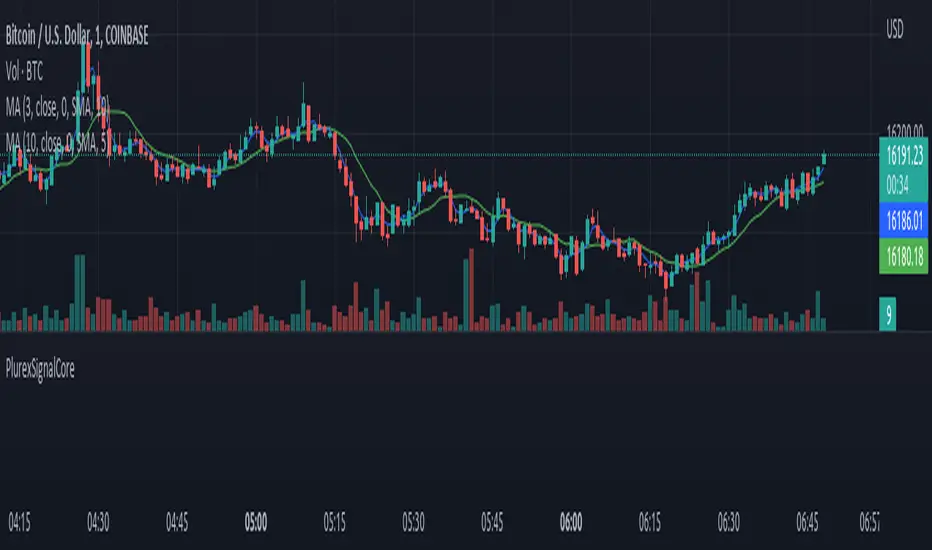
PlurexSignalCoreLibrary "PlurexSignalCore"
General purpose functions and helpers for use in more specific Plurex Signal alerting scripts and libraries
plurexMarket()
Build a Plurex market string from a base and quote asset symbol.
Returns: A market string that can be used in Plurex Signal messages.
tickerToPlurexMarket()
Builds Plurex market string from the syminfo
Returns: A market string that can be used in Plurex Signal messages.
simpleMessage(secret, action, marketOverride)
Builds Plurex Signal Message json to be sent to a Signal webhook
Parameters:
secret : The secret for your Signal on plurex
action : The action of the message. One of .
marketOverride : Optional, defaults to the syminfo for the ticker. Use the `plurexMarket` function to build your own.
Returns: A json string message that can be used in alerts to send messages to Plurex.
entryMessage(secret, isLong, budgetPercentage, priceLimit, marketOverride)
Builds Plurex Signal Entry Message json to be sent to a Signal webhook with optional parameters for budget and price limits.
Parameters:
secret : The secret for your Signal on plurex
isLong : The action of the message. true for LONG, false for SHORT.
budgetPercentage : Optional, The percentage of budget to use in the entry.
priceLimit : Optional, The worst price to accept for the entry.
marketOverride : Optional, defaults to the syminfo for the ticker. Use the `plurexMarket` function to build your own.
Returns: A json string message that can be used in alerts to send messages to Plurex.
long(secret, budgetPercentage, priceLimit, marketOverride)
Builds Plurex Signal LONG Message json to be sent to a Signal webhook with optional parameters for budget and price limits.
Parameters:
secret : The secret for your Signal on plurex
budgetPercentage : Optional, The percentage of budget to use in the entry.
priceLimit : Optional, The worst price to accept for the entry.
marketOverride : Optional, defaults to the syminfo for the ticker. Use the `plurexMarket` function to build your own.
Returns: A json string message that can be used in alerts to send messages to Plurex.
short(secret, budgetPercentage, priceLimit, marketOverride)
Builds Plurex Signal SHORT Message json to be sent to a Signal webhook with optional parameters for budget and price limits.
Parameters:
secret : The secret for your Signal on plurex
budgetPercentage : Optional, The percentage of budget to use in the entry.
priceLimit : Optional, The worst price to accept for the entry.
marketOverride : Optional, defaults to the syminfo for the ticker. Use the `plurexMarket` function to build your own.
Returns: A json string message that can be used in alerts to send messages to Plurex.
closeAll(secret, marketOverride)
Builds Plurex Signal CLOSE_ALL Message json to be sent to a Signal webhook.
Parameters:
secret : The secret for your Signal on plurex
marketOverride : Optional, defaults to the syminfo for the ticker. Use the `plurexMarket` function to build your own.
Returns: A json string message that can be used in alerts to send messages to Plurex.
closeShorts(secret, marketOverride)
Builds Plurex Signal CLOSE_SHORTS Message json to be sent to a Signal webhook.
Parameters:
secret : The secret for your Signal on plurex
marketOverride : Optional, defaults to the syminfo for the ticker. Use the `plurexMarket` function to build your own.
Returns: A json string message that can be used in alerts to send messages to Plurex.
closeLongs(secret, marketOverride)
Builds Plurex Signal CLOSE_LONGS Message json to be sent to a Signal webhook.
Parameters:
secret : The secret for your Signal on plurex
marketOverride : Optional, defaults to the syminfo for the ticker. Use the `plurexMarket` function to build your own.
Returns: A json string message that can be used in alerts to send messages to Plurex.
closeFirstLong(secret, marketOverride)
Builds Plurex Signal CLOSE_FIRST_LONG Message json to be sent to a Signal webhook.
Parameters:
secret : The secret for your Signal on plurex
marketOverride : Optional, defaults to the syminfo for the ticker. Use the `plurexMarket` function to build your own.
Returns: A json string message that can be used in alerts to send messages to Plurex.
closeLastLong(secret, marketOverride)
Builds Plurex Signal CLOSE_LAST_LONG Message json to be sent to a Signal webhook.
Parameters:
secret : The secret for your Signal on plurex
marketOverride : Optional, defaults to the syminfo for the ticker. Use the `plurexMarket` function to build your own.
Returns: A json string message that can be used in alerts to send messages to Plurex.
closeFirstShort(secret, marketOverride)
Builds Plurex Signal CLOSE_FIRST_SHORT Message json to be sent to a Signal webhook.
Parameters:
secret : The secret for your Signal on plurex
marketOverride : Optional, defaults to the syminfo for the ticker. Use the `plurexMarket` function to build your own.
Returns: A json string message that can be used in alerts to send messages to Plurex.
closeLastShort(secret, marketOverride)
Builds Plurex Signal CLOSE_LAST_SHORT Message json to be sent to a Signal webhook.
Parameters:
secret : The secret for your Signal on plurex
marketOverride : Optional, defaults to the syminfo for the ticker. Use the `plurexMarket` function to build your own.
Returns: A json string message that can be used in alerts to send messages to Plurex.
SSL + Wave Trend StrategyStrategy incorporates the following features:
Risk management:
Configurable X% loss per stop loss
Configurable R:R ratio
Trade entry:
Based on strategy conditions below
Trade exit:
Based on strategy conditions below
Backtesting:
Configurable backtesting range by date
Trade drawings:
Each entry condition indicator can be turned on and off
TP/SL boxes drawn for all trades. Can be turned on and off
Trade exit information labels. Can be turned on and off
NOTE: Trade drawings will only be applicable when using overlay strategies
Alerting:
Alerts on LONG and SHORT trade entries
Debugging:
Includes section with useful debugging techniques
Strategy conditions
Trade entry:
LONG
C1: SSL Hybrid baseline is BLUE
C2: SSL Channel crosses up (green above red)
C3: Wave Trend crosses up (represented by pink candle body)
C4: Entry candle height is not greater than configured threshold
C5: Entry candle is inside Keltner Channel (wicks or body depending on configuration)
C6: Take Profit target does not touch EMA (represents resistance)
SHORT
C1: SSL Hybrid baseline is RED
C2: SSL Channel crosses down (red above green)
C3: Wave Trend crosses down (represented by orange candle body)
C4: Entry candle height is not greater than configured threshold
C5: Entry candle is inside Keltner Channel (wicks or body depending on configuration)
C6: Take Profit target does not touch EMA (represents support)
Trade exit:
Stop Loss: Size configurable with NNFX ATR multiplier
Take Profit: Calculated from Stop Loss using R:R ratio
Credits
Strategy is based on the YouTube video "This Unique Strategy Made 47% Profit in 2.5 Months " by TradeSmart.
It combines the following indicators to determine trade entry/exit conditions:
Wave Trend: Indicator: WaveTrend Oscillator by @LazyBear
SSL Channel: SSL channel by @ErwinBeckers
SSL Hybrid: SSL Hybrid by @Mihkel00
Keltner Channels: Keltner Channels Bands by @ceyhun
Candle Height: Candle Height in Percentage - Columns by @FreeReveller
NNFX ATR: NNFX ATR by @sueun123

[MT Trader] Backtest template w/ Supertrend Strategy---EN: In this strategy template you will find some functions already pre-programmed to be used in your strategies to speed up the programming process, among them we can highlight the default stop loss and take profit functions, which will help to set easily and quickly, defining the price range in which we want to prevent large losses or protect our profits from unexpected market movements.
🔴 Stop Loss: Among the functions of the stop loss are the 4 most known, first we have the fixed percentage range (%) and price ($), when the price reaches this fixed price will limit the losses of the operation avoiding larger losses, then we have the average true range (ATR), a moving average of true range and X period that can give us good reference points to place our stop loss, finally the last point higher or lower is the most used by traders to place their stop loss.
In addition, the price range between the entry and stop loss can be converted into a trailing stop loss.
🟢 Take Profit: We have 3 options for take profit, just like stop loss, the fixed range of percentage(%) and price($), are available, in addition to this we have the 1:# ratio option, which multiplies by X number the range between the entry and stop loss to use it as take profit, perfect for strategies that use ATR or last high/low point for their strategy.
📈 Heikin Ashi Entrys: The heikin ashi entries are trades that are calculated based on heikin ashi candles but their price is executed in Japanese candles, thus avoiding the false results that occur in heikin candlestick charts, making that in certain cases better results are obtained in the strategies that are executed with this option compared to Japanese candlesticks.
📊 Dashboard: A more visual and organized way to see the results and data needed for our strategy.
Feel free to use this template to program your own strategies, if you find bugs or want to request a new feature let me know in the comments or through my telegram @hvert_mt
__________________________________________________________________________________________________________________________________________________
---ES: En esta plantilla de estrategia podrás encontrar algunas funciones ya pre-programadas para ser usadas en tus estrategias para acelerar procesos de programación, entre ellas podemos destacar las funciones por defecto de stop loss y take profit, que ayudaran a establecer de manera fácil y rápida, definiendo los rango de precio en los que queremos prevenirnos de perdidas grandes o proteger nuestras ganancias de movimientos inesperados del mercado.
🔴 Stop Loss: Entre las funciones del stop loss están las 4 más conocidas, en primer lugar tenemos el rango de porcentaje fijo(%) y el precio($), cuando el precio alcance este precio fijo se limitaran las perdidas de la operación evitando perdidas mas grandes, después tenemos el promedio de rango verdadero(ATR), una media móvil del rango verdadero y X periodo que nos puede dar buenos puntos de referencia para colocar nuestro stop loss, por ultimo el ultimo punto mas alto o mas bajo es de los mas usados por los traders para colocar su stop loss.
Adicional a esto, el rango de precio entre la entrada y el stop loss se puede convertir en un trailing stop loss.
🟢 Take Profit: Tenemos 3 opciones para take profit, al igual que en el stop loss, el rango fijo de porcentaje(%) y precio($) se encuentran disponibles, adicional a esto tenemos la opción de ratio 1:#, que multiplica por X numero el rango entre la entrada y el stop loss para usarlo como take profit, perfecto para estrategias que usen ATR o ultimo punto alto/bajo.
📈 Entradas Heikin Ashi: Las entradas Heikin Ashi son trades que son calculados en base a las velas Aeikin Ashi pero su precio esta ejecutado a velas japonesas, evitando así los falsos resultados que se producen en graficas de velas Heikin, esto haciendo que en ciertos casos se obtengan mejores resultados en las estrategias que son ejecutadas con esta opción en comparación con las velas japonesas.
📊 Panel de Control: Una manera mas visual y organizada de ver los resultados y datos necesarios de nuestra estrategia.
Siéntete libre de usar esta plantilla para programar tus propias estrategias, si encuentras errores o quieres solicitar una nueva función házmelo saber en los comentarios o a través de mi Telegram: @hvert_mt

Rainbow Oscillator The Rainbow Oscillator is a technical indicator that shows prices in overbought or oversold areas. That allows you to catch the price reversal point.
---------------
FEATURES
---------------
.:: Dynamic levels ::.
The indicator levels are divided into several zones, which have a fibonacci ratio. Zones determine the overbought/oversold level. Blue and green level zones are better for buying, red and orange for selling. Dynamic levels are used as replacements for classic levels such as -100 and 100 for the CCI indicator or 30 and 70 for the RSI indicator. Dynamic levels work much better than static levels, as they are more adaptive to the current market situation.
.:: Composite oscillator (3 in 1) ::.
The main signal line of the indicator includes all three oscillators RSI, CCI, Stoch in different ratios. In the settings, you can change the proportions or completely remove one of the oscillators by setting its weight to 0
.:: CCI + RSI + Stoch ratio setting ::.
Each of the oscillators has its own weight in the calculation formula: w2 * cci ( + w1 * ( rsi - 50) + (1 - w2 - w1) * ( stoch - 50), this allows you to create the resulting oscillator from all indicators, depending on the weight of each of them. Each weight value must be between 0 and 1 so that the sum of all weights does not exceed 1.
.:: Smoothing levels and lines of the oscillator ::.
Smoothing the oscillator readings allows you to filter out the noise and get more accurate data. Level offset allows you to customize the support for inputs.
.:: Market Flat ::.
Dynamic creation of levels allows you to find in the price reversal zone, even when the price is in a flat
.:: Sources ::.
You can change the data source for the indicator to the number of longs and shorts for the selected asset. For example, BTCUSDLONGS / BTCUSDSHORTS is perfect for Bitcoin, then the oscillator will work on this data and will not use the quote price.
.:: Trend Detection ::.
The main line of the oscillator has 2 colors - green and red. Red means downtrend, green means uptrend. Trend reversal points are most often found in overbought and oversold zones.
.:: Alerts ::.
Alerts inside for next events: Buy (blue point) Sell (red point) and TrendReversal (change line color)
----------------
TRADING
—-------------
There are several possible entry points for the indicator, let's consider them all.
1) Trend reversal.
Long entry: The indicator line is in the green zone below 0 (oversold), while the line changes color from red (downward) to green (upward)
Short entry: The indicator line is in the red zone above the 0 (overbought) mark, while the line changes color from green to red.
2) Red and blue dots.
Long entry: Blue dot
Short Entry: Red Dot
I prefer to use the first trading method.
----------------
SETTINGS
----------------
.:: Trend Filter (checkbox) ::.
Use trend confirmation for red/blue dots. When enabled, the blue dot requires an uptrend, red dot requires downtrend confirmation before appearing.
.:: Use long/shorts (checkbox) ::.
Change formula to use longs and shorts positions as data source (instead of quote price)
.:: RSI weight / CCI weight / Stoch weight ::.
Weight control coefficients for RSI and CCI indicators, respectively. When you set RSI Weight = 0, equalize the combo of CCI and Stoch , when RSI Weight is zero and CCI Weight is equal to the oscillator value will be plotted
only from Stoch . Intermediate values have a high degree of measurement of each of the three oscillators in percentage terms from 0 to 100. The calculation uses the formula: w2 * cci ( + w1 * ( rsi - 50) + (1 - w2 - w1) * ( stoch - 50),
where w1 is RSI Weight and w2 is CCI Weight, Stoch weight is calculated on the fly as (1 - w2 - w1), so the sum of w1 + w2 should not exceed 1, in this case Stoch will work as opposed to CCI and RSI .
.:: Oscillograph fast and slow periods ::.
The fast period is the period for the moving average used to smooth CCI, RSI and Stoch. The slow period is the same. The fast period must always be less than the slow period.
.:: Oscillograph samples period::.
The period of smoothing the total values of indicators - creates a fast and slow main lines of the oscillator.
.:: Oscillograph samples count::.
How many times smoothing applied to source data.
.:: Oscillator samples type ::.
Smoothing line type e.g. EMA, SMA, RMA …
.:: Level period ::.
Periodically moving averages used to form the levels (zone) of the Rainbow Oscillator indicator
.:: Level offset ::.
Additional setting for shifting levels from zero points. Can be useful for absorbing levels and filtering input signals. The default is 0.
.:: Level redundant ::.
It characterizes the severity of the state at each iteration of the level of the disease. If set to 1 - the levels will not decrease when the oscillator values fall. If it has a value of 0.99 - the levels are reduced by 0.01
each has an oscillator in 1% of cases and is pressed to 0 by more aggressive ones.
.:: Level smooth samples ::.
setting allows you to set the number of strokes per level. Measuring the number of averages with the definition of the type of moving averages
.:: Level MA Type ::.
Type of moving average, average for the formation of a smoothing overbought and oversold zone

Trending Bar SRTrending Bar SR is a simple script define a Bar called "Trending Bar".
Depend on direction of Trending Bar, if Trending Bar is UpTrend then this indicator plot Bar's Low Price as Support and if Trending Bar is DownTrend then it plot Bar's High Price as Resistance.
Beside, this indicaor also plot 4 levels retracement of Trending Bar for trading.
1. Define Trending Bar
1.1 Uptrend Bar
+ Close Price higher than previous High Price
+ Body greater than sum of shadows (up and down)
+ Color: A green dot is plotted at bottom chart.
1.2 Downtrend Bar
+ Close Price lower than previous Low Price
+ Body greater than sum of shadows (up and down)
+ Color: A red dot is plotted at bottom chart.
2. Retracement Level
+ Trending Bar Retracement 0.5 is called Equerium.
+ Trending Bar Retracement 0.618 is called Perfect Entry.
+ Trending Bar Retracement 0.705 is called Optimal Entry.
+ Trending Bar Retracement 0.79 is called Max Entry.
3. Trading
+ When Price crossed Equerium, consider open position at Perfect Entry, Optimal Entry with stoploss place at Max Entry.
+ If place order at Max Entry, stoploss can place at Support or Resistance.

Double SupertrendThis strategy is based on a custom indicator that was created based on the Supertrend indicator. At its core, there are always 2 super trend indicators with different factors to reduce market noise (false signals).
The strategy/indicator has some parameters to improve the signals and filters.
TECHNICAL ANALYSIS
☑ Show Indicators
This option will enable/disable the Supertrend indicators on the chart.
☑ Length
The length will be used on the Supertrend Indicator to calculate its values.
☑ Dev Fast
The fast deviation or factor from one of the super trend indicators. This will be the leading indicator for entry signals, as well as for the exit signals.
☑ Dev Slow
The slow deviation or factor from one of the super trend indicators. This will be the confirmation indicator for entry and exit signals.
☑ Exit Type
It's possible to select from 4 options for the exit signals. Exit signals always take profit target.
☑ ⥹ Reversals
This option will make the strategy/indicator calculate the exit signals based on the difference between the given period's highest and lowest candle value (see Period on this list). It's displayed on the chart with the cross. As it's possible to verify in the image below, there are multiple exit spots for every entry.
☑ ⥹ ATR
Using ATR as a base indicator for exit signals will make the strategy/indicator place limit/stop orders. Candle High + ATR for longs, Candle Low - ATR for shorts. The strategy will show the ATR level for take profit and stick with it until the next signal. This way, the take profit value remains based on the candle of the entry signal.
☑ ⥹ Fast Supertrend
With this option selected, the exit signals will be based on the Fast Supertsignal value, mirrored to make a profit.
☑ ⥹ Slow Supertrend
With this option selected, the exit signals will be based on the Slow Supertsignal value, which is mirrored to take profit.
☑ Period
This will represent the number of candles used on the exit signals when Reversals is selected as Exit Type. It's also used to calculate the gradient used on the Fills and Supertrend signals.
☑ Multiplier
It's used on the take profit when the ATR option is selected on the Exit Type.
STRATEGY
☑ Use The Strategy
This will enable/disable the strategy to show the trades calculations.
☑ Show Use Long/Short Entries
Option to make the strategy show/use Long or Short signals. Available only if Use The Strategy is enabled
☑ Show Use Exit Long/Short
Option to make the strategy show/use Exit Long or Short signals (valid when Reversals option is selected on the Exit Type). Available only if Use The Strategy is enabled
☑ Show Use Add Long/Short
Option to make the strategy show/use Add Long or Short signals. With this option enabled, the strategy will place multiple trades in the same direction, almost the same concept as a pyramiding parameter. It's based on the Fast Supersignal when the candle fails to cross and reverses. Available only if Use The Strategy is enabled
☑ Trades Date Start/End
The date range that the strategy will check the market data and make the trades
HOW TO USE
It's very straightforward. A long signal will appear as a green arrow with a text Long below it. A short signal will appear as a red arrow with a text Short above it. It's ideal to wait for the candle to finish to validate the signal.
The exit signals are optional but give a good idea of the configuration used when backtesting. Each market and timeframe will have its own configuration for the best results. On average, sticking to ATR as an exit signal will have less risk than the other options.
☑ Entry Signals
Follow the arrows with Long/Short texts on them. Wait for the signal candle to close to validate the entry.
☑ Exit Signals
Use them to close your position or to trail stop your orders and maximize profits. Select the exit type suitable for each timeframe and market
☑ Add Entries
It's possible to increase the position following the add margin/contracts based on the Add signals. Not mandatory, but may work as reentries or late entries using the same signal.
☑ What about Stop Loss?
The stop-loss levels were not included as a separated signal because it's already in the chart. There are some possible ideas for the stop loss:
☑⥹ Candle High/Low (2nd recommend option)
When it's a Long signal from the entry signal candle, the stop loss can be the Low value of the same candle. Very tight stop loss in some cases, depending on the candle range
☑⥹ Local Top/Bottom
Selecting the local top/bottom as stop loss will give the strategy more room for false breakouts or reversals, keeping the trade open and minimizing noises. Increases the risk
☑⥹ Fast Supertrend (1st recommend option)
The fast supertrend can be used as stop-loss as well. making it a moving level and working close to trail stop management
☑⥹ Fixed Percentage
It's possible to use a fixed risk percentage for the trades, making the risk easier to control and project. Since the market volatility is not fixed, this may affect the accuracy of the trades
☑⥹ Based on the ATR (3rd recommend option)
When the exit type option ATR is selected, it will display the take profit level for that entry. Just mirror that value and put it as stop-loss, or multiply that amount by 1.5 to have more room for market noise.
EXAMPLE CONFIGURATIONS
Here are some configuration ideas for some markets (all of them are from crypto, especially futures markets)
BTCUSDT 15min - Default configuration
BTCUSDT 1h - Length 10 | Dev Fast 3 | Dev Slow 4 | Exit Type ATR | Period 50 | Multiplier 1
BTCUSDT 4h - Length 10 | Dev Fast 2 | Dev Slow 4 | Exit Type ATR | Period 50 | Multiplier 1
ETHUSDT 15min - Length 20 | Dev Fast 1 | Dev Slow 3 | Exit Type Fast Supertrend | Period 50 | Multiplier 1
IOTAUSDT 15min - Length 10 | Dev Fast 1 | Dev Slow 2 | Exit Type Slow Supertrend | Period 50 | Multiplier 1
OMGUSDT 15min - Length 10 | Dev Fast 1 | Dev Slow 4 | Exit Type Slow Supertrend | Period 50 | Multiplier 1
VETUSDT 15min - Length 10 | Dev Fast 3 | Dev Slow 4 | Exit Type Slow Supertrend | Period 50 | Multiplier 1
HOW TO FIND OTHER CONFIGURATIONS
Here are some steps to find suitable configurations
select a market and time frame
enable the Use This Strategy option on the strategy
open the strategy tester panel and select the performance summary
open the strategy configuration and go to properties
change the balance to the same price of the symbol (example: BTCUSDT 60.000, use 60.000 as balance)
go back to the inputs tab and keep changing the parameters until you see the net profit be positive and bigger than the absolute value of the drawdown
in case you can't find a suitable configuration, try other timeframes
Since the tester reflects what happened in the past candles, it's not guaranteed to give the same results. However, this indicator/Strategy can be used with other indicators as a leading signal or confirmation signal.

Forex Scalping 1min Bollinger Bands, RSI and ADX Trading SystemThis is a Forex Scalping Trading Sytem based on the Bollinger Bands.
Its suited for major pairs, with lowest possible comission (below 1 pip) and with timeframes ranging between 1-15 min.
Indicators:
Bollinger bands
ADX
RSI
Rules for entry:
Long Entry: price to move below the upper Bollinger Bands RSI raise above the 30 line and ADX<32 at the same time.
Short Entry: price to move above the upper Bollinger Bands, RSI raise below the 70 line and ADX<32 at the same time.
Rules for exit
Profit Exit: 3 options: 1, exit position when the price touches the middle band, 2) when the price touches the opposite band, X pips target profit.
Loss Exit: X pips loss

Altered True Strength Indicator (TSI) Reupload-
Altered TSI provides a slightly more volatile signal that demonstrates extremities in price action with greater success than standard TSI. In addition, I added bull/bear cross indicators (green/red) to make it easier to notice the crosses to save time when the market is moving fast (I couldn't find a regular TSI script with this addition). Finally, the signal also has overextension parameters (red and green lines)
I think this is best used on Intraday time frames as the signals respond to volatility very well and using Heikin Ashi candles, trend is more visual. In this particular example, I am showing SPY on the 3m time chart (my favorite short time frame) and the signal alone provided many opportunities for trades when using simple divergences and countering overextension direction when short term (blue) signal crosses either
In the first example (purple lines), SPY ramps but it was a dull signal given the signal strength flatlining- we would be looking for a short entry. When the signal fires, it provides a clean $1.50 move down in spy.
In the second example (orange), the blue signal provides a nice V shape (rebound signal) in which we are looking for a long entry. 390.50 is a strong SPY support in confluence with 2nd std dev VWAP extension, but disregarding that bull signal fires resulting in a 2 dollar move upwards. Exit is provided when blue line crosses green overextension.
In the third example (white), we are searching for a short entry at 392.5 resistance in confluence with divergently higher highs. Bear cross signal when fired and a significant cross is visible provides a $2.50 move to the downside with a potential exit provided when blue line crosses red overextension line in confluence with previous LOD area.
In the fourth example (green), we watch as the blue line provides a V pattern, we are searching for a long entry. If you didn't take a riskier long at 2nd std dev VWAP overextension with V recovery on blue line at red overextension for a ride to vwap, then you are looking for a secondary entry long as you wouldn't take the trade at resistance (vwap). Bullishly divergent lows provide this entry and the signal does not bear cross at all (but looking for significant crosses is more important even if the signal were to make a minor bear cross). Bullishly divergent double bottom provides a long entry to end of day with a nice clean signal for a $5.00 move until eod or when signal crosses overextension range.
Ideally, close to the money options or SPY/SPXS/SPXL are best used in the intraday time frame.
Again, this is not a standalone indicator but it's best used in conjunction with other indicators/trading strategies
Any questions feel free to comment

Ruckard TradingLatinoThis strategy tries to mimic TradingLatino strategy.
The current implementation is beta.
Si hablas castellano o espanyol por favor consulta MENSAJE EN CASTELLANO más abajo.
It's aimed at BTCUSDT pair and 4h timeframe.
STRATEGY DEFAULT SETTINGS EXPLANATION
max_bars_back=5000 : This is a random number of bars so that the strategy test lasts for one or two years
calc_on_order_fills=false : To wait for the 4h closing is too much. Try to check if it's worth entering a position after closing one. I finally decided not to recheck if it's worth entering after an order is closed. So it is false.
calc_on_every_tick=false
pyramiding=0 : We only want one entry allowed in the same direction. And we don't want the order to scale by error.
initial_capital=1000 : These are 1000 USDT. By using 1% maximum loss per trade and 7% as a default stop loss by using 1000 USDT at 12000 USDT per BTC price you would entry with around 142 USDT which are converted into: 0.010 BTC . The maximum number of decimal for contracts on this BTCUSDT market is 3 decimals. E.g. the minimum might be: 0.001 BTC . So, this minimal 1000 amount ensures us not to entry with less than 0.001 entries which might have happened when using 100 USDT as an initial capital.
slippage=1 : Binance BTCUSDT mintick is: 0.01. Binance slippage: 0.1 % (Let's assume). TV has an integer slippage. It does not have a percentage based slippage. If we assume a 1000 initial capital, the recommended equity is 142 which at 11996 USDT per BTC price means: 0.011 BTC. The 0.1% slippage of: 0.011 BTC would be: 0.000011 . This is way smaller than the mintick. So our slippage is going to be 1. E.g. 1 (slippage) * 0.01 (mintick)
commission_type=strategy.commission.percent and commission_value=0.1 : According to: binance . com / en / fee / schedule in VIP 0 level both maker and taker fees are: 0.1 %.
BACKGROUND
Jaime Merino is a well known Youtuber focused on crypto trading
His channel TradingLatino
features monday to friday videos where he explains his strategy.
JAIME MERINO STANCE ON BOTS
Jaime Merino stance on bots (taken from memory out of a 2020 June video from him):
'~
You know. They can program you a bot and it might work.
But, there are some special situations that the bot would not be able to handle.
And, I, as a human, I would handle it. And the bot wouldn't do it.
~'
My long term target with this strategy script is add as many
special situations as I can to the script
so that it can match Jaime Merino behaviour even in non normal circumstances.
My alternate target is learn Pine script
and enjoy programming with it.
WARNING
This script might be bigger than other TradingView scripts.
However, please, do not be confused because the current status is beta.
This script has not been tested with real money.
This is NOT an official strategy from Jaime Merino.
This is NOT an official strategy from TradingLatino . net .
HOW IT WORKS
It basically uses ADX slope and LazyBear's Squeeze Momentum Indicator
to make its buy and sell decisions.
Fast paced EMA being bigger than slow paced EMA
(on higher timeframe) advices going long.
Fast paced EMA being smaller than slow paced EMA
(on higher timeframe) advices going short.
It finally add many substrats that TradingLatino uses.
SETTINGS
__ SETTINGS - Basics
____ SETTINGS - Basics - ADX
(ADX) Smoothing {14}
(ADX) DI Length {14}
(ADX) key level {23}
____ SETTINGS - Basics - LazyBear Squeeze Momentum
(SQZMOM) BB Length {20}
(SQZMOM) BB MultFactor {2.0}
(SQZMOM) KC Length {20}
(SQZMOM) KC MultFactor {1.5}
(SQZMOM) Use TrueRange (KC) {True}
____ SETTINGS - Basics - EMAs
(EMAS) EMA10 - Length {10}
(EMAS) EMA10 - Source {close}
(EMAS) EMA55 - Length {55}
(EMAS) EMA55 - Source {close}
____ SETTINGS - Volume Profile
Lowest and highest VPoC from last three days
is used to know if an entry has a support
VPVR of last 100 4h bars
is also taken into account
(VP) Use number of bars (not VP timeframe): Uses 'Number of bars {100}' setting instead of 'Volume Profile timeframe' setting for calculating session VPoC
(VP) Show tick difference from current price {False}: BETA . Might be useful for actions some day.
(VP) Number of bars {100}: If 'Use number of bars (not VP timeframe)' is turned on this setting is used to calculate session VPoC.
(VP) Volume Profile timeframe {1 day}: If 'Use number of bars (not VP timeframe)' is turned off this setting is used to calculate session VPoC.
(VP) Row width multiplier {0.6}: Adjust how the extra Volume Profile bars are shown in the chart.
(VP) Resistances prices number of decimal digits : Round Volume Profile bars label numbers so that they don't have so many decimals.
(VP) Number of bars for bottom VPOC {18}: 18 bars equals 3 days in suggested timeframe of 4 hours. It's used to calculate lowest session VPoC from previous three days. It's also used as a top VPOC for sells.
(VP) Ignore VPOC bottom advice on long {False}: If turned on it ignores bottom VPOC (or top VPOC on sells) when evaluating if a buy entry is worth it.
(VP) Number of bars for VPVR VPOC {100}: Number of bars to calculate the VPVR VPoC. We use 100 as Jaime once used. When the price bounces back to the EMA55 it might just bounce to this VPVR VPoC if its price it's lower than the EMA55 (Sells have inverse algorithm).
____ SETTINGS - ADX Slope
ADX Slope
help us to understand if ADX
has a positive slope, negative slope
or it is rather still.
(ADXSLOPE) ADX cut {23}: If ADX value is greater than this cut (23) then ADX has strength
(ADXSLOPE) ADX minimum steepness entry {45}: ADX slope needs to be 45 degrees to be considered as a positive one.
(ADXSLOPE) ADX minimum steepness exit {45}: ADX slope needs to be -45 degrees to be considered as a negative one.
(ADXSLOPE) ADX steepness periods {3}: In order to avoid false detection the slope is calculated along 3 periods.
____ SETTINGS - Next to EMA55
(NEXTEMA55) EMA10 to EMA55 bounce back percentage {80}: EMA10 might bounce back to EMA55 or maybe to 80% of its complete way to EMA55
(NEXTEMA55) Next to EMA55 percentage {15}: How much next to the EMA55 you need to be to consider it's going to bounce back upwards again.
____ SETTINGS - Stop Loss and Take Profit
You can set a default stop loss or a default take profit.
(STOPTAKE) Stop Loss % {7.0}
(STOPTAKE) Take Profit % {2.0}
____ SETTINGS - Trailing Take Profit
You can customize the default trailing take profit values
(TRAILING) Trailing Take Profit (%) {1.0}: Trailing take profit offset in percentage
(TRAILING) Trailing Take Profit Trigger (%) {2.0}: When 2.0% of benefit is reached then activate the trailing take profit.
____ SETTINGS - MAIN TURN ON/OFF OPTIONS
(EMAS) Ignore advice based on emas {false}.
(EMAS) Ignore advice based on emas (On closing long signal) {False}: Ignore advice based on emas but only when deciding to close a buy entry.
(SQZMOM) Ignore advice based on SQZMOM {false}: Ignores advice based on SQZMOM indicator.
(ADXSLOPE) Ignore advice based on ADX positive slope {false}
(ADXSLOPE) Ignore advice based on ADX cut (23) {true}
(STOPTAKE) Take Profit? {false}: Enables simple Take Profit.
(STOPTAKE) Stop Loss? {True}: Enables simple Stop Loss.
(TRAILING) Enable Trailing Take Profit (%) {True}: Enables Trailing Take Profit.
____ SETTINGS - Strategy mode
(STRAT) Type Strategy: 'Long and Short', 'Long Only' or 'Short Only'. Default: 'Long and Short'.
____ SETTINGS - Risk Management
(RISKM) Risk Management Type: 'Safe', 'Somewhat safe compound' or 'Unsafe compound'. ' Safe ': Calculations are always done with the initial capital (1000) in mind. The maximum losses per trade/day/week/month are taken into account. ' Somewhat safe compound ': Calculations are done with initial capital (1000) or a higher capital if it increases. The maximum losses per trade/day/week/month are taken into account. ' Unsafe compound ': In each order all the current capital is gambled and only the default stop loss per order is taken into account. That means that the maximum losses per trade/day/week/month are not taken into account. Default : 'Somewhat safe compound'.
(RISKM) Maximum loss per trade % {1.0}.
(RISKM) Maximum loss per day % {6.0}.
(RISKM) Maximum loss per week % {8.0}.
(RISKM) Maximum loss per month % {10.0}.
____ SETTINGS - Decimals
(DECIMAL) Maximum number of decimal for contracts {3}: How small (3 decimals means 0.001) an entry position might be in your exchange.
EXTRA 1 - PRICE IS IN RANGE indicator
(PRANGE) Print price is in range {False}: Enable a bottom label that indicates if the price is in range or not.
(PRANGE) Price range periods {5}: How many previous periods are used to calculate the medians
(PRANGE) Price range maximum desviation (%) {0.6} ( > 0 ): Maximum positive desviation for range detection
(PRANGE) Price range minimum desviation (%) {0.6} ( > 0 ): Mininum negative desviation for range detection
EXTRA 2 - SQUEEZE MOMENTUM Desviation indicator
(SQZDIVER) Show degrees {False}: Show degrees of each Squeeze Momentum Divergence lines to the x-axis.
(SQZDIVER) Show desviation labels {False}: Whether to show or not desviation labels for the Squeeze Momentum Divergences.
(SQZDIVER) Show desviation lines {False}: Whether to show or not desviation lines for the Squeeze Momentum Divergences.
EXTRA 3 - VOLUME PROFILE indicator
WARNING: This indicator works not on current bar but on previous bar. So in the worst case it might be VP from 4 hours ago. Don't worry, inside the strategy calculus the correct values are used. It's just that I cannot show the most recent one in the chart.
(VP) Print recent profile {False}: Show Volume Profile indicator
(VP) Avoid label price overlaps {False}: Avoid label prices to overlap on the chart.
EXTRA 4 - ZIGNALY SUPPORT
(ZIG) Zignaly Alert Type {Email}: 'Email', 'Webhook'. ' Email ': Prepare alert_message variable content to be compatible with zignaly expected email content format. ' Webhook ': Prepare alert_message variable content to be compatible with zignaly expected json content format.
EXTRA 5 - DEBUG
(DEBUG) Enable debug on order comments {False}: If set to true it prepares the order message to match the alert_message variable. It makes easier to debug what would have been sent by email or webhook on each of the times an order is triggered.
HOW TO USE THIS STRATEGY
BOT MODE: This is the default setting.
PROPER VOLUME PROFILE VIEWING: Click on this strategy settings. Properties tab. Make sure Recalculate 'each time the order was run' is turned off.
NEWBIE USER: (Check PROPER VOLUME PROFILE VIEWING above!) You might want to turn on the 'Print recent profile {False}' setting. Alternatively you can use my alternate realtime study: 'Resistances and supports based on simplified Volume Profile' but, be aware, it might consume one indicator.
ADVANCED USER 1: Turn on the 'Print price is in range {False}' setting and help us to debug this subindicator. Also help us to figure out how to include this value in the strategy.
ADVANCED USER 2: Turn on the all the (SQZDIVER) settings and help us to figure out how to include this value in the strategy.
ADVANCED USER 3: (Check PROPER VOLUME PROFILE VIEWING above!) Turn on the 'Print recent profile {False}' setting and report any problem with it.
JAIME MERINO: Just use the indicator as it comes by default. It should only show BUY signals, SELL signals and their associated closing signals. From time to time you might want to check 'ADVANCED USER 2' instructions to check that there's actually a divergence. Check also 'ADVANCED USER 1' instructions for your amusement.
EXTRA ADVICE
It's advised that you use this strategy in addition to these two other indicators:
* Squeeze Momentum Indicator
* ADX
so that your chart matches as close as possible to TradingLatino chart.
ZIGNALY INTEGRATION
This strategy supports Zignaly email integration by default. It also supports Zignaly Webhook integration.
ZIGNALY INTEGRATION - Email integration example
What you would write in your alert message:
||{{strategy.order.alert_message}}||key=MYSECRETKEY||
ZIGNALY INTEGRATION - Webhook integration example
What you would write in your alert message:
{ {{strategy.order.alert_message}} , "key" : "MYSECRETKEY" }
CREDITS
I have reused and adapted some code from
'Directional Movement Index + ADX & Keylevel Support' study
which it's from TradingView console user.
I have reused and adapted some code from
'3ema' study
which it's from TradingView hunganhnguyen1193 user.
I have reused and adapted some code from
'Squeeze Momentum Indicator ' study
which it's from TradingView LazyBear user.
I have reused and adapted some code from
'Strategy Tester EMA-SMA-RSI-MACD' study
which it's from TradingView fikira user.
I have reused and adapted some code from
'Support Resistance MTF' study
which it's from TradingView LonesomeTheBlue user.
I have reused and adapted some code from
'TF Segmented Linear Regression' study
which it's from TradingView alexgrover user.
I have reused and adapted some code from
"Poor man's volume profile" study
which it's from TradingView IldarAkhmetgaleev user.
FEEDBACK
Please check the strategy source code for more detailed information
where, among others, I explain all of the substrats
and if they are implemented or not.
Q1. Did I understand wrong any of the Jaime substrats (which I have implemented)?
Q2. The strategy yields quite profit when we should long (EMA10 from 1d timeframe is higher than EMA55 from 1d timeframe.
Why the strategy yields much less profit when we should short (EMA10 from 1d timeframe is lower than EMA55 from 1d timeframe)?
Any idea if you need to do something else rather than just reverse what Jaime does when longing?
FREQUENTLY ASKED QUESTIONS
FAQ1. Why are you giving this strategy for free?
TradingLatino and his fellow enthusiasts taught me this strategy. Now I'm giving back to them.
FAQ2. Seriously! Why are you giving this strategy for free?
I'm confident his strategy might be improved a lot. By keeping it to myself I would avoid other people contributions to improve it.
Now that everyone can contribute this is a win-win.
FAQ3. How can I connect this strategy to my Exchange account?
It seems that you can attach alerts to strategies.
You might want to combine it with a paying account which enable Webhook URLs to work.
I don't know how all of this works right now so I cannot give you advice on it.
You will have to do your own research on this subject. But, be careful. Automating trades, if not done properly,
might end on you automating losses.
FAQ4. I have just found that this strategy by default gives more than 3.97% of 'maximum series of losses'. That's unacceptable according to my risk management policy.
You might want to reduce default stop loss setting from 7% to something like 5% till you are ok with the 'maximum series of losses'.
FAQ5. Where can I learn more about your work on this strategy?
Check the source code. You might find unused strategies. Either because there's not a substantial increases on earnings. Or maybe because they have not been implemented yet.
FAQ6. How much leverage is applied in this strategy?
No leverage.
FAQ7. Any difference with original Jaime Merino strategy?
Most of the times Jaime defines an stop loss at the price entry. That's not the case here. The default stop loss is 7% (but, don't be confused it only means losing 1% of your investment thanks to risk management). There's also a trailing take profit that triggers at 2% profit with a 1% trailing.
FAQ8. Why this strategy return is so small?
The strategy should be improved a lot. And, well, backtesting in this platform is not guaranteed to return theoric results comparable to real-life returns. That's why I'm personally forward testing this strategy to verify it.
MENSAJE EN CASTELLANO
En primer lugar se agradece feedback para mejorar la estrategia.
Si eres un usuario avanzado y quieres colaborar en mejorar el script no dudes en comentar abajo.
Ten en cuenta que aunque toda esta descripción tenga que estar en inglés no es obligatorio que el comentario esté en inglés.
CHISTE - CASTELLANO
¡Pero Jaime!
¡400.000!
¡Tu da mun!

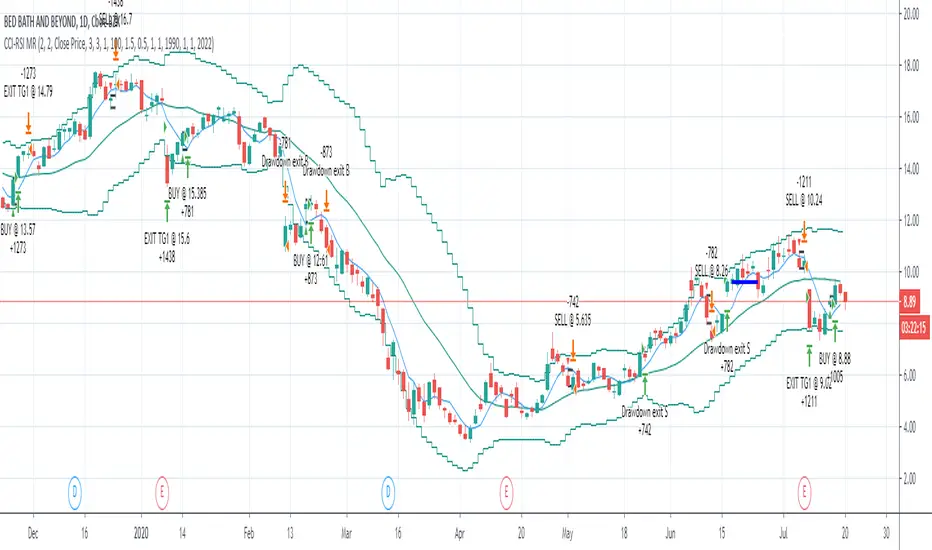
CCI-RSI MR Indicators:
Bollinger Bands (20 period, 2σ)
RSI (14 period) and Simple moving average of RSI (5 period)
CCI (20 period)
SMA (5 period)
Entry Conditions:
Buy when:
Swing low (5) should be lower than the highest of lower BB (3 periods)
Both RSI crossover RSI_5 and CCI crossover -100 should have happened within last 3 candles (including the current candle)
Once all the above conditions are met, the close should be higher than SMA (5) within the next 3 candles
After condition 3 is satisfied, we enter the trade at next candle’s open
Stop loss will be at 1 tick lower than previous swing low
Sell when:
Swing high (5) should be higher than the lowest of upper BB (3 periods)
Both RSI crossunder RSI_5 and CCI crossunder 100 should have happened within last 3 candles (including the current candle)
Once all the above conditions are met, the close should be lower than SMA (5) within the next 3 candles
After condition 3 is satisfied, we enter the trade at next candle’s open
Stop loss will be at 1 tick higher than previous swing high
Exit Conditions:
Since it’s mean reversion strategy we’ll be having only 2 target exits with a trailing stop loss after target price 1 is achieved.
Target exit price 1 & 2 are decided based on the risk ‘R’ for each trade
Depending on the instrument and time frame a trailing stop loss of 0.5R or 1R has opted.
A stop limit is placed @Entry_price +- 2*ATR(20) to offset the risk of losing significantly more than 1xR in a trade
Two Take Profits and Two Stop LossThis script is for research purposes only. I am not a financial advisor.
Entry Condition
This strategy is based on two take profit targets, two stop loss, and scaling out strategy. The entry rule is very simple. Whenever the EMA crossover WMA, the long trade is taken and vice versa.
Take Profit and Stop Loss
The first take profit is set at 20 pips above the long entry and the second take profit is set at 40 pips above the long entry. Meanwhile, the first stop loss is set at 20 pips below the long entry and the second stop loss is set at the long entry.
Money Management
When the first take profit is achieved, half of the position is closed and the first stop loss is moved to the entry-level. The rest of the position is open to achieve either second take profit or second stop loss.
There are three outcomes when using this strategy. Let's say you enter the trade with 200 lot size and you are risking 2% of your equity.
1. The first outcome is when the price hits stop loss, you lose the entire 2%.
2. The second outcome is when the price hits the first take profit and you close half of your position. Meaning that you have gained 1%. Then you let the trade running and eventually it hits the second stop loss. Remember your first stop loss has changed to the second stop loss when the first take profit is achieved. The total loss is 0% because the price is at your entry-level. You have gained the earlier 1% and then lost 0%. At this point, you are at 1% gained.
3. The third outcome is similar to the second out but instead of hitting the second stop loss, the trade is running to your favor and hits the second take profit.
Therefore, you gained 1% from the first take profit and you gained another 2% for the second take profit. Your total gained is 3%
Summary
The reason behind this strategy is to minimize risk. with normal strategy, you only have two outcomes which are either win or loss. With this strategy, you have three outcomes which win 3%, win 1%, or loss 2%.
This is my similar strategy but with single stop loss

TSM RSI + Supertrend (ATR SL + Partial Booking) 302026RSI + Supertrend Strategy (ATR Stop-Loss + Partial Profit Booking)
Strategy Objective
This strategy is designed to:
Trade only in strong trends
Avoid false entries using RSI confirmation
Protect capital with a volatility-based (ATR) stop-loss
Book profits in stages to reduce risk and ride big moves
🔧 Indicators Used
1️⃣ Supertrend
Role: Trend direction
Green line → Uptrend
Red line → Downtrend
Settings:
ATR Period: 10
Multiplier: 3
2️⃣ RSI (Relative Strength Index)
Role: Momentum confirmation
RSI above 50 → Bullish strength
RSI below 50 → Bearish strength
Settings:
RSI Length: 14
Level: 50
🟢 BUY (Long Trade) Rules
A BUY trade is taken when all conditions are met:
Supertrend changes from Red to Green
→ Trend turns bullish
RSI is above 50
→ Buying momentum is strong
📌 Entry:
➡️ Enter BUY at the next candle.
🔴 SELL (Short Trade) Rules
A SELL trade is taken when all conditions are met:
Supertrend changes from Green to Red
→ Trend turns bearish
RSI is below 50
→ Selling momentum is strong
📌 Entry:
➡️ Enter SELL at the next candle.
🛑 Stop-Loss (ATR-Based)
Stop-loss is calculated using ATR (Average True Range)
Adapts automatically to market volatility
BUY Trade
SL = Entry Price − (ATR × Multiplier)
SELL Trade
SL = Entry Price + (ATR × Multiplier)
✅ This avoids tight SL in volatile markets and wide SL in calm markets.
🎯 Partial Profit Booking Logic
🔹 First Target (Partial Exit)
50% of the position is booked at 1:1 Risk–Reward
This locks in profits early and reduces risk
🔹 Remaining 50%
Held as long as the Supertrend does not reverse
Exits only when the trend flips
Helps capture big trending moves
🔄 Exit Rules Summary
Situation Action
ATR Stop-Loss hit Full exit
1:1 target reached 50% profit booked
Supertrend flips Remaining 50% exited
⏱️ Best Timeframes
Trading Style Timeframe
Intraday 5 min / 15 min
Swing 1 Hour / Daily
Best markets:
Trending stocks
Index futures
Directional options (CE / PE)
⭐ Why This Strategy Is Powerful
✔ Trades with trend, not against it
✔ RSI filters weak signals
✔ ATR-based SL adjusts to volatility
✔ Partial booking reduces psychological pressure
✔ Lets winners run and cuts losers early
⚠️ Important Notes
Avoid sideways markets
Always backtest before live trading
Risk management is more important than entries.

Asian Liquidity Sweep + NY Reversal [NY Only]Asian Liquidity Sweep + NY Reversal
Concept
Asia builds a tight range → liquidity pool
London / early NY raids that liquidity (stop hunt)
New York delivers the real move in the opposite direction
Sessions utc+3
Asia range: 04:00 – 10:00
Liquidity sweep: London open → pre-NY (≈10:00–14:00)
Execution window: NY Kill Zone 15:00 – 18:00
Step-by-Step Model
Define Asia Range
Mark:
Asia High
Asia Low
Liquidity Sweep (Stop Hunt)
Price must do ONE of the following:
Sweep above Asia High → bullish liquidity taken
Sweep below Asia Low → bearish liquidity taken
NY Reversal Confirmation (Key Part)
Wait for NY Kill Zone and look for:
Strong rejection candle
Displacement / impulsive move back inside range
Optional: small internal structure break on lower TF
Entry Rules (High Probability)
🔻 If Asia High is swept:
Bias: SELL
Entry:
After NY rejection
On pullback to:
Discount zone / FVG
OR Asia High retest
SL: Above sweep high
TP:
Asia Low (TP1)
NY session low / next HTF liquidity (TP2)
If Asia Low is swept:
Bias: BUY
Entry:
NY rejection + displacement
Pullback to imbalance / Asia Low
SL: Below sweep low
TP:
Asia High
Daily high / premium liquidity
arrows/labels-will show when to buy or sell
signal-once per day
Use volume profile (max) for confirmation of entry point
Lets win together

ATR Stop LinesATR Stop Lines
Plots dynamic stop-loss levels on the price chart based on ATR (Average True Range). Optionally adjusts stop distance based on volatility regime.
━━━━━━━━━━━━━━━━━━━━━━━━━━━━━━
🎯 WHAT IT DOES
Green line — Long stop (Close − ATR × multiplier)
Red line — Short stop (Close + ATR × multiplier)
Lines move with price and volatility. When regime-adjust is enabled, stop distance widens in high volatility and tightens in low volatility.
━━━━━━━━━━━━━━━━━━━━━━━━━━━━━━
📐 REGIME-ADJUSTED MULTIPLIERS
When enabled, the multiplier auto-adjusts based on the ATR percentile:
LOW (< 25th pctl) — 1.0× ATR — Tight stops, small moves expected
NORMAL (25–50th pctl) — 1.5× ATR — Standard distance
HIGH (50–75th pctl) — 2.0× ATR — Wider to avoid noise
EXTREME (> 75th pctl) — 2.5× ATR — Widest, or skip the trade
Disable regime-adjust to use a fixed multiplier for all conditions.
━━━━━━━━━━━━━━━━━━━━━━━━━━━━━━
📈 HOW TO USE
Entry: Note stop line level when entering a trade. Set stop-loss at or beyond that level.
Trailing: Move stop to new line level as price advances in your favor.
Sizing: Wider stop = smaller position to maintain constant risk.
Example:
BTC Daily, ATR = \$2,000, Regime = HIGH (2.0×)
Entry: \$50,000 → Long stop: \$46,000 / Short stop: \$54,000
━━━━━━━━━━━━━━━━━━━━━━━━━━━━━━
📊 STATUS LABEL
VOL — Current regime (LOW / NORMAL / HIGH / EXTREME)
ATR — Raw ATR value in price units
Mult — Active multiplier
Stop Dist — Current stop distance in price units
━━━━━━━━━━━━━━━━━━━━━━━━━━━━━━
⚙️ SETTINGS
ATR Settings:
ATR Length (default: 14)
Percentile Lookback (default: 100)
Timeframe:
Use Fixed Timeframe — Lock to specific TF
Fixed Timeframe (default: D)
Stop Settings:
Regime-Adjusted Multiplier — Toggle auto-adjust on/off
Base ATR Multiplier — Used when regime-adjust is off
LOW/NORMAL/HIGH/EXTREME Multipliers — Customize per regime
Display:
Show Long Stop / Show Short Stop
Show Status Label
Long/Short Stop Colors
━━━━━━━━━━━━━━━━━━━━━━━━━━━━━━
🔔 ALERTS
Vol → EXTREME
Vol → LOW
━━━━━━━━━━━━━━━━━━━━━━━━━━━━━━
💡 COMPANION INDICATOR
Use with ATR Volatility Regime (separate pane) for full context:
Pane indicator → percentile visualization, zone backgrounds
This indicator → actionable stop levels on price chart
Both use identical ATR/percentile logic and stay in sync.
━━━━━━━━━━━━━━━━━━━━━━━━━━━━━━
📝 NOTES
Works on any timeframe
Stops are dynamic — recalculate each bar
Not a signal generator — use with your own entry logic
━━━━━━━━━━━━━━━━━━━━━━━━━━━━━━
🏷️ TAGS
ATR, stop-loss, volatility, risk-management, position-sizing, trailing-stop, swing-trading

Scalp Precision Matrix [BullByte]SCALP PRECISION MATRIX (SPM)
OVERVIEW
Scalp Precision Matrix (SPM) is a comprehensive decision-support framework designed specifically for scalpers and short-term traders. This indicator synthesizes five distinct analytical layers into a unified system that helps identify high-quality setups while avoiding common pitfalls that trap traders.
━━━━━━━━━━━━━━━━━━━━━━━━━━━━━━━━━━━━━━━━━━━
THE CORE PROBLEM THIS INDICATOR ADDRESSES
Scalping demands rapid decision-making while simultaneously processing multiple data points. Traders constantly ask themselves: Is momentum still alive? Am I entering near a potential reversal zone? Is this the right session to trade? What is my actual risk-to-reward? Most traders either overwhelm themselves with too many separate indicators (creating analysis paralysis) or use too few (missing crucial context).
SPM was developed to consolidate these essential checks into one cohesive framework. Rather than overlaying disconnected indicators, each component in SPM directly informs and adjusts the others, creating an integrated analytical system.
━━━━━━━━━━━━━━━━━━━━━━━━━━━━━━━━━━━━━━━━━━━
WHY THESE SPECIFIC COMPONENTS AND HOW THEY WORK TOGETHER
The five analytical layers in SPM are not arbitrarily combined. Each addresses a specific question in the scalping decision process, and together they form a logical workflow:
LAYER 1: MOMENTUM FUEL GAUGE
This answers the question: "Does the current move still have energy?"
After any impulse move (a significant directional price movement), momentum naturally decays over time. The Fuel Gauge estimates remaining momentum by analyzing four factors:
Body Strength (30% weight): Compares recent candle body sizes against the historical average. Strong momentum produces candles with large bodies relative to their wicks. The calculation takes the 3-bar average body size divided by the 20-bar average body size, then scales it to a 0-100 range.
Wick Rejection (25% weight): Measures the wick-to-body ratio. When wicks are large relative to bodies, it suggests rejection and weakening momentum. A ratio of 2.0 or higher (wicks twice the body size) scores low; smaller ratios score higher.
Volume Consistency (20% weight): Compares recent 3-bar average volume against the lookback period average. Sustained moves require consistent volume support. Volume dropping off suggests the move may be losing participation.
Time Decay (25% weight): Tracks how many bars have passed since the last detected impulse. Momentum naturally fades over time. The typical impulse duration is adjusted based on the current volatility regime.
These components are weighted and combined, then smoothed with a 3-period EMA to reduce noise. The result is a 0-100% gauge where:
- Above 70% = Strong momentum (green)
- 40-70% = Moderate momentum (amber)
- Below 40% = Weak momentum (red)
- Below 20% = Exhausted (triggers EXIT warning)
The Fuel Gauge also estimates how many bars of momentum remain based on the current burn rate.
IMPORTANT DISCLAIMER : The Fuel Gauge is NOT order flow, volume profile, or depth of market data. It is a technical proxy calculated entirely from standard OHLCV (Open, High, Low, Close, Volume) data. The term "Fuel" is used metaphorically to represent estimated remaining momentum energy.
LAYER 2: TRAP ZONE DETECTION
This answers the question: "Am I walking into a potential reversal area?"
Price tends to reverse at levels where it has reversed before. SPM identifies these zones by detecting clusters of historical swing points:
How it works:
1. The indicator detects swing highs and swing lows using the Swing Detection Length setting (default 5 bars on each side required to confirm a pivot).
2. Recent swing points are stored (up to 10 of each type).
3. For each potential zone, the algorithm counts how many swing points cluster within a tolerance of 0.5 ATR.
4. Zones with 2 or more clustered swing points, positioned between 0.3 and 4.0 ATR from current price, are marked as Trap Zones.
5. A Confluence Score is calculated based on cluster density and proximity to current price.
The percentage displayed (e.g., "TRAP 85%") is a CONFLUENCE SCORE, not a probability. Higher percentages mean more swing points cluster at that level and price is closer to it. This indicates stronger historical significance, not a prediction of future reversal.
CRITICAL DISCLAIMER : Trap Zones are NOT institutional order flow, liquidity pools, smart money footprints, or any proprietary data feed. They are calculated purely from historical swing point clustering using standard technical analysis. The term "trap" describes how price action has historically reversed at these levels, potentially trapping traders who enter prematurely. This is pattern recognition, not market structure data.
LAYER 3: VELOCITY ANALYSIS
This answers the question: "Is price moving favorably right now?"
Velocity measures how fast price is currently moving compared to its recent average:
Calculation:
- Current velocity = Absolute price change from previous bar divided by ATR
- Average velocity = Simple moving average of velocity over the lookback period
- Velocity ratio = Current velocity divided by average velocity
Classification:
- FAST (ratio above 1.5 ): Price is moving significantly faster than normal. Good for momentum continuation plays.
- NORMAL (ratio 0.5 to 1.5) : Typical price movement speed.
- SLOW (ratio below 0.5 ): Price is moving sluggishly. Often indicates ranging or choppy conditions where scalping becomes difficult.
The velocity score contributes 18% to the overall quality score calculation.
LAYER 4: SESSION AWARENESS
This answers the question: "Is this a good time to trade?"
Different trading sessions have different characteristics. SPM automatically detects which major session is active and adjusts its quality assessment:
Session Times (all in UTC):
- A sia Session : 00:00 - 08:00 UTC
- London Session : 08:00 - 16:00 UTC
- New York Session : 13:00 - 21:00 UTC
- London/NY Overlap : 13:00 - 16:00 UTC
- Off-Peak : Outside major sessions
Session Quality Weighting:
- Overlap : 100 points (highest liquidity, best movement)
- London : 85 points
- New York : 80 points
- Asia : 50 points (tends to range more)
- Off-Peak : 30 points (lower liquidity, more false signals)
The session score contributes 17% to the overall quality calculation. Signals are also filtered to prevent firing during off-peak hours.
Note : These are fixed UTC times and may not perfectly match your broker's session boundaries. Use them as general guidance rather than precise timing.
LAYER 5: VOLATILITY REGIME ADAPTATION
This answers the question: "How should I adjust for current market conditions?"
SPM compares current volatility (14-period ATR) against historical volatility (50-period ATR) to categorize the market:
HIGH Volatility (ratio above 1.3): Current ATR is 30%+ above normal. SPM widens thresholds to filter noise and extends target projections.
NORMAL Volatility (ratio 0.7 to 1.3): Typical conditions. Standard parameters apply.
LOW Volatility (ratio below 0.7): Current ATR is 30%+ below normal. SPM tightens thresholds for sensitivity and reduces target expectations. The market state may show AVOID during prolonged low volatility.
This adaptation prevents false signals during erratic markets and missed signals during quiet markets.
━━━━━━━━━━━━━━━━━━━━━━━━━━━━━━━━━━━━━━━━━━━
THE SYNERGY: WHY THIS COMBINATION MATTERS
These five layers are not independent indicators placed on one chart. They form an interconnected system:
- A signal only fires when momentum exists (Fuel above 40%), price is away from danger zones (Trap Zones factored into quality score), movement is favorable (Velocity contributes to score), timing is appropriate (Session is not off-peak), and volatility is accounted for (thresholds adapt to regime).
- The Trap Zones directly influence Entry Zone placement. Entry zones are positioned beyond trap zones to avoid getting caught in reversals.
- Target projections automatically adjust to avoid placing take-profit levels inside detected trap zones.
- The Fuel Gauge affects which signal tier fires. Insufficient fuel prevents all signals.
- Session quality is weighted into the overall score, reducing signal quality during less favorable trading hours.
This integration is the core originality of SPM. Each component makes the others more useful than they would be in isolation.
━━━━━━━━━━━━━━━━━━━━━━━━━━━━━━━━━━━━━━━━━━━
HOW THE QUALITY SCORE IS CALCULATED
The Quality Score (0-100) synthesizes all layers into a single number for each direction (long and short):
For Long Quality Score:
- Fuel Component (28% weight) : Full fuel value if impulse direction is bullish; 60% of fuel value otherwise
- Trap Avoidance (22% weight) : 75 points if no trap zone below; otherwise 100 minus the trap confluence score (minimum 20)
- Velocity Component (18% weight) : Direct velocity score
- Session Component (17% weight) : Current session quality score
- Trend Alignment (15% bonus) : Adds 12 points if price is above the 20-period SMA
For Short Quality Score:
- Same structure but reversed (bearish impulse direction, trap zone above, price below SMA)
The direction with the higher score becomes the current Bias. A 12-point difference is required to switch bias, preventing flip-flopping in neutral conditions.
━━━━━━━━━━━━━━━━━━━━━━━━━━━━━━━━━━━━━━━━━━━
SIGNAL TYPES AND WHAT THEY MEAN
SPM generates four types of signals, each with specific visual representation:
PRIME SIGNALS (Cyan Diamond)
These represent the highest quality confluence. Requirements:
- Quality score crosses above the Prime threshold (default 80)
- Bias aligns with signal direction
- Fuel is sufficient (above 40%)
- Session is active (not off-peak)
- Cooldown period has passed
Prime signals appear as cyan-colored diamond shapes. Long signals appear below the bar; short signals appear above.
STANDARD SIGNALS (Green Triangle Up / Red Triangle Down)
These represent good quality setups. Requirements:
- Quality score crosses above the Standard threshold (default 75) but below Prime
- Same bias, fuel, and cooldown requirements as Prime
Standard signals appear as small triangles in green (long) or red (short).
CAUTION SIGNALS (Small Faded Circle)
These represent minimum threshold setups. Requirements:
- Quality score crosses above the Caution threshold (default 65) but below Standard
- Same additional requirements
Caution signals appear as small, faded circles. These suggest the setup exists but with weaker confluence. Consider these only when broader market context supports them, or skip them entirely during uncertain conditions.
EXHAUSTION SIGNAL (Purple X with "EXIT" text)
This warning appears when the Fuel Gauge drops below 20% from above, indicating momentum has depleted. This is not a trade signal but a warning to:
- Consider exiting existing positions
- Avoid entering new trades in the current direction
- Wait for new momentum to develop
All signals use CONFIRMED bar data only (referencing the previous closed bar) to prevent repainting. Once a signal appears, it will never disappear or change position on historical bars.
━━━━━━━━━━━━━━━━━━━━━━━━━━━━━━━━━━━━━━━━━━━
READING THE CHART ELEMENTS
TRAP ZONES (Red Dashed Box with "TRAP XX%" Label)
These mark price levels where multiple historical swing points cluster. The red dashed box shows the zone boundaries. The percentage is the confluence score indicating cluster strength and proximity.
How to use: When price approaches a trap zone, be cautious about entering in that direction. If your bias is LONG and there's a strong trap zone above, consider taking partial profits before price reaches it or adjusting your target below it.
ENTRY ZONES (Green Solid Box with "ENTRY" Label)
These show suggested entry areas based on the current bias direction. For LONG bias, the entry zone appears below the trap zone (buying the dip beyond support). For SHORT bias, it appears above the trap zone (selling the rally beyond resistance).
How to use: Rather than entering at current price, consider placing limit orders within the entry zone. This positions you beyond where typical trap reversals occur.
TARGET ZONES (Blue Dotted Box with "TARGET" Label)
These project potential take-profit areas based on ATR multiples, adjusted for:
- Current volatility regime (wider in high volatility, tighter in low)
- Impulse direction (larger targets when aligned with impulse)
- Nearby trap zones (targets adjust to avoid placing TP inside trap zones)
How to use: These are suggestions, not guarantees. Consider taking partial profits before the target or using trailing stops once price moves favorably.
STOP LEVEL (Orange Dashed Line with "STOP" Label)
This shows suggested stop-loss placement, calculated as 0.8 ATR beyond the trap zone (or 2.0 ATR from current price if no trap zone exists).
How to use: This provides a reference for risk calculation. The dashboard R:R ratio is calculated using this stop level.
Chart Example: Scalp Precision Matrix displays real-time market analysis through dynamic zones and quality scores. ENTRY/TARGET/STOP zones show potential price levels based on current market structure - they appear continuously as reference points, NOT as trade instructions. Actual trade signals (diamonds, triangles, circles) fire only when multiple conditions align: quality score thresholds are crossed, fuel gauge is sufficient, session is active, and cooldown period has passed. The zones help you understand market context; the signals tell you when to act.
━━━━━━━━━━━━━━━━━━━━━━━━━━━━━━━━━━━━━━━━━━━
UNDERSTANDING THE DASHBOARD (Top Right Panel)
The main dashboard provides comprehensive market context:
Row 1 - Header:
- "SPM " : Indicator name
- Market State : Current overall condition
Market States Explained:
- PRIME : Excellent conditions. Quality score meets prime threshold, session is active. Best opportunities.
- READY : Good conditions. Quality score meets standard threshold. Solid setups available.
- WAIT : Mixed conditions. Some factors favorable, others not. Patience recommended.
- AVOID : Poor conditions. Off-peak session or very low volatility. High risk of false signals.
- EXIT : Fuel exhausted. Momentum depleted. Consider closing positions or waiting.
Row 2-3 - Quality Bars:
- " UP ########## " : Visual meter for long quality (each # = 10 points, . = empty)
- " DN ########## " : Visual meter for short quality
- The number on the right shows the exact quality score
Row 4 - Bias:
- Shows current directional lean: LONG, SHORT, or NEUTRAL
- Color-coded: Green for long, red for short, gray for neutral
Rows 5-7 (Full Mode Only) - Trade Levels:
- Entry : Suggested entry price for current bias direction
- Stop : Suggested stop-loss price
- Target : Projected take-profit price
Row 8 - Risk:Reward Ratio:
- Format : "1:X.X" where X.X is the reward multiple
- Color-coded : Green if 2:1 or better, amber if 1.5:1 to 2:1, red if below 1.5:1
Row 9 - Fuel:
- Shows percentage and estimated bars remaining in parentheses
- Example : "72% (8)" means 72% fuel with approximately 8 bars remaining
- Color-coded : Green above 70%, amber 40-70%, red below 40%
Row 10-11 (Full Mode Only) - Market Conditions:
- Vol : Current volatility regime (HIGH/NORMAL/LOW)
- Speed : Current velocity zone (FAST/NORMAL/SLOW)
Row 12 - Session:
- Shows active trading session
- Color-coded by session type
Row 13 (Full Mode Only) - Remaining:
- Time remaining in current session (hours and minutes)
Row 14 (Conditional) - Trap Warning:
- Appears when a significant trap zone exists in your bias direction
- Shows direction (ABOVE/BELOW) and confluence percentage
━━━━━━━━━━━━━━━━━━━━━━━━━━━━━━━━━━━━━━━━━━━
UNDERSTANDING THE QUICK PANEL (Bottom Left)
The Quick Panel provides essential information at a glance without looking away from price action:
Row 1: Current Bias and Quality Score (large text for quick reading)
Row 2: Market State
Row 3: Fuel Percentage
Row 4: Estimated Bars Remaining
Row 5: Risk:Reward Ratio
Row 6: Current Session
Both panels can be repositioned using the settings, and each can be toggled on/off independently.
━━━━━━━━━━━━━━━━━━━━━━━━━━━━━━━━━━━━━━━━━━━
SETTINGS EXPLAINED
CORE SETTINGS:
Analysis Lookback (Default: 20)
Number of bars used for statistical calculations including average volume and average body size. Higher values create smoother but slower-reacting analysis. Lower values are more responsive but may include more noise.
Swing Detection Length (Default: 5)
Bars required on each side to confirm a swing high or low. A setting of 5 means a swing high must have 5 lower highs on each side. Lower values detect more swings (more trap zones, more sensitivity). Higher values find only major pivots (fewer but more significant zones).
Impulse Sensitivity (Default: 1.5)
Multiplier for ATR when detecting impulse moves. Lower values (like 1.0) detect smaller price movements as impulses, refreshing the fuel gauge more frequently. Higher values (like 2.5) require larger moves, making impulse detection less frequent but more significant.
SIGNAL SETTINGS:
Prime/Standard/Caution Thresholds (Defaults: 80/75/65)
These control the quality score required for each signal tier. You can adjust these based on your preference:
- More conservative : Raise thresholds (e.g., 85/80/70) for fewer but higher-quality signals
- More aggressive : Lower thresholds (e.g., 75/70/60) for more signals with slightly lower quality
Signal Cooldown (Default: 8 bars)
Minimum bars between signals to prevent signal spam. After any signal fires, no new signals can appear until this many bars pass. Increase for fewer signals in choppy markets; decrease if you want faster signal refresh.
Show Prime/Standard/Caution/Exhaustion Signals
Toggle each signal type on or off based on your preference.
ZONE DISPLAY:
Show Trap Zones / Entry Zones / Target Zones / Stop Levels
Toggle each zone type on or off. Turning off zones you don't use reduces chart clutter.
Zone Transparency (Default: 88)
Controls how transparent zone boxes appear. Higher values (closer to 95) make zones barely visible; lower values (closer to 75) make them more prominent.
Zone History (Default: 25 bars)
How far back zone boxes extend on the chart. Purely visual preference.
BACKGROUND:
Background Mode (Options: Off, Subtle, Normal)
Controls whether and how intensely the chart background is colored. Subtle is barely noticeable; Normal is more visible; Off disables background coloring entirely.
Background Type (Options: Bias, Fuel)
- Bias : Colors background based on current directional lean (green for long, red for short)
- Fuel : Colors background based on momentum level (green for high fuel, amber for moderate, red for low)
DASHBOARD / QUICK PANEL:
Show Dashboard / Show Quick Panel
Toggle each panel on or off.
Compact Mode
When enabled, the main dashboard shows only essential rows (quality bars, bias, R:R, fuel, session) without entry/stop/target levels, volatility, velocity, or time remaining.
Position Settings
Choose where each panel appears on your chart from six options: Top Right, Top Left, Bottom Right, Bottom Left, Middle Right, Middle Left.
ALERTS:
Alert Prime Signals / Standard Signals / Fuel Exhaustion
Enable or disable TradingView alerts for each condition. When enabled, you can set up alerts in TradingView that will notify you when these conditions occur.
━━━━━━━━━━━━━━━━━━━━━━━━━━━━━━━━━━━━━━━━━━━
RECOMMENDED TIMEFRAMES AND USAGE
OPTIMAL TIMEFRAMES:
- 1-minute to 5-minute : Best for active scalping with quick entries and exits
- 5-minute to 15-minute : Balanced scalping with slightly more confirmation
- 15-minute to 1-hour : Short-term swing entries, fewer but more significant signals
Zone visualizations only appear on intraday timeframes to prevent chart clutter on higher timeframes.
BEST PRACTICES:
1. Trade primarily during LONDON, NEW YORK, or OVERLAP sessions. The indicator weights these sessions higher for good reason - liquidity and movement are typically better.
2. Prioritize PRIME signals. These represent the highest confluence and have proven most reliable. Use STANDARD signals as secondary opportunities. Treat CAUTION signals with extra scrutiny.
3. Respect the Fuel Gauge. Avoid entering new positions when fuel is below 40%. When the EXIT signal appears, seriously consider closing or reducing positions.
4. Pay attention to TRAP warnings. When the dashboard shows a trap zone in your bias direction, be cautious about holding through that level.
5. Verify R:R before entry. The dashboard shows the risk-to-reward ratio. Ensure it meets your minimum requirements (many traders require at least 1.5:1 or 2:1).
6. When state shows AVOID or EXIT, step back. These conditions typically produce poor results.
7. Combine with your own analysis. SPM is a decision-support tool, not a standalone system. Use it alongside your understanding of market structure, news events, and overall context.
━━━━━━━━━━━━━━━━━━━━━━━━━━━━━━━━━━━━━━━━━━━
PRACTICAL EXAMPLE
Scenario : You're watching a 5-minute chart during London session. A cyan diamond (Prime Long signal) appears below the bar.
Before entering, you check the dashboard:
- State shows "PRIME" - conditions are favorable
- Fuel shows "72% (8)" - plenty of momentum remaining (approximately 8 bars)
- R:R shows "1:2.3" - acceptable risk-to-reward ratio
- Session shows "LONDON" - active session with good liquidity
- No TRAP warning in dashboard - no immediate resistance cluster in your way
- Entry zone visible on chart at a lower price level
- Stop and Target zones clearly marked
With this confluence of factors, you have context for a more informed decision. The signal indicates quality, the fuel suggests momentum remains, the R:R is favorable, and no immediate trap threatens your trade.
However, you also notice the target zone sits just below where a trap zone would be if there were one. This is by design - SPM adjusts targets to avoid placing them inside reversal zones.
This multi-factor confirmation delivered in a single glance is what SPM provides.
Chart Example :This chart demonstrates how the Scalp Precision Matrix identifies key market transitions. After a strong bullish impulse (cyan PRIME signal at ~08:30), price reached a historical reversal cluster (TRAP ZONE at 92,300). The indicator detected momentum exhaustion (purple EXIT signal) as fuel dropped below 20%, warning traders to exit longs. Now showing a SHORT bias with entry/stop/target zones clearly marked. The 92% trap zone confluence indicates a strong cluster of previous swing highs where price historically reversed.
━━━━━━━━━━━━━━━━━━━━━━━━━━━━━━━━━━━━━━━━━━━
DATA WINDOW VALUES
For detailed analysis and strategy development, SPM exports the following values to TradingView's Data Window (visible when you hover over the chart with the indicator selected):
- Long Quality Score (0-100)
- Short Quality Score (0-100)
- Fuel Gauge (0-100%)
- Risk:Reward Ratio
These values can be useful for understanding how the indicator behaves over time and for developing your own insights about when it works best for your trading style.
━━━━━━━━━━━━━━━━━━━━━━━━━━━━━━━━━━━━━━━━━━━
NON-REPAINTING CONFIRMATION
All signals in SPM are generated using CONFIRMED bar data only. The signal logic references the previous closed bar's values ( and in Pine Script terms). This means:
- Signals appear at the OPEN of the new bar (after the previous bar closes)
- Signals will NEVER disappear once they appear
- Signals will NEVER change position on historical bars
- What you see in backtesting is what you would have seen in real-time
The dashboard and zones update in real-time to provide current market context, but the trading signals themselves are non-repainting.
━━━━━━━━━━━━━━━━━━━━━━━━━━━━━━━━━━━━━━━━━━━
IMPORTANT DISCLAIMERS
TERMINOLOGY CLARIFICATION:
This indicator uses terms that might imply access to data it does not have. To be completely transparent:
- "Trap Zones" are calculated from historical swing point clustering. They are NOT institutional liquidity pools, order blocks, smart money footprints, or any form of order flow data. The term "trap" is metaphorical, describing how price has historically reversed at these levels.
- "Fuel Gauge" is a technical momentum proxy. It is NOT order flow, volume profile, depth of market, or bid/ask data. It estimates momentum remaining based entirely on standard OHLCV price and volume data.
- "Quality Scores" are weighted combinations of the technical factors described above. A high score indicates multiple conditions align favorably according to the indicator's logic. It does NOT predict or guarantee trade success.
- The percentages shown on trap zones are CONFLUENCE SCORES measuring cluster density and proximity. They are NOT probability predictions of reversal.
TRADING RISK WARNING:
Trading involves substantial risk of loss and is not suitable for all investors. This indicator is a technical analysis tool designed to assist with decision-making. It does not constitute financial advice, trading advice, or any other sort of advice. Past performance of any signal or pattern does not guarantee future results. Markets are inherently unpredictable.
Always use proper risk management. Define your risk before entering any trade. Never risk more than you can afford to lose. Consider consulting with a licensed financial advisor before making trading decisions.
━━━━━━━━━━━━━━━━━━━━━━━━━━━━━━━━━━━━━━━━━━━
ORIGINALITY STATEMENT - NOT A MASHUP
Scalp Precision Matrix is an original work that combines several analytical concepts into a purpose-built scalping framework. While individual components like ATR calculations, pivot detection, session timing, and trend alignment exist in various forms elsewhere, the specific implementation here represents original synthesis:
- The Fuel Gauge decay model with its four-component weighted calculation
- The Trap Zone cluster detection with confluence scoring
- The multi-factor quality scoring system that integrates all layers
- The trap-aware entry and target zone placement logic
- The volatility regime adaptation across all components
- The session weighting is integrated into the quality assessment
The indicator does not simply overlay separate indicators on one chart. It creates interconnected layers where each component informs and adjusts the others. This integration is the core originality of SPM.
━━━━━━━━━━━━━━━━━━━━━━━━━━━━━━━━━━━━━━━━━━━
For best results, combine SPM with your own market understanding and always practice proper risk management.
-BullByte

EMA + VWAP Strategy# EMA + VWAP Crossover Strategy
## Overview
This is a trend-following intraday strategy that combines fast and slow EMAs with VWAP to identify high-probability entries. It's designed primarily for 5-15 minute charts and includes a smart filter to avoid trading when VWAP is ranging flat.
## How It Works
### Core Concept
The strategy uses three main components working together:
- **Fast EMA (9)** - Responds quickly to price changes and generates entry signals
- **Slow EMA (21)** - Acts as a trend filter to keep you on the right side of the market
- **VWAP** - Serves as a dynamic support/resistance level and the primary trigger for entries
### Entry Rules
**Long Entry:**
- EMA 9 crosses above VWAP (bullish momentum)
- EMA 9 is above EMA 21 (confirming uptrend)
- VWAP has a clear directional slope (not flat/ranging)
- Only during weekdays (Monday-Friday)
**Short Entry:**
- EMA 9 crosses below VWAP (bearish momentum)
- EMA 9 is below EMA 21 (confirming downtrend)
- VWAP has a clear directional slope (not flat/ranging)
- Only during weekdays (Monday-Friday)
### The VWAP Flat Filter
One of the key features is the VWAP slope filter. When VWAP is moving sideways (flat), it indicates the market is likely consolidating or ranging. The strategy skips these periods because crossover signals tend to be less reliable in choppy conditions. You'll see small gray diamonds at the top of the chart when VWAP is considered flat.
### Risk Management
The strategy uses a proper risk-reward approach with multiple stop loss options:
1. **ATR-Based (Recommended)** - Adapts to market volatility automatically. Default is 1.5x ATR(14), which gives your trades room to breathe while protecting capital.
2. **Swing Low/High** - Places stops at recent price structure points for a more technical approach.
3. **Slow EMA** - Uses the trend-defining EMA as your stop level, good for trend-following with wider stops.
4. **Fixed Percentage** - Simple percentage-based stops if you prefer consistency.
Take profits are automatically calculated based on your risk-reward ratio (default 2:1), meaning if you risk $100, you're aiming to make $200.
### Weekday Trading Filter
The strategy includes an option to trade only Monday through Friday. This is particularly useful for crypto markets where weekend liquidity can be thin and price action more erratic. You can toggle this on/off to test whether avoiding weekends improves your results.
### Visual Features
- **Color-coded background** - Green tint when EMA 9 is above EMA 21 (bullish bias), red tint when below (bearish bias)
- **ATR bands** - Dotted lines showing where stops would be placed (when using ATR stops)
- **Active trade levels** - Solid red line for your stop loss, green line for your take profit when you're in a position
- **Weekend highlighting** - Gray background on Saturdays and Sundays when weekday filter is active
## Best Practices
**Timeframe:** Designed for 5-minute charts but can be adapted to other intraday timeframes.
**Markets:** Works on any liquid market - stocks, forex, crypto, futures. Just make sure there's enough volume.
**Position Sizing:** The strategy uses percentage of equity by default. Adjust based on your risk tolerance.
**Backtesting Tips:**
- Test with and without the weekday filter to see which performs better on your instrument
- Try different ATR multipliers (1.0-2.5) to find the sweet spot between stop-outs and letting profits run
- Experiment with risk-reward ratios (1.5R, 2R, 3R) to optimize for your win rate
**What to Watch:**
- Win rate vs. profit factor balance
- How many trades are filtered out by the VWAP flat condition
- Performance difference between weekdays and weekends
- Whether the trend filter (EMA 21) is keeping you out of bad trades
## Parameters You Can Adjust
- Fast EMA length (default 9)
- Slow EMA length (default 21)
- VWAP flat threshold (default 0.01%)
- Stop loss type and parameters
- Risk-reward ratio
- Weekday trading on/off
- ATR length and multiplier
## Disclaimer
This strategy is for educational purposes. Past performance doesn't guarantee future results. Always test thoroughly on historical data and paper trade before risking real money. Use proper position sizing and never risk more than you can afford to lose.
---
*Built with Pine Script v5 for TradingView*

Supply & Demand Sniper369Indicator Philosophy: The Convergence of Structure and Liquidity
The Supply & Demand Sniper369 is not just another signal generator; it is a professional-grade execution framework built on the principles of Institutional Order Flow and Liquidity Engineering. While standard indicators often lag or provide signals in "no-man's land," this script is designed to identify high-probability reversal points by combining macro-structural zones with micro-execution triggers.
What Makes This Script Original?
Most scripts treat Supply/Demand and Entry Triggers as separate entities. The originality of the Sniper369 lies in its Strict Hierarchical Logic. It employs a "Two-Factor Authentication" system for trades:
1. Structural Validation: Identifying where "Smart Money" has historically left unfilled orders.
2. Liquidity Sweep Confirmation: Using the Enigma 369 logic to detect a specific manipulation pattern (a stop-run or "sweep") that occurs exclusively within those structural zones.
By using Pine Script v6 Object-Oriented Programming, the script manages dynamic arrays of boxes and lines that auto-delete upon mitigation, ensuring your chart remains a clean, actionable workspace.
Underlying Concepts & Calculations
1. Macro: Structural Supply & Demand
The indicator calculates zones based on Pivot Strength and Volatility Scaling.
Calculations: It scans for major structural pivots ( and ). Once a pivot is confirmed, it doesn't just draw a line; it calculates a zone width based on the Average True Range (ATR).
Why it works: Institutions do not enter at a single price; they enter in "pockets" of liquidity. Using ATR-based zones ensures that on high-volatility pairs (like Gold or GBP/JPY), your zones are appropriately wide, while on lower-volatility pairs, they remain tight and precise.
2. Micro: The Enigma 369 Sniper Logic
Once price enters a zone, the "Sniper" logic activates. This is based on the Institutional Wick-Liquidity concept.
The Sweep: The script looks for a candle that breaks the high/low of the previous candle (trapping "breakout" traders) but fails to hold that level.
The Mean Threshold (50% Wick): A core calculation of the Enigma logic is the midpoint of the rejection wick.
Calculation: for Sells.
Logic: Institutions often re-test the 50% level of a long wick to fill the remaining orders before the real move starts.
How to Use the Indicator
Step 1: Wait for Structural Alignment
Observe the Teal (Demand) and Red (Supply) boxes. These are your "Points of Interest" (POI). Do not take any trades until the price is physically touching or inside these boxes.
Step 2: Monitor for the Sniper Trigger
When the price is inside a zone, look for the appearance of the Solid and Dotted lines.
The Solid Line: This is the extreme of the manipulation candle. It serves as your structural invalidation level (Stop Loss).
The Dotted Line: This is the 50% Wick level. It is your "Sniper Entry" target.
Step 3: Execution & Alerts
The script features a built-in alert system that notifies you the moment a Sniper activation occurs inside a zone.
Conservative Entry: Place a Limit Order at the Dotted Line.
Aggressive Entry: Market enter on the close of the Sniper candle if the price has already reacted strongly.
Exit: Target the opposing Supply or Demand zone for a high Risk-to-Reward ratio.
Technical Summary for Traders
Trend Detection: Uses an EMA-50 Filter to ensure Snipers only fire in the direction of the dominant trend (optional).
Scalping/Day Trading: Optimized for the 1m, 5m, and 15m timeframes, but functions perfectly on 4H/Daily for swing traders.
Dynamic Cleanup: The script automatically deletes lines if the price closes past them, signaling that the "Liquidity Grab" was actually a breakout, thus preventing you from entering a losing trade.

MaPla Green Pen - PaTom Graded Zones📘 User Guide: "MaPla Green Pen - PaTom Graded Zones"
This indicator is a complete trading system that combines technical analysis of support/resistance zones (Zones) with specific entry signals (Entry Signals) and integrated risk management (Risk Management).
1. Key Indicator Components
The indicator displays three main components on the chart:
Component,Color,Original Name,Description
Demand/Supply Zone,🟥 Red/🟦 Blue,Sone MaPla,Support/Resistance zones derived from Pivot High/Low. Used as areas of interest or potential reversal points.
Entry Signal,🟢 Green/🔴 Red,MaPla Green Pen,Trade entry signals generated by a specific rejection candlestick pattern (often resembling a Pin Bar).
Risk/Reward Lines,🟢 Lime/🟠 Orange/🔴 Red,PaTom Graded,Take Profit (TP) and Stop Loss (SL) levels automatically calculated based on the user-defined Risk/Reward Ratio.
2. Understanding the Settings (Inputs)Users can adjust these three main parameters to suit their strategy and trading timeframe:Setting NameCode VariableMeaning and AdjustmentZone Strength (Pivot Period)i_strengthDefault: 10Determines the strength of the drawn zones. Higher values make zones rarer but more significant (better for higher timeframes). Lower values create more frequent zones.Take Profit Ratio (Risk/Reward)i_tp_ratioDefault: 1.5The ratio of reward to risk. A value of 1.5 means the TP distance is 1.5 times the SL distance. It is recommended to use values of 1.0 or higher.Zone Transparencyi_zone_transDefault: 88Sets the transparency of the zone's background color. Set to 0 for solid color, or 100 for maximum transparency.
3. How to Use the Signals (Trading Strategy)
The indicator operates automatically. Follow these steps when a signal appears:
3.1 📉 For a SELL Signal
Entry: A Red Label ("SELL Signal") appears above the candlestick, indicating a strong rejection of upward price movement.
Take Profit (TP): The Orange Line (TP) is automatically drawn, based on the set RR Ratio.
Stop Loss (SL): The Red Dashed Line (SL) is automatically drawn, positioned slightly above the high of the rejection candle.
3.2 📈 For a BUY Signal
Entry: A Green Label ("BUY Signal") appears below the candlestick, indicating a strong rejection of downward price movement.
Take Profit (TP): The Lime Green Line (TP) is automatically drawn, based on the set RR Ratio.
Stop Loss (SL): The Red Dashed Line (SL) is automatically drawn, positioned slightly below the low of the rejection candle.
4. Important Notice and Disclaimer
To maintain responsibility to users and comply with TradingView's rules, a clear Disclaimer must be included with the published indicator.
🚨 Important Disclaimer
Not Financial Advice: This indicator is solely a technical analysis tool based on mathematical conditions and candlestick patterns. It does not constitute financial or trading advice. Users must conduct their own analysis and make independent trading decisions.
Repainting: The entry signals in this indicator are Non-Repainting once the bar is closed. However, the Pivot High/Low zones (Demand/Supply Zones) may slightly adjust if a stronger, subsequent candle forms (a normal characteristic of Pivot calculation).
Risk: Trading involves risk. Users should always utilize Stop Loss orders and trade only with capital they can afford to lose.
Alerts: Alerts can be set up on TradingView using the programmed messages: "BUY Signal Confirmed" or "SELL Signal Confirmed."
🇹🇭 ฉบับภาษาไทย: สรุปวิธีการใช้งาน
ผู้ใช้งานควรใช้อินดิเคเตอร์นี้เป็น เครื่องมือยืนยัน สัญญาณเข้าซื้อขาย โดยอาจพิจารณารอสัญญาณ "แม่ปลาปากกาเขียว" (Buy/Sell Label) เมื่อราคาวิ่งเข้าสู่ "โซนแม่ปลา" (Demand/Supply Zone) ที่แข็งแกร่ง เพื่อเพิ่มโอกาสสำเร็จในการเทรด

SMA Strategy [MK]Overview
This strategy is a momentum-based trend-following system designed to capture sustained market moves while minimizing "whipsaws" often found in sideways markets. It utilizes a dual-SMA filter for trend direction, a precise price-crossover trigger for entry, and the Average Directional Index (ADX) to gauge market strength.
How It Works
The strategy follows a strict "Trend + Momentum + Strength" hierarchy:
1. Trend Identification (The Filter) The script uses a Fast SMA (20) and a Slow SMA (50).
Long Bias: SMA-20 > SMA-50.
Short Bias: SMA-20 < SMA-50.
2. Precise Entry (The Trigger) Unlike strategies that enter simply because the price is above a line, this script requires a Price Crossover.
Long Entry: Price must actively cross from below to above the SMA-20.
Short Entry: Price must actively cross from above to below the SMA-20.
3. Trend Strength (The ADX Gatekeeper) To solve the problem of sideways markets where moving averages run parallel, we’ve integrated the ADX (Average Directional Index). The strategy will only trigger a trade if the ADX is above a user-defined threshold (default is 25), ensuring we only enter when the market is trending.
4. RSI Safety Filter To prevent "buying the top" or "selling the bottom," the RSI checks for overextended conditions. It prevents long entries if the RSI is already overbought and short entries if it is oversold.
Exit Logic
The strategy features three layers of protection:
Trend Reversal Exit: Closes the position if the price crosses back over the SMA-20 while the macro trend (SMA-20/SMA-50) has flipped.
Fixed Take Profit: A percentage-based target to lock in gains during sharp moves.
Fixed Stop Loss: A percentage-based safety net to protect capital.
Key Features
Directional Selector: Choose between "Long Only," "Short Only," or "Both."
Visual Feedback: Background colors highlight "Trending" (Green) vs "Sideways" (Red) market regimes.
Fully Customizable: All lengths and thresholds for SMAs, RSI, and ADX can be adjusted to fit different assets and timeframes.
Instructions for Use
Timeframe: This strategy is optimized for trending timeframes such as the 1-Hour (1H), 4-Hour (4H), or Daily (D). Using it on very low timeframes (1-minute or 5-minute) may increase the number of false signals due to market noise.
Asset Classes: Best suited for high-volume assets like Major Forex Pairs, Large-Cap Stocks, and Blue-Chip Cryptocurrencies.
Parameter Tuning: Use the "Strategy Tester" to find the ideal ADX Threshold for your specific asset. Volatile assets usually require a higher ADX (30+) to filter out fake breakouts.
Disclaimer
Financial Risk Warning: The script provided is for educational and informational purposes only. Trading involves significant risk, and there is always the potential for loss. Past performance, whether simulated or real, is not a guarantee of future results.
The author of this script is not a financial advisor. This indicator is not a signal service or a recommendation to buy or sell any security. Always perform your own due diligence and test any strategy thoroughly on a demo account before risking live capital. By using this script, you acknowledge that you are solely responsible for your trading decisions and any resulting financial outcomes.

ORB Breakout Strategy with VWAP and Volume FiltersOverview
This strategy implements the classic Opening Range Breakout (ORB) methodology, a well-documented approach in trading literature that has been used by institutional and retail traders for decades. The strategy identifies the high and low of the first 15 minutes of the trading session, then trades breakouts with defined risk management.
This implementation includes multiple customizable filters (VWAP, Volume, Candle Strength) that traders can enable, disable, and tune to find configurations that work for their specific markets and trading style.
How It Works
Opening Range Calculation
The strategy captures the high and low of the first N bars after the session open (default: 3 bars on a 5-minute chart = 15 minutes). These levels become the breakout triggers for the session.
Entry Logic
Long Entry: When a bar closes above the ORB High and all enabled filters pass
Short Entry: When a bar closes below the ORB Low and all enabled filters pass
Exit Logic
Take Profit: Configurable multiple of the ORB range (default: 1x = full range beyond breakout level)
Stop Loss: Opposite side of the ORB range
Breakeven: Optional stop adjustment to entry price when trade reaches configurable profit threshold
Session Close: All positions automatically closed at end of trading session
Configurable Filters
All filters can be independently enabled or disabled:
1. VWAP Filter
Requires price above/below session-anchored VWAP
Requires VWAP slope confirmation (configurable lookback and minimum slope)
Purpose: Align trades with intraday trend direction
2. Volume Filter
Requires minimum volume on the breakout bar
Purpose: Confirm institutional participation in the breakout
3. Candle Strength Filter
Requires close in upper/lower portion of the bar range
Purpose: Filter out weak breakouts with poor conviction
Strategy Properties
Initial Capital - $50.000USD
Position Size - 1 contract (fixed)
Commission - $4.00 per contract
Slippage - 2 ticks
Margin - 1%
Pyramiding - Disabled
Backtest Results (NQ)
Recent Performance (Jan 2025 - Jan 2026)
Total Trades - 243
Win Rate - 39.09%
Profit Factor - 1.03
Net P&L - $3,581 (+7.16%)
Max Drawdown - $25,447 (39.96%)
Long-Term Performance (2010 - 2026)
Total Trades - 1699
Win Rate - 37.61%
Profit Factor - 0.756
Net P&L - ($49,632) (-99.26%)
Max Drawdown - $50,262 (99.27%)
Important: Long-term results show negative expectancy with default settings. This strategy is published as a research framework, not a ready-to-trade system. Users are encouraged to experiment with different configurations to find their edge.
Settings Guide
Main Settings
ORB Bars: Number of bars for opening range (3 = 15 min on 5-min chart)
Trading Session: Time window for trading (e.g., 0930-1200 for morning only)
Timezone: Your market's timezone
Take Profit: Multiple of ORB range for target
Breakeven Trigger: Distance to move stop to entry
Max Trades Per Day: Daily trade limit
VWAP Filter
Use VWAP Filter: Enable/disable
VWAP Slope Lookback: Bars to measure VWAP direction
Min VWAP Slope: Minimum slope threshold
Volume Filter
Use Volume Filter: Enable/disable
Min Breakout
Volume: Minimum contracts required
Candle Strength Filter
Use Candle Strength Filter: Enable/disable
Min Candle Strength: Required close position (0.7 = top/bottom 30%)
Research Suggestions
This strategy provides a foundation for exploring ORB-based approaches. Consider testing:
Different ORB periods: 5, 10, 15, or 30 minutes
Session variations: Morning only (0930-1200), afternoon, or full day
Direction bias: Long-only or short-only based on daily trend
Filter combinations: Different mixes of VWAP, volume, and candle filters
Take profit ratios: 0.5x, 1x, 1.5x, or 2x ORB range
Market regimes: Performance may vary in trending vs ranging markets
Different instruments: Test on ES, NQ, MNQ, or other futures
Visual Elements
Orange Background: ORB forming period
Green Background: Active trading session
Green Line: ORB High level
Red Line: ORB Low level
VWAP Line: Green = upslope, Red = downslope, Gray = flat
White Line: Trade entry price
Lime Line: Take profit level
Red Line: Stop loss level
Orange Line: Breakeven trigger level
Blue Background: Breakeven activated
Triangles: Entry signals (only appear when trade executes)
Limitations
Negative long-term expectancy: Default settings do not produce profitable results over extended periods
Parameter sensitivity: Results highly dependent on filter settings and market conditions
Market regime dependent: May perform differently in trending vs choppy markets
Commission impact: Frequent trading accumulates significant transaction costs
Curve fitting risk: Optimized settings may not persist in future markets
Disclaimer
This strategy is provided for educational and research purposes only. It does not constitute financial advice.
Past performance does not guarantee future results
Backtested results may not reflect actual trading conditions
The long-term backtest shows significant negative returns
Always paper trade before risking real capital
Never risk more than you can afford to lose
Conduct your own research and due diligence
This is a research framework designed for traders to explore and customize, not a plug-and-play trading system.
