Order Blocks W/ Realtime Fibs [QuantVue]The "Order Blocks W/ Realtime Fibs" indicator is a comprehensive tool combining the concepts of order blocks with Fibonacci retracement. The combination can be a powerful tool for identifying entry and exit points, and potential target areas.
Order blocks indicate where major players have likely placed their orders, while Fibonacci levels provide a mathematical basis for potential support and resistance areas.
What is an Order Block?
An order block in trading refers to an area on the chart in which it is believed a substantial number of orders (buy or sell) collected over a short period. Typically, these are identified as a range of consecutive aggressive bullish or bearish bars (candles). They represent areas where significant market players have entered the market, creating a footprint of their activity.
The indicator is highly customizable allowing user to select the number of consecutive bars and minimum price movement required for an order block, along with other settings like requiring a new order block in the opposite direction before finding a new order block.
Fibonacci Retracements
Fibonacci retracements are popular among technical traders, based on the idea that markets often retrace a predictable portion of a move, after which they continue to move in the original direction.
Once an Order Block is detected the indicator will automatically draw Fibonacci levels and continue to update those levels in real time until the user selected retracement level has been hit or a new more relevant order block has been found.
The combination of order blocks and Fibonacci retracements in this indicator can be used as a method for spotting potential reversal zones.
Indicator features:
🔹Custom Order Block Parameters
🔹Mitigation Type
🔹Custom Colors
🔹Select Retracement Levels
🔹Alerts for Order Blocks & Retracements
Give this indicator a BOOST and COMMENT your thoughts!
We hope you enjoy.
Cheers!
Recherche dans les scripts pour "fib"

FVG w/ Fibs [QuantVue]The "FVG w/ Fibs" indicator is a trading tool designed to identify and visualize Fair Value Gaps (FVGs) while overlaying two Fibonacci retracement levels.
• Bullish FVG: Occurs when the low of the current bar is higher than the high of two bars ago, and the previous close is higher than the high of two bars ago.
• Bearish FVG: Occurs when the high of the current bar is lower than the low of two bars ago, and the previous close is lower than the low of two bars ago.
The indicator filters these gaps based on user-defined criteria such as the minimum percentage size of the gap.
Once identified, these FVGs are highlighted on the chart using customizable boxes and the 50% and 61.8% (default settings) Fibonacci retracement levels are calculated and drawn based on the size of the identified FVG.
• Dynamically updates and extends the boxes as the price evolves.
• Alerts / visual changes for FVGs that get filled.
• User option for fills by Wicks or Close
• User-customizable settings for box colors, styles, and Fibonacci level appearances
Give this indicator a BOOST and COMMENT your thoughts!
We hope you enjoy.
Cheers!

3 Fib EMAs To Scalp Them AllThe "3 Fib EMAs To Scalp Them All" was made in order to clear up when we should look for shorts, longs, or walk away. Also it can alert you when a trend starts, or when there is a possible reversal. I use it for scalping/day trading in 5m-1h timeframes.
1. EMAs: By default, the indicator uses Fibonacci numbers (21, 55, 233), but you can change them.
2. Color Changes: The color of the Micro EMA line changes depending on its relation to the Mid and Macro EMAs.
When Micro EMA < Mid < Macro EMA, it turns red, indicating a potential bearish trend - that's when you should look for shorts
When Micro EMA > Mid > Macro EMA, it turns green, indicating a potential bullish trend - that's when you should look for longs
A white Micro EMA is when you need to take some rest, enjoy your coffee, and avoid overtrading.
3. Signals: The indicator provides visual signals in the form of diamonds and crosses and corresponding alert signals.
A red diamond above the bar signals a potential beginning of a downtrend
A red cross above the bar signals the end of the downtrend and can be used as a signal for a possible reversal up/breakout.
A green diamond below the bar signals a potential beginning of a downtrend,
A green cross below the bar signals the end of the uptrend and can be used as a signal for a possible reversal down/breakout.
4. Alerts: For algo traders and people who prefer to stay away from the monitor... there are alerts for every signal.
Friendly note: Don't blindly follow the signals for your long and short entries. The signals only pop up when the EMA cross value gets a confirmation. A smart move would be to wait for a retracement to the EMA line and use momentum indicators like market cipher B to pinpoint those ideal entry points.

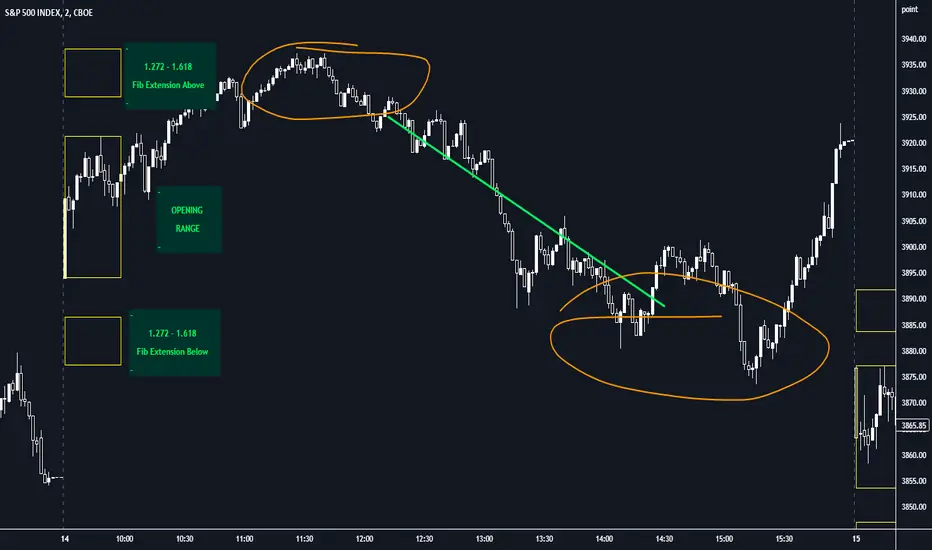
Opening Range with FibsThe indicator uses a time range and another instrument for time reference, so that it works in the time zone you care about. I have set the default to SPX500USD since it is in EST ( SPX , ES and many futures are on Chicago time and opening range gets confused). You can change the reference instrument in the settings.
You can also change the multipliers and use other values instead of 1.272 and 1.618 for Fib extensions.
TradingView has a limit as to how many objects an indicator can create so if you want to go back further for visual backtesting - use the replay tool - it will be able to draw up to the time you selected within its limits.
Let me know if you need anything else...
Happy Trading!
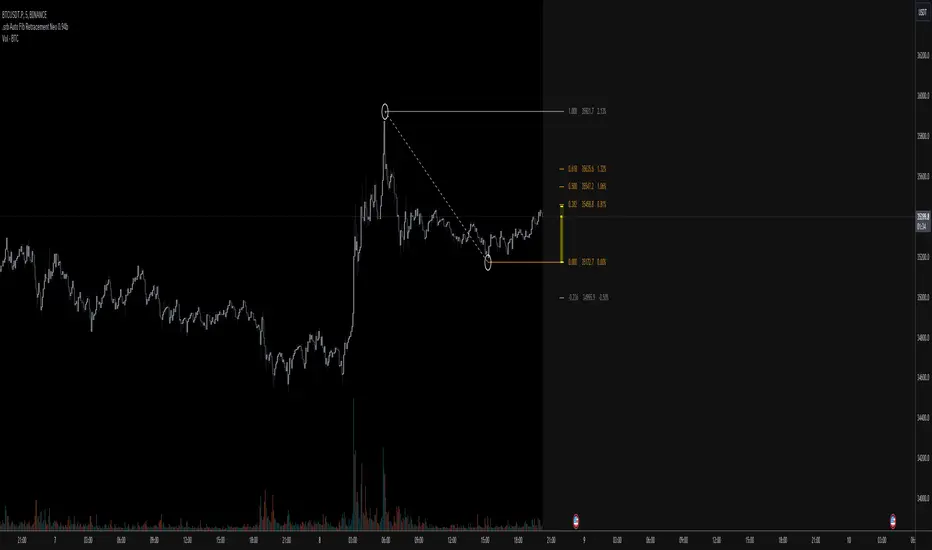
.srb suite Fib Retracement neoSPECIAL TOOLS - Auto Fibonacci Retracement neo - New GUI
designed for use with open-source indicator
'built-in auto FBR ' has been re-born
It shows - retracement Max top/ min bottom ; for higher visibility
It shows - current retracement position ; for higher visibility
The display of the Fib position that exceeds the regular range is auto-determined according to the price.
Fib.Retracement core is from tradingview built-in FBR ---> upgrade new-type GUI, and performance tuned.
Auto Fib Golden Pocket Band - Autofib Moving Averageplots the fib retracement Golden pocket moving average band on two different pivots
Martyv Auto Fib Retracement with Logarithmic SupportSimple & easy auto-fib levels. Took the out-of-the-box version provided by TradingView and added Logarithmic support and a nicer palette, and made the controls a bit nicer to use (in my opinion lol). Enjoy.

Auto Fib Retracement (Price Format)This is a modded version of TV builtin "Auto Fib Retracement". This version has the option to format price label. Sometimes when you analyzing e.g. altcoin charts against BTC. They can have more then 2 decimal points and the old version displays 0 when that happens. I also optimized it a little so it should be faster now
Fib EMAs/MAsFib EMAs/MAs
Settings -> Scale -> Indicator name value for displaying fib values on price axis

Custom Timeframe FibsThis is a testing project for fib levels to try out fivs on multi timeframes
Thank you ShoujiSuzuki


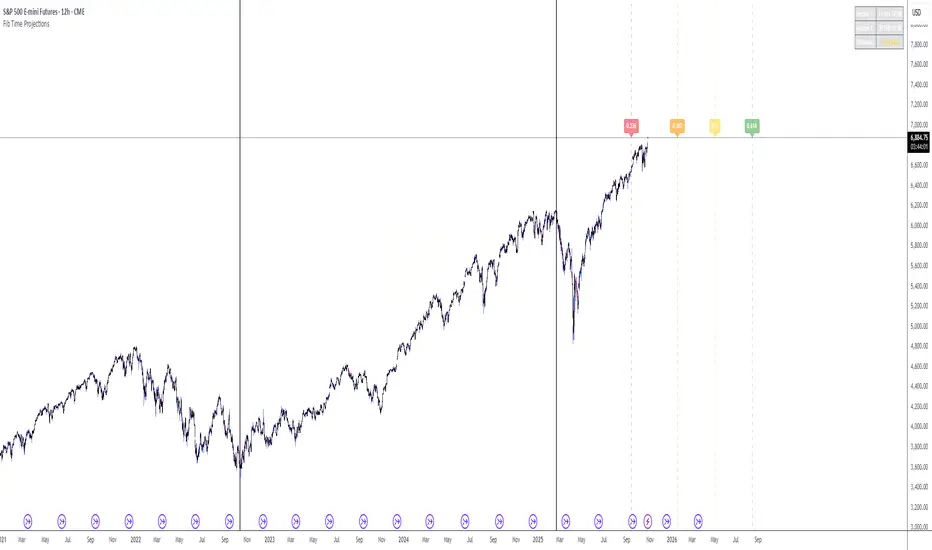
Fib Time Projections aFib Time Projections aFib Time Projections aFib Time Projections aFib Time Projections a
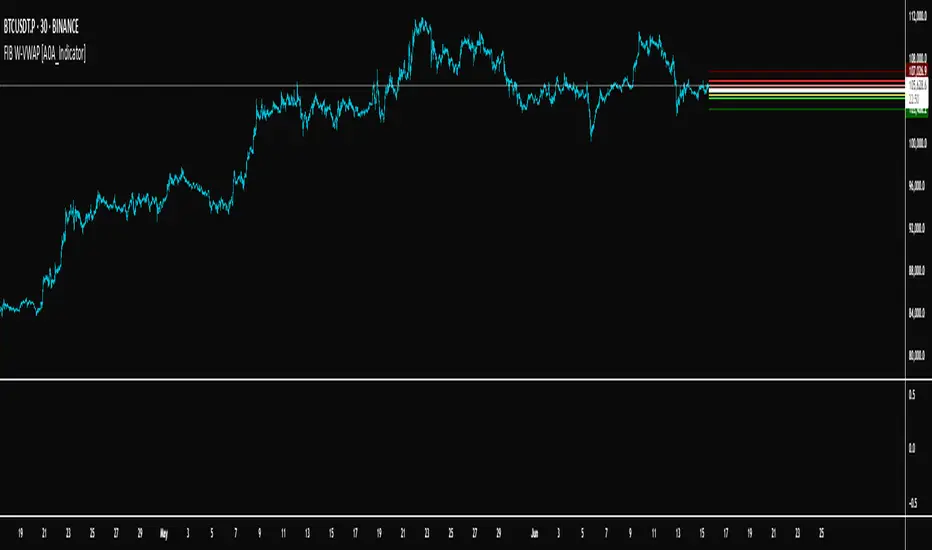
FIB W-VWAP [A0A_Indicator]FIB W-VWAP is an advanced weekly anchored VWAP indicator that leverages Fibonacci-based deviation bands and a custom price source for improved market relevance.
Key Features:
Weekly Anchored VWAP: Resets automatically at the Friday NYSE close, providing a rolling weekly anchor that aligns with professional trading practice.
Fibonacci Deviation Levels: Plots multiple deviation bands around the VWAP, calculated using fixed Fibonacci-inspired multipliers for both positive and negative directions. These serve as key support and resistance zones for mean reversion or trend continuation strategies.
Dynamic Standard Deviation: Each band is based on the live, rolling standard deviation of price within the current weekly session, adapting in real time to changing volatility.
Unique Hybrid Price Source:
VWAP and deviation bands are calculated using a custom price formula:
hidden
This approach gives extra weight to the closing price while still considering intrabar extremes, resulting in a smoother and more robust anchor compared to classic VWAP formulas (such as typical price or close-only).
Visual Enhancements:
Distinct color fills and lines for each band
Configurable transparency and labels
Clearly marked VWAP and all deviation levels, labeled with their corresponding Fibonacci levels
Adaptable for Discretionary and Systematic Trading:
Useful for identifying mean reversion trades, breakouts, and overextended moves during the trading week.
How it works:
At each new weekly session (NY close on Friday), the VWAP and its standard deviation reset.
The script continuously updates cumulative price × volume, cumulative volume, and cumulative price² × volume to maintain accurate VWAP and standard deviation calculations.
Each deviation band is plotted as a multiple of the weekly standard deviation above and below the VWAP, using fixed Fibonacci coefficients.
Labels and horizontal lines extend into the future for clear, actionable visual reference.
Why use this version?
This indicator offers greater precision in turbulent markets, robust support/resistance mapping, and is especially effective for traders seeking a more nuanced, statistically informed view of weekly price structure. The hybrid source makes it more reliable during volatility spikes than classic VWAP methods.
Ready for all timeframes and asset classes—especially powerful for intraday and swing traders working with weekly cycles.
Fib Speed Resistance Fan"Fib Speed Resistance Fan," automatically draws Fibonacci Speed Resistance Fan lines based on the first and third candles of the trading session. Here’s a breakdown of its functionality:
Functionality
Session Start Time Identification
The script identifies the first candle at 9:15 AM using timestamp(), which ensures it captures the market's opening candle.
Candle Indexing
It determines the index of the first candle (firstCandleIndex) using ta.barssince(time >= sessionStart).
The third candle is found by adding two bars to the first candle's index (thirdCandleIndex = firstCandleIndex + 2).
Ensuring Single Execution
A boolean flag hasDrawn ensures that the lines are drawn only once and do not update on future candles.
Validating Data
It checks if the firstCandleIndex and thirdCandleIndex are valid (validSession).
If conditions are met, it extracts the highs and lows of the first and third candles.
Fibonacci Calculation
The script calculates a 0.75 level price between the first candle high/low and third candle low/high.
This level helps in drawing intermediate Fibonacci fan lines.
Drawing the Fibonacci Speed Resistance Fan
If conditions are valid and hasDrawn is false, the script draws:
Main fan lines from:
First candle high → Third candle low (Blue line)
First candle low → Third candle high (Blue line)


BHUVANA Fib 50/61.8 Stairs with RR Targets Fib 50–61.8 Stairs with RR Targets (debug) automatically tracks the latest swing and draws a 50%–61.8% Fibonacci pullback zone as step-like “stairs.” From that zone it plots a planned trade framework: entry reference, stop/invalidation, and multiple Risk:Reward targets (e.g., 1R/1.5R/2R/3R).
What it’s for
Visualize the “buy/sell pullback” area (50–61.8) in trending moves
Standardize exits with RR targets instead of guessing
Quickly see when the swing/zone updates as structure changes
How to use (simple)
Wait for a clear impulse swing to form.
Let price retrace into the 50–61.8 zone.
Take entries only with your own trigger (reclaim / rejection / BOS).
Use the plotted stop and RR targets for management.
Inputs
Swing detection / lookback
RR multiples and target count
Show/hide stairs, labels, debug visuals
Important
This is a mapping tool, not a standalone signal. If you trade every touch of 50–61.8 without confirmation, you’ll get chopped. Debug version may show extra visuals and can repaint on swing updates. Not financial advice.

Fib OscillatorWhat is Fib Oscillator and How to Use it?
🔶 1. Conceptual Overview
The Fib Oscillator is a Fibonacci-based relative position oscillator.
Instead of measuring momentum (like RSI or MACD), it measures where price currently sits between the recent swing high and swing low, expressed as a percentage within the Fibonacci range.
In other words:
It answers: “Where is price right now within its most recent dynamic range?”
It visualizes retracement and extension zones numerically, providing continuous feedback between 0% and 100% (and beyond if extended).
🔶 2. What the Script Does
The indicator:
Automatically detects recent high and low levels using an adaptive lookback window, which depends on ATR volatility.
Calculates the current price’s position between those levels as a percentage (0–100).
Plots that percentage as an oscillator — showing visually whether price is near the top, middle, or bottom of its recent range.
Overlays Fibonacci retracement levels (23.6%, 38.2%, 50%, 61.8%, 78.6%) as reference zones.
Generates alerts when the oscillator crosses key Fib thresholds — which can signal retracement completion, breakout potential, or pullback exhaustion.
🔶 3. Technical Flow Breakdown
(a) Inputs
Input Description Default Notes
atrLength ATR period used for volatility estimation 14 Used to dynamically tune lookback sensitivity
minLookback Minimum lookback window (candles) 20 Ensures stability even in low volatility
maxLookback Maximum lookback window 100 Limits over-expansion during high volatility
isInverse Inverts chart orientation false Useful for inverse markets (e.g. shorts or inverse BTC view)
(b) Volatility-Adaptive Lookback
Instead of using a fixed lookback, it calculates:
lookback
=
SMA(ATR,10)
/
SMA(Close,10)
×
500
lookback=SMA(ATR,10)/SMA(Close,10)×500
Then it clamps this between minLookback and maxLookback.
This makes the oscillator:
More reactive during high volatility (shorter lookback)
More stable during calm markets (longer lookback)
Essentially, it self-adjusts to market rhythm — you don’t have to constantly tweak lookback manually.
(c) High-Low Reference Points
It takes the highest and lowest points within the dynamic lookback window.
If isInverse = true, it flips the candle logic (useful if viewing inverse instruments like stablecoin pairs or when analyzing bearish setups invertedly).
(d) Oscillator Core
The main oscillator line:
osc
=
(
close
−
low
)
(
high
−
low
)
×
100
osc=
(high−low)
(close−low)
×100
0% = Price is at the lookback low.
100% = Price is at the lookback high.
50% = Midpoint (balanced).
Between Fibonacci percentages (23.6%, 38.2%, 61.8%, etc.), the oscillator indicates retracement stages.
(e) Fibonacci Levels as Reference
It overlays horizontal reference lines at:
0%, 23.6%, 38.2%, 50%, 61.8%, 78.6%, 100%
These act as support/resistance bands in oscillator space.
You can read it similar to how traders use Fibonacci retracements on charts, but compressed into a single line oscillator.
(f) Alerts
The script includes built-in alert conditions for crossovers at each major Fibonacci level.
You can set TradingView alerts such as:
“Oscillator crossed above 61.8%” → possible bullish continuation or breakout.
“Oscillator crossed below 38.2%” → possible pullback or correction starting.
This allows automated monitoring of fib retracement completions without manually drawing fib levels.
🔶 4. How to Use It
🔸 Visual Interpretation
Oscillator Value Zone Market Context
0–23.6% Deep Retracement Potential exhaustion of a down-move / early reversal
23.6–38.2% Shallow retracement zone Possible continuation phase
38.2–50% Mid retracement Neutral or indecisive structure
50–61.8% Key pivot region Common trend resumption zone
61.8–78.6% Late retracement Often “last pullback” area
78.6–100% Near high range Possible overextension / profit-taking
>100% Range breakout New leg formation / expansion
🔸 Practical Application Steps
Load the indicator on your chart (set overlay = false, so it’s below the main price chart).
Observe oscillator position relative to fib bands:
Use it to determine retracement depth.
Combine with structure tools:
Trend lines, swing points, or HTF market structure.
Use crossovers for timing:
Crossing above 61.8% in an uptrend often confirms breakout continuation.
Crossing below 38.2% in a downtrend signals renewed downside momentum.
For range markets, oscillator swings between 23.6% and 78.6% can define accumulation/distribution boundaries.
🔶 5. When to Use It
During Retracements: To gauge how deep the pullback has gone.
During Range Markets: To identify relative overbought/oversold positions.
Before Breakouts: Crossovers of 61.8% or 78.6% often precede impulsive moves.
In Multi-Timeframe Contexts:
LTF (15M–1H): Detect intraday retracement exhaustion.
HTF (4H–1D): Confirm major range expansions or key reversal zones.
🔶 6. Ideal Companion Indicators
The Fib Oscillator works best when contextualized with structure, volatility, and trend bias indicators.
Below are optimal pairings:
Companion Indicator Purpose Integration Insight
Market Structure MTF Tool Identify active trend direction Use Fib Oscillator only in trend direction for cleaner signals
EMA Ribbon / Supertrend Trend confirmation Align oscillator crossovers with EMA bias
ATR Bands / Volatility Envelope Validate breakout strength If oscillator >78.6% & ATR rising → valid breakout
Volume Oscillator Confirm retracement strength Volume contraction + oscillator under 38.2% → potential reversal
HTF Fib Retracement Tool Combine LTF oscillator with HTF fib confluence Powerful multi-timeframe setups
RSI or Stochastic Measure momentum relative to position RSI divergence while oscillator near 78.6% → exhaustion clue
🔶 7. Understanding the Settings
Setting Function Practical Impact
ATR Period (14) Controls volatility sampling Higher = smoother lookback adaptation
Min Lookback (20) Smallest window allowed Lower = more reactive but noisier
Max Lookback (100) Largest window allowed Higher = smoother but slower to react
Inverse Candle Chart Flips oscillator vertically Useful when analyzing bearish or inverse scenarios (e.g. short-side fib mapping)
Recommended Configs:
For scalping/intraday: ATR 10–14, lookback 20–50
For swing/position trading: ATR 14–21, lookback 50–100
🔶 8. Example Trade Logic (Practical Use)
Scenario: Uptrend on 4H chart
Oscillator drops to below 38.2% → retracement zone
Price consolidates → oscillator stabilizes
Oscillator crosses above 50% → pullback ending
Entry: Long when oscillator crosses above 61.8%
Exit: Near 78.6–100% zone or upon divergence with RSI
For Short Bias (Inverse Setup):
Enable isInverse = true to visually flip the oscillator (so lows become highs).
Use the same thresholds inversely.
🔶 9. Strengths & Limitations
✅ Strengths
Dynamic, self-adapting to volatility
Quantifies Fib retracement as a continuous function
Compact oscillator view (no clutter on chart)
Works well across all timeframes
Compatible with both trending and ranging markets
⚠️ Limitations
Doesn’t define trend direction — must be used with structure filters
Can whipsaw during choppy consolidations
The “lookback auto-adjust” may lag in sudden volatility shifts
Shouldn’t be used standalone for entries without structural confluence
🔶 10. Summary
The “Fib Oscillator” is a dynamic Fibonacci-relative positioning tool that merges retracement theory with adaptive volatility logic.
It gives traders an intuitive, quantified view of where price sits within its recent fib range, allowing anticipation of pullbacks, reversals, or breakout momentum.
Think of it as a "Fibonacci RSI", but instead of momentum strength, it shows positional depth — the vibrational location of price within its natural swing cycle.

Fib,Guppy Multiple MA(FGMMA)(A/D & Volume Weight,SMA,EMA)[cI8DH]Features:
- 3 + 12 MAs (12 is chosen because Guppy has 12 MAs)
- MA types can be set to Simple, Exponential, Weighted, and Smoothed
- Volume weight can be applied to all available MAs (the built-in VWMA uses Simple MA)
- It is possible to count in only effective portions of the volume in the equation by using Accum/Dist Volume Weight
- Secondary smoothing (useful when volume weight is enabled)
- Predefined MA sets based on Fibonacci sequence (2,3,5,8,.., 377), Guppy (3,5,8,10,12,15 &30,35,40,45,50,60), and cI8DH (2,3,5,8,12,17 & 30,34,39,45,52,60)
Recommended settings:
- hlc3 as input source captures all the essential information encapsulated in a candle. I'd use hlc3 as the default option. In uptrend, "low" and in downtrend, "high" might give more relevant results when using MAs for structural analysis of a market. For commonly used MAs (EMA20, SMA50,100,200), "close" should be used due to their self-fulfilling prophecy effect.
- When you have volume weight above 0, you may want to use secondary smoothing.
- Try not to use Simple MA for smaller lengths (below 20). Sharp changes in the past (right before the period specified by the length) will affect the current value of MA dramatically leading to confusion.
- I am using the first 3 MAs for SMA 50,100,200. You can disable them from the MA type selector all at once when using Fib or Guppy ribbons.
MA-based analysis:
There are different ways of structuring a market. Geometrical (trend lines, channels, fans, patterns, etc) and Fib retracement-based structuring is very common among traders. MAs give an alternative way of analyzing markets. MA ribbons such as Guppy (6 slow and 6 fast-moving MAs) are popular for analyzing market flow. IMO default Guppy sets are a bit random as the numbers do not have an elegant sequence. So I proposed my sets based on increasing sequene spacing (+1). These two MA ribbons are good for market flow analysis but the spacing of the MAs are not ideal for structuring a market. Ribbons based on the Fib sequence is a better choice for structuring a market. This is the equivalent of Fib channels but in a more dynamic form. Among other things, MA Fib ribbon can be used to assess market momentum and to compare different stages of a market. Here are two "educational-only" examples:
Notes:
- Smoothed MA with length L = Exponential MA with length 2*L-1
- Read the background section in my ADP indicator to understand how A/D Volume is calculated

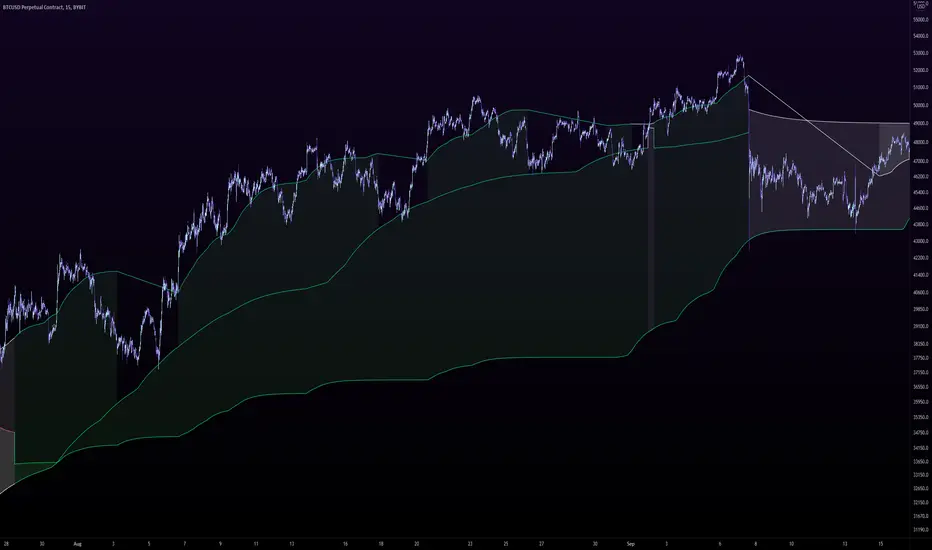
Fib Retracement Bands - Sierra (FibSierra)Hello Traders!
FibSierra is a moving fibonacci retracement band indicator. Its levels give you key resistance or support zones. I have written four indicators like this in total, will get to share others with you in the future. FibSierra is the oldest sister and currently the most fine tuned one. Let me know if I should share the others as well!
-x-x-x- Here's how it works: -x-x-x-
- The user first provides a length value (365 as default). This value will give the range of bars the indicator seeks the lowest and highest value, for example, last 365 bars.
- The indicator then finds the highest and lowest value in that range, and draws the fib retracement.
Example down below:
-x-x-x- Optimizing for Log Charts -x-x-x-
The indicator also gives you the ability to select what type of fib retracement you would want. By default, the indicator plots normal fib retracements (per linear scale). However, the user can check the "Optimize for Log Scale" box in order to get the retracement per logarithmic scale. I would argue that linear scale works a bit better, but it is up to your taste.
-x-x-x- Going to Different Timeframes -x-x-x-
The suggested TF to use is 1D, however interesting patterns emerge in different ones. The rule of the thumb is that with higher TimeFrames, we will find more stronger support/resistance fib levels. Going too low will cause more weak levels that are prone for false signals.
You can ask me any and all questions, and I would love to elaborate further.
Happy Trading Folks!!

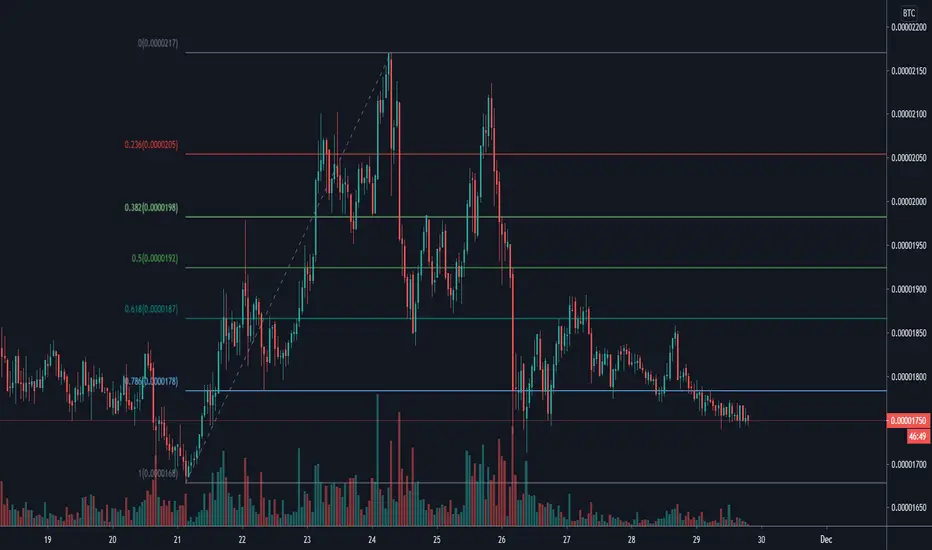
Fib Thermometer - S&P500Fib Retracement is such an amazing tool 😎 , and when u incorporate it onto a chart, no matter a forex , stock or future one, you will always secure some important and meaningful levels for your trading. I am not a huge fan of it actually 😵, but I would say it is an eye opener for me, because sometimes things don't fully make sense will make you money. I can't deny its popularity in our community and also in the trading world.
In this script, I am not intending to give a brand new version of auto drawing fib levels, but to catch the optimal timings to buy the upcoming rally after a crash 😊. Buying the dips is the approach to get rich , right? But more wisely, we can instead to buy the higher lows , not the lowest lows in order to avoid the bankruptcy risk. Nothing advanced to teach here, doing so just takes your extra patience and willingness to seek confirmation. 🕵
To cut it short, I have utilized 52-week highs and lows and two important fib levels (0.236 and 0.618) , with ten most heavily weighted stocks in s&p500 index to create some awesome signals. The rationale is first defining two fib levels with the 52-week-high-low range, then if those stocks rebounded just higher than 0.236 levels, we can confirm the trend has changed and start our buying . For the 0.618 level, you can use it as a profit taker , or a sell signal during the bull run. What decides a trend continuation or a trend change is the degree of the retracement , and 0.236 would be an ideal level to confirm the trend has changed.😃
For your own convenience, you can amend or diy the script to make it work for you by simply put your favorite stocks or indexes on the list. Hope you find it really helpful and HAPPY TRADING!!! 😃
If you find my scripts useful, please click the FOLLOW button and I am VERY VERY GRATEFUL.😘
