Extended MacrosExtended Macro Times from XX:42 to XX:15.
These are the times to trade and when the Smart Money Reversal is likely to occur.
Recherche dans les scripts pour "ict"

RTH Previous Day's Range + SMTs [bilal x shpat]Overview
This advanced indicator is designed specifically for futures and equity traders who focus on Regular Trading Hours (RTH) sessions. It automatically plots the previous RTH session's high and low levels and detects Smart Money Theory (SMT) divergences across multiple correlated or inversely correlated instruments.
Key Features
📊 RTH Range Detection
Automatically identifies and tracks Regular Trading Hours (9:30 AM - 4:14 PM New York time)
Plots horizontal lines at the previous RTH session's high and low
Works seamlessly on all timeframes, including ETH (Extended Trading Hours) charts
Lines dynamically extend and update as new bars form
🔄 Smart Money Theory (SMT) Divergence Detection
Compares up to 3 correlated or inversely correlated assets simultaneously
Detects bullish and bearish SMT divergences automatically
Visual divergence lines connect previous session levels to current intraday highs/lows
Customizable SMT labels showing which instruments are diverging
Option to mark assets as "Correlated" or "Inversely Correlated" for accurate divergence detection
SMT detection occurs only during RTH sessions for cleaner signals
🎨 Fully Customizable Styling
3 Label Styles: Choose between "Full" (RTH Previous Day High), "Short" (RTH PDH), or "Lowercase" (rth previous day high)
Adjustable Label Sizes: Tiny, Small, Normal, or Large
Custom Colors: Separate color controls for lines, labels, bullish SMT, and bearish SMT
Line Extension: Control how many bars ahead lines extend
Line Width: Customize line thickness
📈 SMT Visual Indicators
Arrow Symbols: ▲ = Higher / ▼ = Lower (for correlated assets)
Alternate Symbols: 🔺 = Higher / 🔻 = Lower (for inversely correlated assets)
Color-coded divergence lines (white by default, fully customizable)
Optional SMT labels showing ticker symbols with directional indicators
Optional comparison table displaying current divergence status
⚙️ Comparison Settings
Add up to 2 comparison symbols (e.g., ES1!, YM1!, NQ1!)
Toggle each comparison asset on/off independently
Set correlation type (Correlated or Inversely Correlated) for each asset
Popular comparisons: ES vs NQ, YM vs ES, Equity vs Futures
🧹 Clean Chart Management
Option to delete previous RTH SMTs when new session starts
Automatic cleanup of outdated lines and labels
Transparent label backgrounds for minimal chart clutter
Lines track exact bar where high/low occurred
How It Works
Session Detection: The indicator identifies when RTH begins (9:30 AM ET) and tracks all price action during the session until close (4:14 PM ET)
Level Capture: At the start of each new RTH session, it captures the previous session's high and low and plots them as reference levels
SMT Analysis: During the current RTH session, it continuously compares the current session's high/low with the previous session's high/low across all selected instruments
Divergence Identification: When one instrument makes a higher high while another makes a lower high (or vice versa), an SMT divergence is detected and visualized
Use Cases
Liquidity Analysis: Identify when markets are taking liquidity at different rates
Reversal Signals: SMT divergences often precede significant reversals
Correlation Trading: Monitor when traditionally correlated markets begin to diverge
Key Level Trading: Use previous RTH high/low as support/resistance levels
Multi-Market Analysis: Compare ES, NQ, and YM simultaneously for institutional flow
Best Practices
Most effective on intraday timeframes (1m - 15m charts)
Works on both RTH and ETH chart sessions - meant to be used on a RTH chart
Compare highly correlated instruments (e.g., ES1! vs NQ1!)
Use in combination with volume analysis and market structure
SMT divergences are most powerful near key levels
Settings Overview
Comparison Symbols
Asset 2 & 3: Select tickers to compare (e.g., ES1!, YM1!)
Correlation toggles for each asset
Enable/disable each comparison independently
Styling
Line color, width, and extension length
Label color, size, and style (3 options)
Separate colors for bullish and bearish SMT lines
SMT Controls
Toggle SMT detection on/off
Show/hide SMT text labels
Optional SMT comparison table
Delete previous session SMTs option
Note: This indicator is best used by traders familiar with Smart Money Concepts (SMC) and inter-market analysis. Understanding market correlations is essential for accurate interpretation of SMT divergences.
thank you shpat for the SMT option in the last indicator, i tweaked it for this one

Freedom Candlestick v5.0.5The is a momentum trading strategy for futures. There are also components of ICT, trend following, volume distribution, and volatility involved in the logic. We are currently using it on NQ and GC. We are also in the process of building a set up to work with ES.

IRONBULL FX Venom [TradeFinder] SMC NY Session 2025Setup📌 IRONBULL FX VENOM TRADER
Overview:
The IRONBULL FX VENOM TRADER is a premium Smart Money Concepts (SMC)-based indicator built for institutional-style trading in the New York session. Powered by advanced order block refinement, fair value gap (FVG) detection, and session-based logic, this tool helps traders identify high-probability trading zones and mitigate market noise.
🔧 Key Features:
Order Block Refinement Engine
Integrates with advanced refining logic to filter institutional demand/supply zones, with both Defensive and Aggressive refinement modes.
Fair Value Gap (FVG) Filtering
Detects and highlights FVGs with dynamic filtering options, from Very Aggressive to Very Defensive levels.
Mitigation Levels Control
Allows users to select Proximal, 50%, or Distal levels for precise reaction zones within both OBs and FVGs.
CISD Detection
Captures key short-term displacement shifts, showing potential reversal or continuation signals with optional visual cues.
NY Session Logic
Includes built-in logic to align trades with the New York Opening Range (08:00–09:30 EST) and NY Trading Hours (09:30–17:00 EST). Key session highs/lows are tracked and labeled automatically.
Visual Clarity
Fully customizable color schemes for demand/supply OBs, FVGs, and CISD levels, with lightweight rendering for real-time performance.
🧠 Ideal For:
SMC/ICT-based traders
New York session scalpers and intraday traders
Traders seeking clean institutional zone mapping
Anyone needing visual confirmation of OB + FVG confluence
⚙️ How to Use:
Enable the indicator on a chart (preferably with NY session timezone).
Adjust refinement, FVG filters, and display settings based on your strategy.
Use the OB and FVG zones as key confluence areas for entries/exits.
Watch for CISD labels and session breakouts for high-confidence setups.
Disclaimer: This tool is for educational purposes and not financial advice. Always test in a demo environment before live trading.

Overnight Time Box Overnight Time Box (22:59 → 09:59, minutes & TZ)
Automatically draws a time-based box for a customizable window that can cross midnight. Perfect for marking the overnight range up to London open (e.g., 22:59–09:59 in Europe/Bucharest), but works with any minute-level window.
What it does
Builds a daily box covering all price action between two user-defined times (e.g., 22:59 → 09:59).
Tracks session High/Low in real time and can plot extended HL lines for reference.
Keeps historical boxes on the chart for backtesting and review (no flicker, no errors).
How to use
Add the script to an intraday chart.
Configure:
Time zone (default: Europe/Bucharest).
Interval (HHMM-HHMM) — e.g., 2259-0959 (minutes supported).
Optional: High/Low lines, fill color, border color, line width.
Use on intraday timeframes (M1–H4).
Note: On Daily/Weekly/Monthly, a heads-up label reminds you it’s designed for intraday use.
Inputs
Time zone: correct DST handling.
Interval (HHMM-HHMM): supports windows that span midnight.
Draw High/Low lines: extended HL guides for the session.
Colors & widths: full visual customization.
Use cases
Mark the overnight range into London open (10:00 RO).
Delimit Killzones / ICT Silver Bullet windows.
Study range, liquidity raids, FVGs before major sessions.
Tech notes
Built on Pine Script v5 using input.session → stable, DST-safe.
Increased max_boxes_count / max_lines_count to preserve history.
Boxes are “frozen” at session end and remain on chart.
Limitations
Intended for intraday only.
One interval per script instance; attach multiple instances for multiple windows.

HTF Ranges - AWR/AMR/AYR [bilal]📊 Overview
Professional higher timeframe range indicator for swing and position traders. Calculate Average Weekly Range (AWR), Average Monthly Range (AMR), and Average Yearly Range (AYR) with precision projection levels.
✨ Key Features
📅 Three Timeframe Modes
AWR (Average Weekly Range): Weekly swing targets - Default 4 weeks
AMR (Average Monthly Range): Monthly position targets - Default 6 months
AYR (Average Yearly Range): Yearly extremes - Default 9 years
🎯 Dual Anchor Options
Period Open: Week/Month/Year opening price
RTH Open: First RTH session (09:30 NY) of the period
📐 Projection Levels
100% Range Levels: Upper and lower targets from anchor
Fractional Levels: 33% and 66% zones for partial targets
Custom Mirrored Levels: Set any percentage (0-200%) with automatic mirroring
Example: 25% shows both 25% and 75%
Example: 150% shows both 150% and -50%
📊 Information Table
Active range type (AWR/AMR/AYR)
Average range value for selected period
Current period range and percentage used
Distance remaining to targets (up/down)
Color-coded progress (green/orange/red)
🎨 Fully Customizable
Orange theme by default (differentiates from daily indicators)
Line colors, styles (solid/dashed/dotted), and widths
Toggle labels on/off
Adjustable lookback periods for each timeframe
Independent settings for each range type
⚡ Smart Features
Lines start at actual period open (not fixed lookback)
Automatically tracks current period high/low
Works on any chart timeframe
Real-time range tracking
Alert conditions when targets reached or exceeded
🎯 Use Cases
AWR (Weekly Ranges):
Swing trade targets (3-7 day holds)
Weekly support/resistance zones
Identify weekly trend vs rotation
Compare daily moves to weekly context
AMR (Monthly Ranges):
Position trade targets (2-4 week holds)
Monthly breakout levels
Institutional-level zones
Earnings play targets
AYR (Yearly Ranges):
Major reversal zones
Long-term support/resistance
Identify macro trend strength
Annual high/low projections
💡 Trading Strategies
AWR Strategy (Swing Trading):
Week opens near AWR lower level = potential long setup
Target AWR 66% and 100% levels
Week hits AWR upper in first 2 days = watch for reversal
Use fractional levels as scale-in/scale-out points
AMR Strategy (Position Trading):
Month opens near AMR extremes = fade setup
Month breaks AMR in week 1 = expansion (trend) month
Target opposite AMR extreme for swing positions
Use 33%/66% for partial profit taking
AYR Strategy (Long-term Context):
Price near AYR extremes = major reversal zones
Breaking AYR levels = historic moves (rare)
Use for macro trend confirmation
Great for yearly forecasting and planning
📊 Range Interpretation
<33% Range Used: Early in period, room for expansion
33-66% Range Used: Normal progression
66-100% Range Used: Extended, approaching extremes
>100% Range Used: Expansion period - trending or high volatility
⚙️ Settings Guide
Lookback Periods:
AWR: 4 weeks (standard) - adjust to 8-12 for smoother average
AMR: 6 months (standard) - seasonal patterns
AYR: 9 years (standard) - captures full cycles
Anchor Type:
Period Open: Use for clean week/month/year open reference
RTH Open: Use if you only trade day session, ignores overnight gaps
Custom Levels:
25% = quartile targets
75% = three-quarter targets
80% = "danger zone" for reversals
111% = extended breakout target
🔄 Combine with ADR Indicator
Run both indicators together for complete multi-timeframe analysis:
ADR for intraday precision
AWR/AMR/AYR for swing/position context
See if today's ADR move is significant in weekly/monthly context
Multi-timeframe confluence = highest probability setups
💼 Ideal For
Swing Traders: Use AWR for 3-10 day holds
Position Traders: Use AMR for 2-8 week holds
Long-term Investors: Use AYR for macro context
Index Futures Traders: ES, NQ, YM, RTY
Multi-timeframe Analysis: Combine with daily ADR

PipGuard RollerPipPipGuard RollerPip – Confirmed Swing (H/L) Detector with Visual Guidance
Indicator published by PipGuard.
PipGuard RollerPip is a confirmed swing detector that plots H (swing high) and L (swing low) labels directly on the chart. It includes horizontal guides extending to the current candle and a compact legend showing the latest detected swing.
The logic is designed to identify true structural swings , filtering out market noise and ignoring minor fluctuations that lack technical relevance.
How it Works
• Detection Method (Non-Classical):
Unlike traditional 3-candle or fractal models (e.g., ICT-style structures), RollerPip employs a more refined process. It combines trend dynamics , movement amplitude , volume intensity , and closing behavior within a dynamic bar range .
This approach allows it to detect genuine structural swings moments where price exhaustion or continuation is confirmed while drastically reducing false signals.
• Labels and Guides:
Each confirmed swing generates an H (High) or L (Low) label with a progressive effect that softens over time.
Optional horizontal guides extend the swing level to the current candle, offering a clear visual anchor for ongoing analysis.
• Dynamic Legend:
A mini-legend updates in real-time, showing the most recent swing (H or L) for immediate context of the current market phase.
• Built-in Alerts (Focus):
Alerts trigger only on candle close when a new confirmed swing High or Low is detected.
Notifications automatically include symbol and timeframe , ensuring you never miss a key structural move , even when away from the chart.
How to Use
1. Add the script to your chart.
2. Observe the H/L labels to identify confirmed swing points.
3. Use the guides to maintain a visual reference up to the current bar.
4. Enable alerts (New Swing HIGH / LOW) to receive automatic notifications whenever a new swing is confirmed.
5. Integrate this information into your own technical workflow and risk management system.
EXAMPLE OF USE
EXAMPLE OF USE
Settings
• `Label Size` → Controls the size of H/L markers.
• `Swing → Current Candle Guides` → Enables or disables guide lines.
• `Maximum Guide Length (bars)` → Sets the extension of the visual reference.
• `Dashed Style` → Toggles between solid or dashed line style.
• Integrated Alerts: Two ready-to-use conditions ( New Swing HIGH / LOW ) with formatted messages (ticker + timeframe).
• All visual parameters are preconfigured to ensure a clean, consistent, and professional display.
Limitations
• Swings are confirmed on bar close they validate turning points but do not anticipate them.
• In low-volatility or sideways phases, more frequent swings may appear.
• Past performance does not guarantee future results .
Access
This script is available under invite-only access .
To request access, use the link provided in our Signature below this publication.
Note: This is a technical analysis tool designed to study price structure and movement. It does not constitute investment advice or imply guaranteed outcomes.
Indicator published by PipGuard.

RAFEN-G - Kill Zones & Institutional Gaps🔍 What It Does
Kill Zones (KZ1, KZ2, KZ3)
Automatically highlights the main intraday liquidity windows such as the London open, NY AM, and NY PM sessions — customizable by time, color, and transparency.
Perfect for timing setups, identifying liquidity sweeps, or backtesting session behavior.
Institutional GAP Detection (NY 11:00 → 03:00)
Anchored on the New York H1 clock, the script automatically draws the “institutional gap” between the 11:00 close and the 03:00 open of the next trading day.
Each gap is drawn as a transparent box with a label showing its size in price units.
Dynamic Cleanup & Color Updates
Automatically removes old boxes beyond your chosen history limit and keeps all visuals perfectly synchronized in real-time.
⚙️ Key Features
3 fully independent and editable Kill Zones
Adjustable timezone (default: America/New_York)
Works on all intraday timeframes
Auto-management of historical data
Clean and lightweight visuals (up to 2000 boxes)
Real-time color and transparency updates
Alerts when each Kill Zone starts
🧠 Ideal For
Traders using ICT, SMC, or institutional frameworks who want clear visual separation of market sessions and automatic tracking of session-to-session gaps for confluence or imbalance analysis.
🕐 Recommended Use
Apply on 5 min / 15 min / 1 h charts, align timezone to NYC, and combine with liquidity or FVG tools for maximum insight.

Session Liquidity Levels – Indicator for Smart Day Traders🧭 Session Liquidity Levels – Indicator for Smart Day Traders
Identify Key Market Liquidity Zones with Precision
The Session Liquidity Levels indicator automatically plots the most important market levels every day — giving you a clear view of where liquidity is building and where potential reversals or breakouts can occur.
This tool is designed for traders who rely on session structure and clean market levels rather than noise or lagging indicators.
⚙️ Features
✅ Asia Session High & Low – See the overnight range where liquidity starts building.
✅ London Session High & Low – Track the major volatility window and identify sweeps or fakeouts.
✅ Previous Day High & Low – Key reference points for continuation or reversal plays.
✅ Custom Colors & Styling – Personalize line colors and styles to fit your chart theme.
✅ Lightweight & Fast – Built in Pine Script v5 for smooth performance on all assets.
📊 How It Helps
Quickly visualize session highs/lows to plan liquidity grabs or breakout entries.
Mark daily structure without manually drawing lines.
Combine with your existing strategy to refine entry and exit timing.
Works on Forex, Indices, and Metals across all intraday timeframes.
⚡ Best For
Day traders who use session-based strategies (like Asia → London → New York transitions).
Traders studying liquidity sweeps, breakouts, or market structure shifts.
Anyone who wants a clean, automatic way to see session boundaries and key highs/lows.
🕌 Ethical Note
This indicator is 100% original, independently coded, and inspired by common trading concepts such as session ranges and daily structure.
It is not affiliated with or copied from any other paid indicators.
💰 Access
Available as an Invite-Only Script on TradingView.
Once purchased, you’ll receive access within 24 hours.
📩 Support
If you have any issues or want custom modifications (extra sessions, alerts, etc.), contact me directly — I’ll help you set it up.
Trade smarter. Stay disciplined. Let your levels guide you.

3s CISD 9 EMA- [CT]Private Algorithm that is invite only. It is only spread through word of mouth and is not available on any website.
This algorithm will give you the best chance at being green and is even better when following specific plays of someone or yourself.
This is not supposed to guarantee profit and the team are not financial advisors. Please always manage your own risk according to your risk tolerance .
Overview
The 3s CISD 9 EMA – indicator is a versatile market structure and sentiment tool that combines CISD (Change in Structural Direction) levels, EMA-based trend bias, and candlestick pattern detection to identify key turning points and continuation setups in price action.
It’s designed for traders seeking precision entries during structural shifts or reversals across any symbol or timeframe.
Key Features
🟡 9 EMA Trend Bias
Plots a 9-period Exponential Moving Average (EMA) to define short-term trend direction.
Optional bar coloring (green for bullish, red for bearish) helps visualize momentum shifts.
📊 CISD (Change in Structural Direction) Levels
Detects bullish and bearish pullbacks and confirms CISD breaks when price structure shifts direction.
Auto-draws labeled horizontal lines (+CISD / -CISD) at critical breakout points.
Supports line style customization (Solid, Dotted, Dashed), width, and extension for clarity.
Option to keep or clear old CISD levels.
Includes alert conditions when a new CISD formation is confirmed.
Real-time state table shows current structure bias: Bullish or Bearish.
📈 Candlestick Signal Suite
1. 3-Line Strike Pattern
Detects both bullish and bearish 3-line strike formations.
Useful for identifying exhaustion moves or reversals after a trend leg.
Configurable on/off toggles for each direction.
2. Engulfing (Big A$$ Candles)
Highlights large engulfing candles that dominate the previous bar.
Distinguishes bullish engulfing (orange triangle up) and bearish engulfing (blue triangle down).
Integrated alert conditions for automated notifications.
Customization Options
Toggle visibility for EMA, bar colors, CISD lines, labels, and pattern signals.
Adjustable line width, style, and extension length for CISD visuals.
Selectable table position (Top Right, Bottom Center, etc.).
Separate alert controls for bullish and bearish CISD events.
Alerts
“Bullish CISD Formed” → Indicates potential upward structural shift.
“Bearish CISD Formed” → Indicates potential downward structural shift.
Engulfing pattern alerts → Triggered when large reversal candles appear.
How to Use
Enable EMA and bar color for quick trend visualization.
Watch for CISD line breaks to anticipate structural changes.
Confirm entries with 3-Line Strike or Engulfing candle signals.
Use the State Table to track current directional bias.
Optional: Set alerts for CISD events to stay informed automatically.
Best Used For
Structure-based trading (ICT, Wyckoff, or price-action styles).
Identifying short-term reversals or continuation setups.
Multi-timeframe confluence analysis.
Momentum confirmation with 9 EMA and pattern alignment.
Disclaimer:
This script is for educational and analytical purposes only. Past performance does not guarantee future results. Always perform independent analysis before making trading decisions.

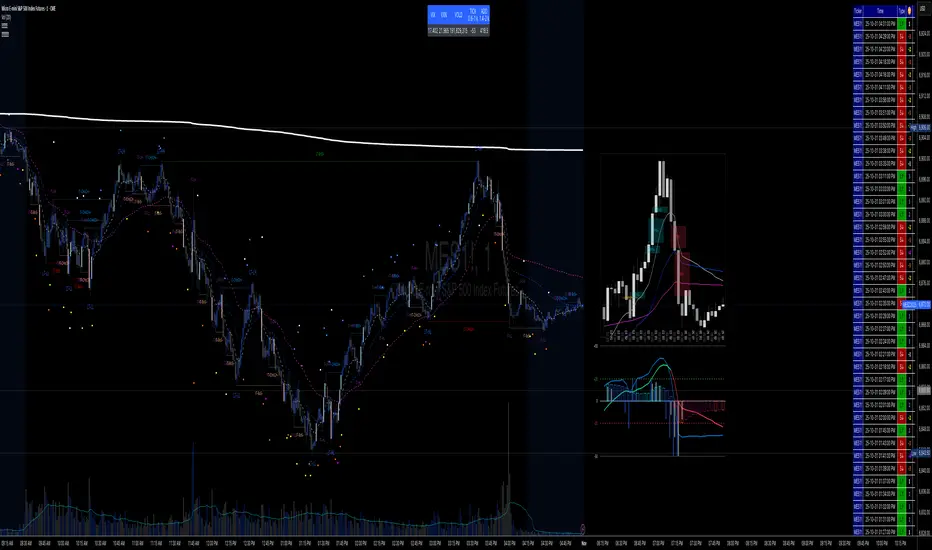
✝️📈📉☢️BANG is a comprehensive multi-timeframe indicator for TradingView, designed for intraday trading of futures and stocks.
To use: Add to a low timeframe chart (e.g., 1-5 minutes), configure anchor mode (daily/weekly/monthly/manual) for session resets, and select timeframe for signals (e.g., 5m). Monitor the mini-charts for HTF overview (candles, VWEMA/VWAP, FVG), RSI/MACD trends, market data table (VIX/VXN/etc.), and ICT structure (pivots, BOS/CHoCH).
For trading: Enter LONG/SHORT on signal bars with strength ☢️ (1-6, higher = stronger confluence), confirmed by multi-timeframe alignment (e.g., anchor daily while trading minutes). Use ATR-based risk management; backtest in demo mode.
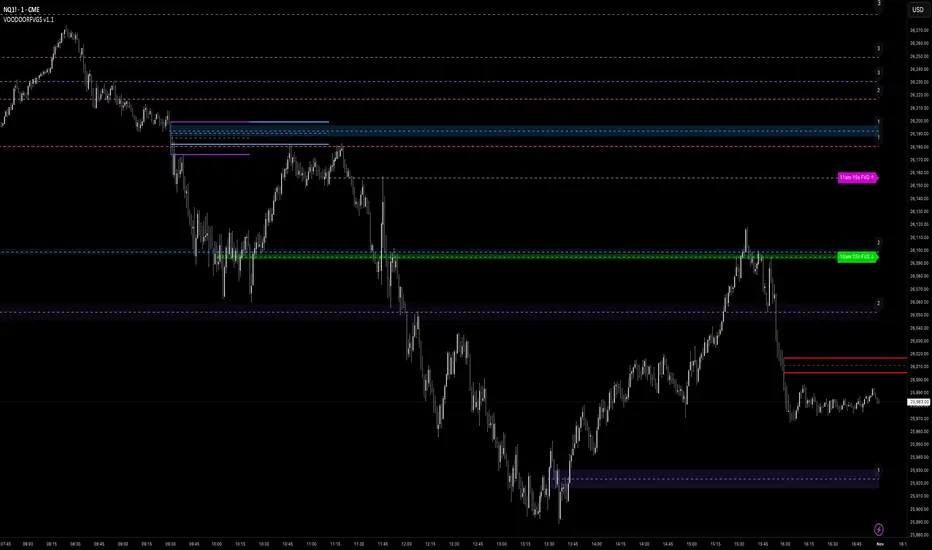
VOODOORFVGS v1.1Voodoo Doors - Multi-Timeframe FVG & Range Analysis
Voodoo Doors is a comprehensive trading indicator designed to identify and track critical Fair Value Gaps (FVGs) and price ranges
across multiple timeframes. This powerful tool combines time-based FVG detection with Opening/Closing Range analysis to highlight
high-probability trading zones.
Key Features:
🚪 First Presented FVGs (FPVG)
Track up to 3 customizable FVGs that occur at specific times throughout the trading day:
- FPVG 1 (Default: 9:31 AM) - Early session gap detection
- FPVG 2 (Default: 1:31 PM) - Midday reversal zones
- FPVG 3 (Default: 6:15 AM) - Pre-market opportunities
Each FPVG includes:
- Historical tracking (up to 30 days)
- Age labels showing gap freshness
- Customizable fill colors, borders, and mid-lines
- Auto-extension to current bar
- Progressive transparency for older gaps
⚡ 15-Second Lower Timeframe FVGs
Precision intraday analysis during critical hours:
- 10am FVG - Morning volatility capture
- 11am FVG - Late morning momentum shifts
- Real-time detection using 15-second data
- Directional labels (↑/↓) for quick identification
📊 Opening Range (OR)
30-second precision Opening Range levels:
- Default: 9:30 AM market open
- High/Low and Equilibrium (EQ) levels
- Configurable historical tracking (up to 5 sessions)
- Price touch alerts available
- Extended or fixed-length projection
🔴 Closing Range (CR)
End-of-day price action analysis:
- Default: 3:59 PM (15:59)
- Captures final market positioning
- Independent styling from OR levels
- Optional extension into next session
🎯 Custom Range (CUR)
Flexible user-defined range detection:
- Any time, any timeframe
- Perfect for capturing specific news events
- Fully customizable colors and styles
- Alert functionality for level touches
Visual Customization:
Every element is fully customizable:
- Line styles: Solid, Dashed, Dotted
- Individual color controls for fills, borders, and mid-lines
- Adjustable transparency (0-100%)
- Line width controls
- Historical opacity settings
Professional Features:
✅ Non-repainting - all signals are final✅ Multi-timeframe support with automatic detection✅ Efficient array management for
historical data✅ Market session awareness (excludes weekends)✅ Optional information table showing global market open times✅ Alert
system for price touching key levels✅ Up to 500 drawing objects supported
Best Used For:
- ICT trading methodology (FVG mitigation)
- Range breakout/breakdown strategies
- Session transition trading
- Multi-timeframe confluence analysis
- Smart money tracking
Timezone:
Default UTC-4 (New York time) - fully adjustable in settings
Recommended Timeframes:
---
Note: This indicator uses lower timeframe data requests and requires TradingView Premium/Pro+ for full functionality.
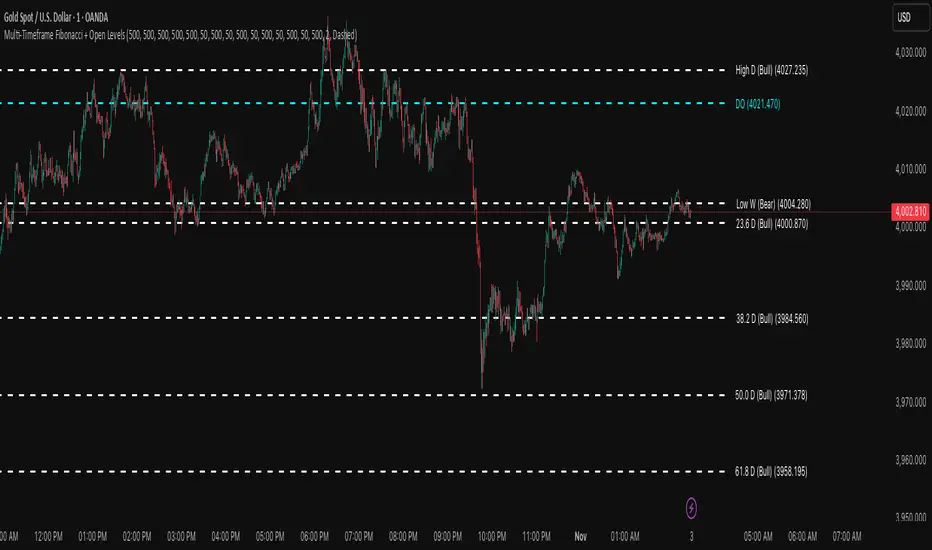
Multi-Timeframe Fibonacci + Open Levels🟣 Multi-Timeframe Fibonacci Levels + Open Levels | Trade Symmetry
This indicator automatically plots Fibonacci levels derived from higher timeframe candle ranges — all at once, directly on your current chart.
It helps you quickly visualize confluence zones and reaction levels where institutional traders are likely to participate.
⚙️ Features
✅ Multi-timeframe Fibonacci Levels — Daily, Weekly, Monthly, Quarterly & Yearly
✅ Automatic Bullish/Bearish detection based on previous candle
✅ Dynamic overlap detection (combines overlapping Fib levels into a single clean label)
✅ Configurable Fibonacci levels, colors, and styles
✅ Optional Open-Price Levels (Daily, Weekly, Monthly)
✅ Clean memory management to keep your chart lightweight
🧠 How to Use
• Add it to any timeframe — it will automatically overlay higher timeframe Fibs.
• Use overlapping or aligned Fib zones as confluence areas.
• Combine with structure or liquidity indicators for high-probability setups.
💡 Inspired by
The concept of higher-timeframe Fibonacci confluences used in Smart Money Concepts (SMC) and ICT-style analysis.
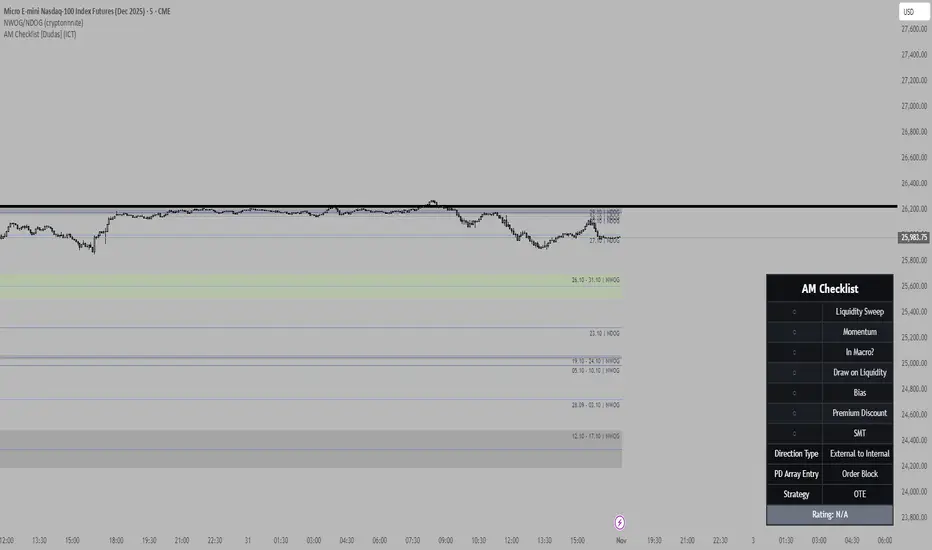
Mithsuka-Check-List V2This Is ICT Concept Based Check List Indicator, you Cn Use This For Before Enter a Trade For Confirmation Checking.

True Previous Day/Week High & LowTrue Previous Day/Week High & Low
What makes this indicator unique:
Unlike most previous day high/low indicators that only track SESSION data (e.g., 6:00 PM - 5:00 PM for futures), this indicator calculates the TRUE calendar day high and low from MIDNIGHT TO MIDNIGHT (00:00 - 23:59) in New York time.
Why this matters:
- Session-based indicators miss crucial price action that occurs during overnight hours
- True midnight-to-midnight calculation gives you the ACTUAL daily range
- Essential for traders who need accurate previous day levels for support/resistance
- Works perfectly on 24-hour markets like futures (NQ, ES, YM, etc.)
Features:
✓ True calendar day high/low (00:00-23:59 NY time)
✓ Previous week high/low
✓ Customizable line colors, widths, and styles (solid, dashed, dotted)
✓ Optional labels with adjustable size, color, and spacing
✓ Values displayed on price scale
✓ Toggle individual levels on/off
✓ Optimized for 1-minute charts but works on all timeframes
Perfect for:
- Futures traders (NQ, ES, YM, RTY)
- Day traders using previous day levels as key support/resistance
- Swing traders tracking weekly ranges
- Anyone who needs accurate 24-hour high/low levels
Settings are clean and intuitive - just add to your chart and customize the appearance to match your setup!
