Indian NIFTY Correlation Daytrade/Swing StrategyINTRODUCTION :
This is a daytrading/swing strategy designed mainly for indian market where internally has been adapted to NIFTY market and as well using for internal calculations the values of the candles from NIFTY asset.
With it we search to use with the most correlated asset from the indian market.
For this example I choosed BANKNIFTY
STRATEGY:
The strategy initially uses as candle values the data from the NIFTY asset.
With them I am dividing the work into two calculation parts such as :
-For first part logic, I am doing calculations regarding the volatility of NIFTY, where I initially take into consideration INDIAVIX to have an idea of the expected implied volatility of NIFTY asset and then I compare it with different tools such as ATR, BB and Percentile location of the volatility.
Based on all these factors I take into account the location of the volatility which is atm and if there is a possibility of a strong movement(trend) or sidemarket situation.
-Once I am done with the values of the volatility, the next process in the script logic is to start looking into the trend.
For it I am using different tools such as volume checker, support and resistence key points, pivot points, price actions patterns and different moving averages.
-Risk management part : once we are done with calculation for the entry, the next part is to have an idea where to exit. In this case I am making use of a dynamic risk management which is compressed from multiple ideas such as : we can exit if there were a big gap on the next day in our initial direction, we can also exit based of an internal daily ATR calculation value(we use initially 15min timeframe chart) and lastly if we are around some key points like support/resistence or other different chart patterns like double top, double bot and so on.
CASE EXAMPLE:
As I said before we are initially using for calculation the NIFTY chart with 15min timeframe. With it we can apply to any indian etf,stocks,future. All the assets are going to have the same time of entry and the same time of exit(we get this from NIFTY) and we plot it on the chart we are using, so its key point to look for assets which have a min 75-80% correlation with NIFTY. For this example I used BANKNIFTY chart.
So a type of entry would be this way
Lets assume NIFTY50 is on 19.000 level
INDIAVIX level is currently at 11 which can be translated : 11 / sqrt(250)
So 11 means that on a yearly base we expect the asset to move 11% upwards or downwards
and in a year we have aprox 250 days. So we divide the 11 by sqrt of 250 to get an idea of a daily expected move from the implied volatility of india VIX
11/15.87 = +-0.69%
So INDIAVIX tells us that the values for today nifty is 19000+0,69% and 19000-0.69%
After that I am looking into the daily ATR, and I see that the expected is around 0.8% and is ascending over the last 2 weeks.
Lastly I am looking at the percentile which is currently the volatility on both ATR and INDIAVIX, and I get a value of 90th percentile.
With this my biased is that we are going to expect a short trend, but i cant confirm on the volatility alone so next step is start looking into technical analysis.
I look at volume and is increasing, I look at different price actions paterns and pivots and I see a lower low and a lower high (a descending pattern).
I also see the price is below the key MA like SMA50/100/200, VWAP and so on.
With all of this I get more confirmation that the asset is in a short trend.
Internally once a certain specific % of confirmation from all the logics is achieved, it will trigger a long/short entry, so in this case lets assume we have 80% of our indicators pointing to the short, is going to enter a short.
Now for a long scenario the scene would be , indiavix is around 9,5, ATR is descending. We are around 40th percentile of the volatility.
Our asset is above multiple moving averages, vwap , etc
We have an increasing volume towards bullish side.
And so on( overall 75% of our indicators are pointing towards the long side)
Now for the exit, since we are dealing with a daytrade/swing mentality, short on average we keep the trade open for a less period of time than long ( 19 bars of 15min candles, compared to 57 bars of 15min for long) , so most of the times for short we are going to exit next day and if the trend is still in our favour we re enter the trade.
For long we can stay much more time, sometimes even weeks and we exit mainly when the % of confirmation of indicators point out a reversal/short confirmation fo a big pice action pattern.
STRATEGY RESULTS
For strategy analysis I have used BANKNIFTY NSE with deep history to get access to data from 2011 until present( giving more than 2500 trades) .
For inputs I am using 0.02% comission total ( the comission applied from ZERODHA indian exchange is close to 0.0175% total) so I used it a bit higher in order to take into account some slippages.
For capital THE REASON I USED 100% of the capital allocation is to make a proper comparison with the buy an hold from the same period
Lets assume we had an account of 1M ruppes initially in 2011, we start using 100% of it and then the new values automatically compounded with the new profits and losses so directly compare with 1M of rupees in shares on BANKNIFTY ETFs bought in 2011(buy n hold) until present day.
STRATEGY ACCESS
Strategy is free to be tested for everyone, just let me know in private that you wish to get access to it.
Recherche dans les scripts pour "implied"

Rule of 16 - LowerThe "Rule of 16" is a simple guideline used by traders and investors to estimate the expected annualized volatility of the S&P 500 Index (SPX) based on the level of the CBOE Volatility Index (VIX). The VIX, often referred to as the "fear gauge" or "fear index," measures the market's expectations for future volatility. It is calculated using the implied volatility of a specific set of S&P 500 options.
The Rule of 16 provides a rough approximation of the expected annualized percentage change in the S&P 500 based on the VIX level. Here's how it works:
Find the VIX level: Look up the current value of the VIX. Let's say it's currently at 20.
Apply the Rule of 16: Divide the VIX level by 16. In this example, 20 divided by 16 equals 1.25.
Result: The result of this calculation represents the expected annualized percentage change in the S&P 500. In this case, 1.25% is the estimated annualized volatility.
So, according to the Rule of 16, a VIX level of 20 suggests an expected annualized volatility of approximately 1.25% in the S&P 500.
Here's how you can use the Rule of 16:
Market Sentiment: The VIX is often used as an indicator of market sentiment. When the VIX is high (above its historical average), it suggests that investors expect higher market volatility, indicating potential uncertainty or fear in the markets. Conversely, when the VIX is low, it suggests lower expected volatility and potentially more confidence in the markets.
Risk Management: Traders and investors can use the Rule of 16 to estimate the potential risk associated with their portfolios. For example, if you have a portfolio of S&P 500 stocks and the VIX is at 20, you can use the Rule of 16 to estimate that the annualized volatility of your portfolio may be around 1.25%. This information can help you make decisions about position sizing and risk management.
Option Pricing: Options traders may use the Rule of 16 to get a quick estimate of the implied annualized volatility priced into S&P 500 options. It can help them assess whether options are relatively expensive or cheap based on the VIX level.
It's important to note that the Rule of 16 is a simplification and provides only a rough estimate of expected volatility. Market conditions and the relationship between the VIX and the S&P 500 can change over time. Therefore, it should be used as a guideline rather than a precise forecasting tool. Traders and investors should consider other factors and use additional analysis to make informed decisions.

[blackcat] L1 Dynamic Volatility IndicatorThe volatility indicator (Volatility) is used to measure the magnitude and instability of price changes in financial markets or a specific asset. This thing is usually used to assess how risky the market is. The higher the volatility, the greater the fluctuation in asset prices, but brother, the risk is also relatively high! Here are some related terms and explanations:
- Historical Volatility: The actual volatility of asset prices over a certain period of time in the past. This thing is measured by calculating historical data.
- Implied Volatility: The volatility inferred from option market prices, used to measure market expectations for future price fluctuations.
- VIX Index (Volatility Index): Often referred to as the "fear index," it predicts the volatility of the US stock market within 30 days in advance. This is one of the most famous volatility indicators in global financial markets.
Volatility indicators are very important for investors and traders because they can help them understand how unstable and risky the market is, thereby making wiser investment decisions.
Today I want to introduce a volatility indicator that I have privately held for many years. It can use colors to judge sharp rises and falls! Of course, if you are smart enough, you can also predict some potential sharp rises and falls by looking at the trend!
In the financial field, volatility indicators measure the magnitude and instability of price changes in different assets. They are usually used to assess the level of market risk. The higher the volatility, the greater the fluctuation in asset prices and therefore higher risk. Historical Volatility refers to the actual volatility of asset prices over a certain period of time in the past, which can be measured by calculating historical data; while Implied Volatility is derived from option market prices and used to measure market expectations for future price fluctuations. In addition, VIX Index is commonly known as "fear index" and is used to predict volatility in the US stock market within 30 days. It is one of the most famous volatility indicators in global financial markets.
Volatility indicators are very important for investors and traders because they help them understand market uncertainty and risk, enabling them to make wiser investment decisions. The L1 Dynamic Volatility Indicator that I am introducing today is an indicator that measures volatility and can also judge sharp rises and falls through colors!
This indicator combines two technical indicators: Dynamic Volatility (DV) and ATR (Average True Range), displaying warnings about sharp rises or falls through color coding. DV has a slow but relatively smooth response, while ATR has a fast but more oscillating response. By utilizing their complementary characteristics, it is possible to construct a structure similar to MACD's fast-slow line structure. Of course, in order to achieve fast-slow lines for DV and ATR, first we need to unify their coordinate axes by normalizing them. Then whenever ATR's yellow line exceeds DV's purple line with both curves rapidly breaking through the threshold of 0.2, sharp rises or falls are imminent.
However, it is important to note that relying solely on the height and direction of these two lines is not enough to determine the direction of sharp rises or falls! Because they only judge the trend of volatility and cannot determine bull or bear markets! But it's okay, I have already considered this issue early on and added a magical gradient color band. When the color band gradually turns warm, it indicates a sharp rise; conversely, when the color band tends towards cool colors, it indicates a sharp fall! Of course, you won't see the color band in sideways consolidation areas, which avoids your involvement in unnecessary trades that would only waste your funds! This indicator is really practical and with it you can better assess market risks and opportunities!

CE - Market Performance TableThe 𝓜𝓪𝓻𝓴𝓮𝓽 𝓟𝓮𝓻𝓯𝓸𝓻𝓶𝓪𝓷𝓬𝓮 𝓣𝓪𝓫𝓵𝓮 is a sophisticated market tool designed to provide valuable insights into the current market trends and the approximate current position in the Macroeconomic Regime.
Furthermore the 𝓜𝓪𝓻𝓴𝓮𝓽 𝓟𝓮𝓻𝓯𝓸𝓻𝓶𝓪𝓷𝓬𝓮 𝓣𝓪𝓫𝓵𝓮 provides the Correlation Implied Trend for the Asset on the Chart. Lastly it provides information about current "RISK ON" or "RISK OFF" periods.
Methodology:
𝓜𝓪𝓻𝓴𝓮𝓽 𝓟𝓮𝓻𝓯𝓸𝓻𝓶𝓪𝓷𝓬𝓮 𝓣𝓪𝓫𝓵𝓮 tracks the 15 underlying Stock ETF's to identify their performance and puts the combined performances together to visualize 42MACRO's GRID Equity Model.
For this it uses the below ETF's:
Dividends (SPHD)
Low Beta (SPLV)
Quality (QUAL)
Defensives (DEF)
Growth (IWF)
High Beta (SPHB)
Cyclicals (IYT, IWN)
Value (IWD)
Small Caps (IWM)
Mid Caps (IWR)
Mega Cap Growth (MGK)
Size (OEF)
Momentum (MTUM)
Large Caps (IWB)
Overall Settings:
The main time values you want to change are:
Correlation Length
- Defines the time horizon for the Correlation Table
ROC Period
- Defines the time horizon for the Performance Table
Normalization lookback
- Defines the time horizon for the Trend calculation of the ETF's
- For longer term Trends over weeks or months a length of 50 is usually pretty accurate
Visuals:
There is a variety of options to change the visual settings of what is being plotted and the two table positions and additional considerations.
Everything that is relevant in the underlying logic that can help comprehension can be visualized with these options.
Market Correlation:
The Market Correlation Table takes the Correlation of the above ETF's to the Asset on the Chart, it furthermore uses the Normalized KAMA Oscillator by IkkeOmar to analyse the current trend of every single ETF.
It then Implies a Correlation based on the Trend and the Correlation to give a probabilistically adjusted expectation for the future Chart Asset Movement. This is strengthened by taking the average of all Implied Trends.
With this the Correlation Table provides valuable insights about probabilistically likely Movement of the Asset, for Traders and Investors alike, over the defined time duration.
Market Performance:
𝓜𝓪𝓻𝓴𝓮𝓽 𝓟𝓮𝓻𝓯𝓸𝓻𝓶𝓪𝓷𝓬𝓮 𝓣𝓪𝓫𝓵𝓮 is the actual valuable part of this Indicator.
It provides valuable information about the current market environment (whether it's risk on or risk off), the rough GRID models from 42MACRO and the actual market performance.
This allows you to obtain a deeper understanding of how the market works and makes it simple to identify the actual market direction.
Utility:
The 𝓜𝓪𝓻𝓴𝓮𝓽 𝓟𝓮𝓻𝓯𝓸𝓻𝓶𝓪𝓷𝓬𝓮 𝓣𝓪𝓫𝓵𝓮 is divided in 4 Sections which are the GRID regimes:
Economic Growth:
Goldilocks
Reflation
Economic Contraction:
Inflation
Deflation
Top 5 Equity Style Factors:
Are the values green for a specific Column? If so then the market reflects the corresponding GRID behavior.
Bottom 5 Equity Style Factors:
Are the values red for a specific Column? If so then the market reflects the corresponding GRID behavior.
So if we have Goldilocks as current regime we would see green values in the Top 5 Goldilocks Cells and red values in the Bottom 5 Goldilocks Cells.
You will find that Reflation will look similar, as it is also a sign of Economic Growth.
Same is the case for the two Contraction regimes.

VIX HeatmapVIX HeatMap
Instructions:
- To be used with the S&P500 index (ES, SPX, SPY, any S&P ETF) as that's the input from where the CBOE calculates and measures the VIX. Can also be used with the Dow Jones, Nasdaq, & Nasdaq100.
Description:
- Expected Implied Volatility regime simplified & visualized. Know if we are in a high, medium, or low volatility regime, instantly.
- Ranges from Hot to Cold: The hotter the heat-map, the higher the implied volatility and fear & vice versa.
- The VIX HeatMap, color-maps important VIX levels (7 in this case) in measuring volatility for day trading & swing trading.
Using the VIX HeatMap:
- A LOW level volatility environment: Represented by "cooler" colors (Blue & White) depicts that the level of volatility and fear is low. Percentage moves on the index level are going to be tame and less volatile more often than not. Low fear = low perceived risk.
- A MEDIUM level volatility environment: Represented by "warmer" colors (Green & Yellow) depicts that the markets are transitioning from a calmer period or from a more fearful period. Market volatility here will be higher and provide more volatile swings in price.
- A HIGH level volatility environment: Represented by "hotter" colors (Orange, Red, & Purple) depicts that the markets are very fearful at the moment and will have big swings in both directions. Historically, extreme VIX levels tend to coincide with bottoms but are in no way predictive of the exact timing as the volatile moves can continue for an extended period of time.
- Transitioning between the 7 VIX Zones: Each and every one of these specific VIX zone levels is important.
1. Extreme low: <16
2. Low: 16 to 20
3. Normal: 20 to 24
4. Medium: 24 to 28
5. Med-High: 28 to 32
6. High: 32 to 36
7. Extreme high: >36
- These VIX levels in particular measure volatility changes that have a major impact on switching between smaller time frames and measuring depths of a sell move and vice versa. Each level also behaves as its own support & resistance level in terms of taking a bit of effort to switch regimes, and aids in identifying and measuring the potential depth of pullbacks in bull markets and bounces in bear markets to reveal reversal points.
- Examples of VIX level supports depicted on the chart marked with arrows. From left to right:
1. March 10th: Markets jumped 2 volatility levels in 2 days. The fluctuations from blue to yellow to green where a sign that price action would reverse from the selloff.
2. March 28th: As soon as we move from green to the blue VIX level (<20), markets began to rally and only ended when the volatility level moved sub VIX 16 (white).
3. May 4th & 24th: Next we see the 2 dips where volatility levels went from blue to green (VIX > 20), marked bottoms and reversed higher.
4. June 1st: We see a change in VIX regime yet again into lower VIX level and markets rocket higher.
Knowing the current VIX regime is a very important tool and aid in trading, now easily visualized.

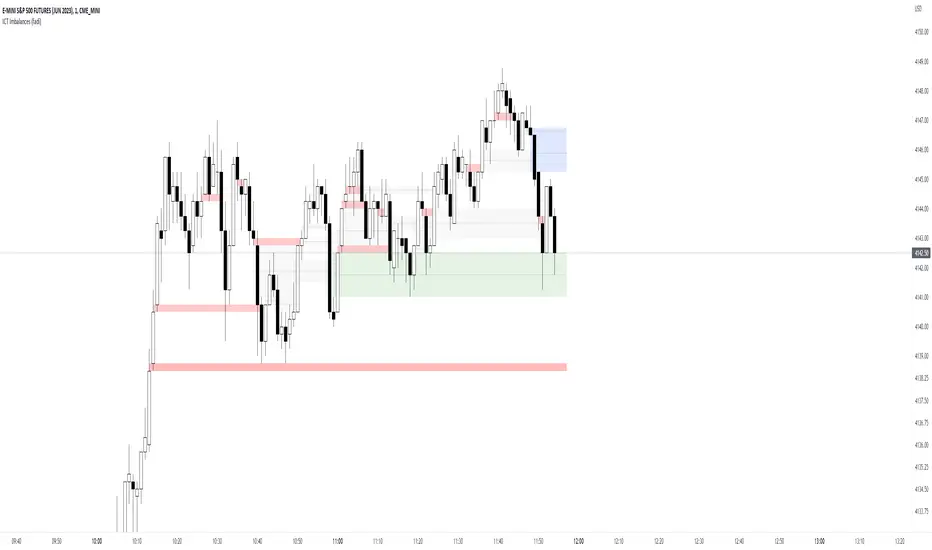
ICT Imbalances (fadi)ICT Imbalances focuses on highlighting the imbalances described by ICT Se imbalances usually act as a price magnet where price tend to revisit to mitigate the imbalance and can act as support and resistance.
It is important to understand that, while they do act as price magnet, they are not all places for entries. What they do provide, is a price understanding and possible areas of reversal based on the bigger picture and trading strategy.
There are four types of imbalances covered by this indicator:
Fair Value Gap (FVG)
Fair value is when, at any given price, both buy and sell sides are offered. For every up move, there is a down move. Fair value Gap is an imbalance where price moved too quickly before offering both buy side and sell side at a given price.
Implied Fair Value Gap (IFVG)
Implied Fair Value Gap is when the first and third candle have overlapping large wicks. The IFVG is the area between the half point of first and third candles.
Volume Imbalance (V.I.)
Volume imbalance is when the price creates a gap between the close of one candle and the open of the following candle with overlapping wicks.
Gap
An area where price gaps up or down leaving a void where price did not trade in. This is most common on higher timeframes and when one day ends and the next day begins.
Settings
ICT Imbalances provides the following options
- Show or hide specific imbalance to keep the chart clean
- Background color of the box highlighting the imbalance
- Box width in the form of how many candles the box extends to
- Show or Hide the Half Mark of the box, only applies to FVG and IFVG
- Show or hide a Legend that explains which colors represents which imbalance
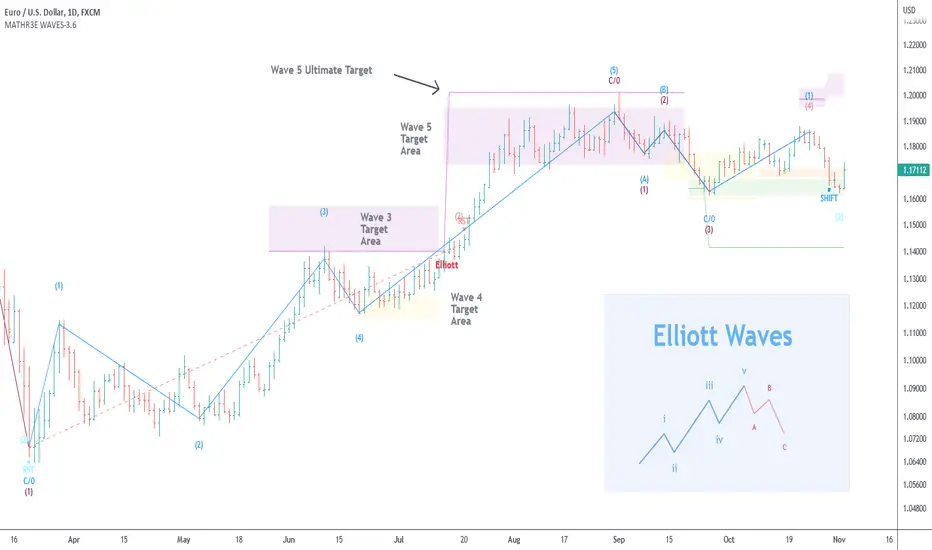
MATHR3E WAVES█ OVERVIEW
MATHR3E WAVES automatically draws Elliott Waves on your charts with their potential associated targets.
█ CONCEPTS
Disclaimer
MATHR3E RETRACEMENTS indicator is intended for advanced traders and may fit your profile, whether you are a day trader or a long-term investor.
It was originally developed by a renowned market analyst and documented in numerous books. Among them is the author Jason Perl.
It is recommended to have read the trading techniques mentioned in the books covering this indicator beforehand.
How to use:
MATHR3E WAVES indicator can provide a roadmap of market direction that you can use to determine price targets and isolate exhaustion points from potential trends in conjunction with other indicators by the same author.
Be aware the indicator's approach is derived from the Elliott wave theory and may slightly diverge from the cardinal rules of Elliott waves.
Principle of the Elliott Wave Theory
Movement in the direction of the trend is unfolding in 5 waves (called motive wave) while any correction against the trend is in three waves (called corrective wave). The movement in the direction of the trend is labeled as 1, 2, 3, 4, and 5. The three-wave correction is labeled as a, b, and c. These patterns can be seen in the long term as well as short term charts.
Wave 1:
Wave one is rarely obvious at its inception. When the first wave of a new bull market begins, the fundamental news is almost universally negative. The previous trend is considered still strongly in force. Fundamental analysts continue to revise their earnings estimates lower; the economy probably does not look strong. Sentiment surveys are decidedly bearish, put options are in vogue, and implied volatility in the options market is high. Volume might increase a bit as prices rise, but not by enough to alert many technical analysts.
Wave 2:
Wave two corrects wave one, but can never extend beyond the starting point of wave one. Typically, the news is still bad. As prices retest the prior low, bearish sentiment quickly builds, and "the crowd" haughtily reminds all that the bear market is still deeply ensconced. Still, some positive signs appear for those who are looking: volume should be lower during wave two than during wave one, prices usually do not retrace more than 61.8% of the wave one gains, and prices should fall in a three-wave pattern.
Wave 3:
Wave three is usually the largest and most powerful wave in a trend. The news is now positive and fundamental analysts start to raise earnings estimates. Prices rise quickly, corrections are short-lived and shallow. Anyone looking to "get in on a pullback" will likely miss the boat. As wave three starts, the news is probably still bearish, and most market players remain negative; but by wave three's midpoint, "the crowd" will often join the new bullish trend. Wave three often extends wave one by a ratio of 1.618:1.
Wave 4:
Wave four is typically clearly corrective. Prices may meander sideways for an extended period, and wave four typically retraces less than 38.2% of wave three. Volume is well below that of wave three. This is a good place to buy a pullback if you understand the potential ahead for wave 5. Still, fourth waves are often frustrating because of their lack of progress in the larger trend.
Wave 5:
Wave five is the final leg in the direction of the dominant trend. The news is almost universally positive and everyone is bullish. Unfortunately, this is when many average investors finally buy-in, right before the top. Volume is often lower in wave five than in wave three, and many momentum indicators start to show divergences (prices reach a new high but the indicators do not reach a new peak).
Wave A:
Corrections are typically harder to identify than impulse moves. In wave A of a bear market, the fundamental news is usually still positive. Most analysts see the drop as a correction in a still-active bull market. Some technical indicators that accompany wave A include increased volume, rising implied volatility in the options markets, and possibly a turn higher in open interest in related futures markets.
Wave B:
Prices reverse higher, which many see as a resumption of the now long-gone bull market. Those familiar with classical technical analysis may see the peak as the right shoulder of a head and shoulders reversal pattern. The volume during wave B should be lower than in wave A. By this point, fundamentals are probably no longer improving, but they most likely have not yet turned negative.
Wave C:
Prices move impulsively lower in five waves. Volume picks up, and by the third leg of wave C, almost everyone realizes that a bear market is firmly entrenched. Wave C is typically at least as large as wave A and often extends to 1.618 times wave A or beyond.
█ FEATURES & BENEFITS
Versatile
The indicator works on relative price action, so you can apply it without having to change any of the default settings.
Targets:
Customize the high and low wave targets to identify possible price target areas.
Adjustable Rules:
• Shift Wave 2: if Wave 4 closes below the low close of Wave 2.
• Shift Wave 4: if Wave A closes below the low close of Wave 4.
• Allow Wave 4 to overlap Wave 1
• Allow truncated Wave 5
• Allow truncated Wave C
Price ratio:
Force waves 2/4 to retrace to a specific Fibonacci level.
Force Waves 3/5 size to a specific Fibonacci level.
Time Ratio:
Force selected waves to last a required number of bars.
Alerts:
Set up your alerts and receive notifications on wave completion.
Alerts format can be adapted to be received on Discord servers.
SPX Expected MoveThis indicator plots the "expected move" of SPX for today's trading session. Expected move is the amount that SPX is predicted to increase or decrease from its current price, based on the current level of implied volatility. The implied volatility in this indicator is computed from the current value of the VIX (or one of several volatility symbols available on Trading view). The computation is done using standard formula. The resulting plots are labeled as 1 and 2 standard deviations. The default values are to use VIX as well as 252 trading days in the years.
Use the square root of (days to expiration, or in this case a fraction of the day remaining) divided but the square root of (252, or number of trading days in a year).
timeRemaining = math.sqrt(DTE) / math.sqrt(252)
Standard deviation move = SPX bar closing price * (VIX/100) * timeRemaining

4C Expected Move (Weekly Options)This indicator plots the Expected Move (EM) calculated from weekly options pricing, for a quick visual reference.
The EM is the amount that a stock is predicted to increase or decrease from its current price, based on the current level of implied volatility.
This range can be viewed as support and resistance, or once price gets outside of the range, institutional hedging actions can accelerate the move in that direction.
The EM range is based on the Weekly close of the prior week.
It can be useful to know what the weekly EM range is for a stock to understand the probabilities of the overall distance, direction and volatility for the week.
To use this indicator you must have access to a broker with options data (not available on Tradingview).
Look at the stock's option chain and find the weekly expected move. You will have to do your own research to find where this information is displayed depending on your broker.
See screenshot example on the chart. This is the Thinkorswim platform's option chain, and the Implied Volatility % and the calculated EM is circled in red. Use the +- number in parentheses, NOT the % value.
Input that number into the indicator on a weekly basis, ideally on the weekend sometime after the cash market close on Friday, and before the Market open at the beginning of the trading week.
The indicator must be manually updated each week.
It will automatically start over at the beginning of the week.

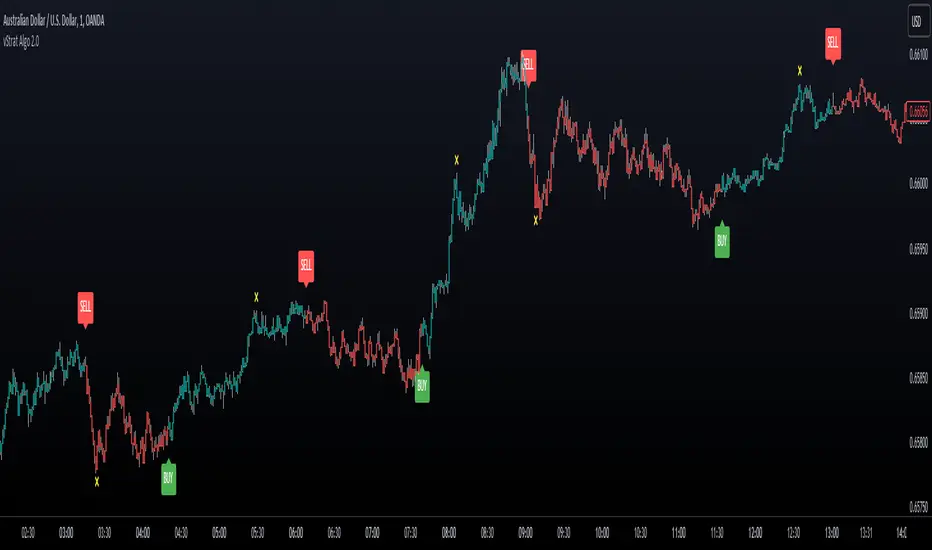
vStrat Algo 2.0vStrat Algo 2.0 is a Non-Repainting toolkit that works on any market such as stocks, crypto, forex, indices, commodities, etc. There are 8 advanced features that traders can use to help them create their own strategies. vStrat Algo 2.0 offers 10 sensitivity presets that they can choose from, making this toolkit suitable for every trading style whether it's scalping, day trading, swinging, or position trading.
I. Non-Repainting
When an indicator is Repainting , it changes its values as new data arrives, making it an unreliable indicator especially for Buy and Sell signals but this does not necessarily mean that the indicator is less accurate. vStrat Algo 2.0 does not repaint so the signals that were triggered in real time will stay the same during backtesting. If Non-Repainting is disabled, the signal that was triggered on a candle might disappear as new data arrives and once that candle closes, the signal might not even be there anymore, but it could get triggered on the next candle instead.
II. Signal Sensitivity
The Buy and Sell signals are highly accurate but the placement of each signal will differ for each selected preset. The higher the sensitivity (3.0 - 5.0), the more signals will be displayed on the chart. This setting works well when scalping using lower timeframes (1 min - 5 min). As the sensitivity lowers (0.5 - 2.5), less signals are displayed on the chart. If you are day trading or swinging, the lower presets are recommended as they are smoothed and will have less noise. Lower sensitivity works well on any timeframe.
III. Safe Mode
This feature hides any Buy and Sell signals that are triggered within the Consolidation Zones. The signals can still vary depending on the sensitivity, CZ Smoothing and CZ Length. The default setting is "3" and "7". "Unfiltered" must be unchecked for the signals to disappear.
IV. Unfiltered Signals
All Buy and Sell signals are displayed on the chart. This feature must be disabled if "Safe Mode" is enabled.
V. Trend Candle Colouring
This changes the bar colors depending on its trend. Green if it's trending up and red if it's trending down.
VI. Trend Cloud
Trend Cloud indicates the current market trend. This can also be used as a confluence to the Buy and Sell signals. Wider cloud indicates a strong momentum on either direction. As the cloud narrows, it could mean a possible reversal.
VII. Pivot Points
Pivot Points are useful for identifying significant support and resistance levels as well as identifying entry, exit, stop loss, and target profit levels.
VIII. Consolidation Zones
Consolidation Zones can be used to identify if the market is ranging. If enabled, it changes the colors of the bars that have low momentum to yellow. It is best to wait for a breakout to enter a trade but you can still be profitable when the market is ranging by trading based off Support and Resistance Levels and Imbalance Zones. Default setting is: Smoothing "3" and Length "7".
IX. Take Profit Levels
Take Profit signals are displayed on the chart as yellow "x". Once the algo detects a potential reversal, a Take Profit signal will be triggered so the user can lock in their profits. The signals can appear more than once so you have the option to keep holding as long as you know the risks. The lower the Length is, the more signals appear.
X. Alerts
Buy and Sell signal alerts can be created by clicking the three dots in the vStrat Algo 2.0 indicator tile.
Disclaimer:
All information found here, including any ideas, opinions, views, predictions, forecasts, commentaries, suggestions, or stock picks, expressed, or implied herein, are for informational, entertainment or educational purposes only and should not be construed as personal investment advice. While the information provided is believed to be accurate, it may include errors or inaccuracies. Conduct your own due diligence or consult a licensed financial advisor or broker before making any and all investment decisions. Any investments, trades, speculations, or decisions made on the basis of any information found on this site, expressed, or implied herein, are committed at your own risk, financial or otherwise.
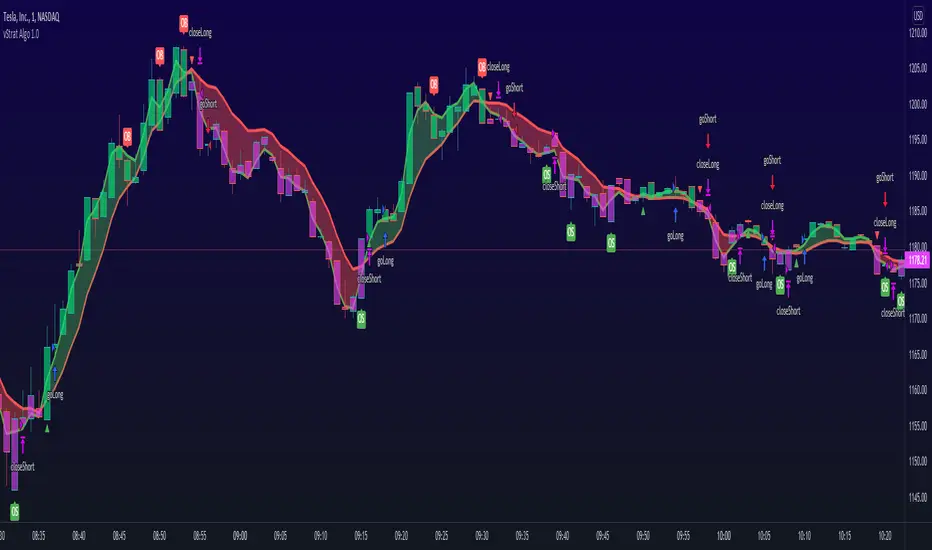
vStrat Algo 1.0 (BETA)vStrat Algo 1.0
The Very First Scalping/Intraday Trading Algo for Options
Note: If you have any favorite indicators that you use regularly and are helpful, feel free to use them in conjunction to this strategy.
Legend:
long = buy call
short = buy put
close entry = sell call/put
BULL = bullish engulfing
BEAR = bearish engulfing
OS = oversold
OB = overbought
Instructions:
1. You can choose to watch the 3 minute or 5 minute chart but be aware of the Pro’s and Con’s. It’s not recommended to use this strategy on the 1 minute chart, but this works on higher timeframes. Keep in mind that the signals will vary on each timeframe.
3 minute 5 minute
i.ibb.co i.ibb.co
2. It’s best to use this strategy right at market open. If a “long” (buy CALLS) or “short” (buy PUTS) signal was given at pre-market, I do not recommend taking it. Only take signals once the market opens. If you really wish to take the signal that was given 1-5 minutes before the market opened, you most definitely can, but its’s just riskier. What I would do is, wait 3-10 minutes after market open and if one Moving Average is respecting the other and holding above or below it, you can enter especially if the blow is bullish, the vStrat Algo 1.0 will also tell you if the candles are bearish or bullish. Use your best judgement.
i.ibb.co [
3. You do not have to wait for the exit signal, everyone's risk management is different so take profits whenever you're green or hold as long as the short-term MA is still trending above or below the long-term MA and is not touching or bouncing off it.
i.ibb.co
4. Avoid taking any signals from 11:30 AM ET - 2:30 PM ET, when stocks are trading sideways since the algo’s stop losses get triggered here due to the low volume.
i.ibb.co
5. Lastly, there is no magic indicator or strategy, this algorithm is designed based on multiple conditions. Each signal gets triggered when ALL the conditions are met. This strategy is based off advanced moving averages, one that reduces lag and responds quicker than the simple and exponential ones, RSI value, S/R, pivot points, and a few others. I’m always looking for ways to improve this scalping algorithm so rest assured any complaints or suggestions will be taken and fixed as timely as possible. For best results, avoid trading with your emotions. If you’re a new user, open a small position, set a stop loss, and let the algorithm decide how you will trade it for that day. Keep doing this until you get more familiar with the script then slowly increase your position sizing, but do not invest money you can’t afford to lose. Play with the settings, change the lengths if you wish, but the script was created to provide the most accurate signals as it is. If you do decide to change these inputs, the signals will also be different. Take profits whenever you see fit, the goal is to have a green day and grow your account slowly but surely. If you make a profit, do not risk giving your money back to the market by overtrading. Always do your own due diligence and use your best judgement. Good luck, Traders!
DISCLAIMER : All information found here, including any ideas, opinions, views, predictions, forecasts, commentaries, suggestions, or stock picks, expressed, or implied herein, are for informational, entertainment or educational purposes only and should not be construed as personal investment advice. While the information provided is believed to be accurate, it may include errors or inaccuracies. Conduct your own due diligence or consult a licensed financial advisor or broker before making any and all investment decisions. Any investments, trades, speculations, or decisions made on the basis of any information found on this site, expressed, or implied herein, are committed at your own risk, financial or otherwise.
Multi-Market Swing Trader Webhook Ready [HullBuster]
Introduction
This is an all symbol swing trading strategy intended for webhook integration to live accounts. This script employs an adjustable bandwidth ping pong algorithm which can be run in long only, short only or bidirectional modes. Additionally, this script provides advanced features such as pyramiding and DCA. It has been in development for nearly three years and exposes over 90 inputs to accommodate varying risk reward ratios. Equipped with a proper configuration it is suitable for professional traders seeking quality trades from a cloud based platform. This is my most advanced Pine Script to date which combines my RangeV3 and TrendV2 scripts. Using this combination it tries to bridge the gap between range bound and trending markets. I have put a lot of time into creating a system that could transition by itself so as to require less human intervention and thus be able to withstand long periods in full automation mode.
As a Pine strategy, hypothetical performance can be easily back-tested. Allowing you to Iron out the configuration of your target instrument. Now with recent advancements from the Pine development team this same script can be connected to a webhook through the alert mechanism. The requirement of a separate study script has been completely removed. This really makes things a lot easier to get your trading system up and running. I would like to also mention that TradingView has made significant advancements to the back-end over the last year. Notably, compile times are much faster now permitting more complex algorithms to be implemented. Thank you TradingView!
I used QuantConnect as my role model and strived to produce a base script which could compete with higher end cloud based platforms while being attractive to similarly experienced traders. The versatility of the Pine Language combined with the greater selection of end point execution systems provides a powerful alternative to other cloud based platforms. At the very least, with the features available today, a modular trading system for everyday use is a reality. I hope you'll agree.
This is a swing trading strategy so the behavior of this script is to buy on weakness and sell on strength. In trading parlance this is referred to as Support and Resistance Trading. Support being the point at which prices stop falling and start rising. Resistance being the point at which prices stop rising and fall. The chart real estate between these two points being defined as the range. This script seeks to implement strategies to profit from placing trades within this region. Short positions at resistance and long positions at support. Just to be clear, the range as well as trends are merely illusions as the chart only receives prices. However, this script attempts to calculate pivot points from the price stream. Rising pivots are shorts and falling pivots are longs. I refer to pivots as a vertex in this script which adds structural components to the chart formation (point, sides and a base). When trading in “Ping Pong” mode long and short positions are interleaved continuously as long as there exists a detectable vertex.
This is a non-hedging script so those of us subject to NFA FIFO Rule 2-43(b) should be generally safe to webhook into signals emitted from this script. However, as covered later in this document, there are some technical limitations to this statement. I have tested this script on various instruments for over two years and have configurations for forex, crypto and stocks. This script along with my TrendV2 script are my daily trading vehicles as a webhook into my forex and crypto accounts. This script employs various high risk features that could wipe out your account if not used judiciously. You should absolutely not use this script if you are a beginner or looking for a get-rich-quick strategy. Also please see my CFTC RULE 4.41 disclosure statement at the end of the document. Really!
Does this script repaint? The short answer is yes, it does, despite my best efforts to the contrary. EMAs are central to my strategy and TradingView calculates from the beginning of the series so there is just no getting around this. However, Pine is improving everyday and I am hopeful that this issue will be address from an architectural level at some point in the future. I have programmed my webhook to compensate for this occurrence so, in the mean time, this my recommended way to handle it (at the endpoint and before the broker).
Design
This strategy uses a ping pong algorithm of my own design. Basically, trades bounce off each other along the price stream. Trades are produced as a series of reversals. The point at which a trade reverses is a pivot calculation. A measurement is made between the recent valley to peak which results in a standard deviation value. This value is an input to implied probability calculation.Yes, the same implied probability used in sports betting. Odds are then calculated to determine the likelihood of price action continuing or retracing to the pivot. Based on where the account is at alert time, the action could be an entry, take profit or pyramid signal. In this design, trades must occur in alternating sequence. A long followed by a short then another long followed by a short and so on. In range bound price action trades appear along the outer bands of the channel in the aforementioned sequence. Shorts on the top and longs at the bottom. Generally speaking, the widths of the trading bands can be adjusted using the vertex dynamics in Section 2. There are a dozen inputs in this section used to describe the trading range. It is not a simple adjustment. If pyramids are enabled the strategy overrides the ping pong reversal pattern and begins an accumulation sequence. In this case you will see a series of same direction trades.
This script uses twelve indicators on a single time frame. The original trading algorithms are a port from a C++ program on proprietary trading platform. I’ve converted some of the statistical functions to use standard indicators available on TradingView. The setups make heavy use of the Hull Moving Average in conjunction with EMAs that form the Bill Williams Alligator as described in his book “New Trading Dimensions” Chapter 3. Lag between the Hull and the EMAs play a key role in identifying the pivot points. I really like the Hull Moving Average. I use it in all my systems, including 3 other platforms. It’s is an excellent leading indicator and a relatively light calculation.
The trend detection algorithms rely on several factors:
1. Smoothed EMAs in a Willams Alligator pattern.
2. Number of pivots encountered in a particular direction.
3. Which side debt is being incurred.
4. Settings in Section 4 and 5 (long and short)
The strategy uses these factors to determine the probability of prices continuing in the most recent direction. My TrendV2 script uses a higher time frame to determine trend direction. I can’t use that method in this script without exceeding various TradingView limitations on code size. However, the higher time frame is the best way to know which trend is worth pursuing or better to bet against.
The entire script is around 2400 lines of Pine code which pushes the limits of what can be created on this platform given the TradingView maximums for: local scopes, run-time duration and compile time. The module has been through numerous refactoring passes and makes extensive use of ternary statements. As such, It takes a full minute to compile after adding it to a chart. Please wait for the hovering dots to disappear before attempting to bring up the input dialog box. Scrolling the chart quickly may bring up an hour glass.
Regardless of the market conditions: range or trend. The behavior of the script is governed entirely by the 91 inputs. Depending on the settings, bar interval and symbol, you can configure a system to trade in small ranges producing a thousand or more trades. If you prefer wider ranges with fewer trades then the vertex detection settings in Section 2 should employ stiffer values. To make the script more of a trend follower, adjustments are available in Section 4 and 5 (long and short respectively). Overall this script is a range trader and the setups want to get in that way. It cannot be made into a full blown trend trading system. My TrendV2 is equipped for that purpose. Conversely, this script cannot be effectively deployed as a scalper either. The vertex calculation require too much data for high frequency trading. That doesn’t work well for retail customers anyway. The script is designed to function in bar intervals between 5 minutes and 4 hours. However, larger intervals require more backtest data in order to create reliable configurations. TradingView paid plans (Pro) only provide 10K bars which may not be sufficient. Please keep that in mind.
The transition from swing trader to trend follower typically happens after a stop is hit. That means that your account experiences a loss first and usually with a pyramid stack so the loss could be significant. Even then the script continues to alternate trades long and short. The difference is that the strategy tries to be more long on rising prices and more short on falling prices as opposed to simply counter trend trading. Otherwise, a continuous period of rising prices results in a distinctly short pyramid stack. This is much different than my TrendV2 script which stays long on peaks and short on valleys. Basically, the plan is to be profitable in range bound markets and just lose less when a trend comes along. How well this actually plays out will depend largely on the choices made in the sectioned input parameters.
Sections
The input dialog for this script contains 91 inputs separated into six sections.
Section 1: Global settings for the strategy including calculation model, trading direction, exit levels, pyramid and DCA settings. This is where you specify your minimum profit and stop levels. You should setup your Properties tab inputs before working on any of the sections. It’s really important to get the Base Currency right before doing any work on the strategy inputs. It is important to understand that the “Minimum Profit” and “Limit Offset” are conditional exits. To exit at a profit, the specified value must be exceeded during positive price pressure. On the other hand, the “Stop Offset” is a hard limit.
Section 2: Vertex dynamics. The script is equipped with four types of pivot point indicators. Histogram, candle, fractal and transform. Despite how the chart visuals may seem. The chart only receives prices. It’s up to the strategy to interpret patterns from the number stream. The quality of the feed and the symbol’s bar characteristics vary greatly from instrument to instrument. Each indicator uses a fundamentally different pattern recognition algorithm. Use trial and error to determine the best fit for your configuration. After selecting an indicator type, there are eight analog fields that must be configured for that particular indicator. This is the hardest part of the configuration process. The values applied to these fields determine how the range will be measured. They have a big effect on the number of trades your system will generate. To see the vertices click on the “Show Markers” check box in this section. Red markers are long positions and blue markers are short. This will give you an idea of where trades will be placed in natural order.
Section 3: Event thresholds. Price spikes are used to enter and exit trades. The magnitude which define these spikes are configured here. The rise and fall events are primarily for pyramid placement. The rise and fall limits determine the exit threshold for the conditional “Limit Offset” field found in Section 1. These fields should be adjusted one at a time. Use a zero value to disengage every one but the one you are working on. Use the fill colors found in Section 6 to get a visual on the values applied to these fields. To make it harder for pyramids to enter stiffen the Event values. This is more of a hack as the formal pyramid parameters are in Section 1.
Section 4 and 5: Long and short settings. These are mirror opposite settings with all opposing fields having the same meaning. Its really easy to introduce data mining bias into your configuration through these fields. You must combat against this tendency by trying to keep your settings as uniform as possible. Wildly different parameters for long and short means you have probably fitted the chart. There are nine analog and thirteen Boolean fields per trade direction. This section is all about how the trades themselves will be placed along the range defined in Section 2. Generally speaking, more restrictive settings will result in less trades but higher quality. Remember that this strategy will enter long on falling prices and short on rising prices. So getting in the trade too early leads to a draw-down. However, this could be what you want if pyramiding is enabled. I, personally, have found that the best configurations come from slightly skewing one side. I just accept that the other side will be sub-par.
Section 6: Chart rendering. This section contains one analog and four Boolean fields. More or less a diagnostic tool. Of particular interest is the “Symbol Debt Sequence” field. This field contains a whole number which paints regions that have sustained a run of bad trades equal or greater than specified value. It is useful when DCA is enabled. In this script Dollar Cost Averaging on new positions continues only until the symbol debt is recouped. To get a better understanding on how this works put a number in this field and activate DCA. You should notice how the trade size increases in the colored regions. The “Summary Report” checkbox displays a blue information box at the live end of the chart. It exposes several metrics which you may find useful if manually trading this strategy from audible alerts or text messages.
Pyramids
This script features a downward pyramiding strategy which increases your position size on losing trades. On purely margin trades, this feature can be used to, hypothetically, increase the profit factor of positions (not individual trades). On long only markets, such as crypto, you can use this feature to accumulate coins at depressed prices. The way it works is the stop offset, applied in the Section 1 inputs, determines the maximum risk you intend to bear. Additional trades will be placed at pivot points calculated all the way down to the stop price. The size of each add on trade is increased by a multiple of its interval. The maximum number of intervals is limited by the “Pyramiding” field in the properties tab. The rate at which pyramid positions are created can be adjusted in Section 1. To see the pyramids click on the “Mark Pyramid Levels” check box in the same section. Blue triangles are painted below trades other than the primary.
Unlike traditional Martingale strategies, the result of your trade is not dependent on the profit or loss from the last trade. The position must recover the R1 point in order to close. Alternatively, you can set a “Pyramid Bale Out Offset” in Section 1 which will terminate the trade early. However, the bale out must coincide with a pivot point and result in a profitable exit in order to actually close the trade. Should the market price exceed the stop offset set in Section 1, the full value of the position, multiplied by the accepted leverage, will be realized as a loss to the trading account. A series of such losses will certainly wipe out your account.
Pyramiding is an advanced feature intended for professional traders with well funded accounts and an appropriate mindset. The availability of this feature is not intended to endorse or promote my use of it. Use at your own risk (peril).
DCA
In addition to pyramiding this script employs DCA which enables users to experiment with loss recovery techniques. This is another advanced feature which can increase the order size on new trades in response to stopped out or winning streak trades. The script keeps track of debt incurred from losing trades. When the debt is recovered the order size returns to the base amount specified in the properties tab. The inputs for this feature are found in section 3 and include a limiter to prevent your account from depleting capital during runaway markets. The main difference between DCA and pyramids is that this implementation of DCA applies to new trades while pyramids affect open positions. DCA is a popular feature in crypto trading but can leave you with large “bags” if your not careful. In other markets, especially margin trading, you’ll need a well funded account and much experience.
To be sure pyramiding and dollar cost averaging is as close to gambling as you can get in respectable trading exchanges. However, if you are looking to compete in a spot trading contest or just want to add excitement to your trading life style those features could find a place in your strategies. Although your backtest may show spectacular gains don’t expect your live trading account to do the same. Every backtest has some measure of data mining bias. Please remember that.
Webhook Integration
The TradingView alerts dialog provides a way to connect your script to an external system which could actually execute your trade. This is a fantastic feature that enables you to separate the data feed and technical analysis from the execution and reporting systems. Using this feature it is possible to create a fully automated trading system entirely on the cloud. Of course, there is some work to get it all going in a reliable fashion. To that end this script has several things going for it. First off, it is a strategy type script. That means that the strategy place holders such as {{strategy.position_size}} can be embedded in the alert message text. There are more than 10 variables which can write internal script values into the message for delivery to the specified endpoint. Additionally, my scripts output the current win streak and debt loss counts in the {{strategy.order.alert_message}} field. Depending on the condition, this script will output other useful values in the JSON “comment” field of the alert message. Here is an excerpt of the fields I use in my webhook signal:
"broker_id": "kraken",
"account_id": "XXX XXXX XXXX XXXX",
"symbol_id": "XMRUSD",
"action": "{{strategy.order.action}}",
"strategy": "{{strategy.order.id}}",
"lots": "{{strategy.order.contracts}}",
"price": "{{strategy.order.price}}",
"comment": "{{strategy.order.alert_message}}",
"timestamp": "{{time}}"
Though TradingView does a great job in dispatching your alert this feature does come with a few idiosyncrasies. Namely, a single transaction call in your script may cause multiple transmissions to the endpoint. If you are using placeholders each message describes part of the transaction sequence. A good example is closing a pyramid stack. Although the script makes a single strategy.close() call, the endpoint actually receives a close message for each pyramid trade. The broker, on the other hand, only requires a single close. The incongruity of this situation is exacerbated by the possibility of messages being received out of sequence. Depending on the type of order designated in the message, a close or a reversal. This could have a disastrous effect on your live account. This broker simulator has no idea what is actually going on at your real account. Its just doing the job of running the simulation and sending out the computed results. If your TradingView simulation falls out of alignment with the actual trading account lots of really bad things could happen. Like your script thinks your are currently long but the account is actually short. Reversals from this point forward will always be wrong with no one the wiser. Human intervention will be required to restore congruence. But how does anyone find out this is occurring? In closed systems engineering this is known as entropy. In practice your webhook logic should be robust enough to detect these conditions. Be generous with the placeholder usage and give the webhook code plenty of information to compare states. Both issuer and receiver. Don’t blindly commit incoming signals without verifying system integrity.
Operation
This is a swing trading strategy so the fundamental behavior of this script is to buy on weakness and sell on strength. As such trade orders are placed in a counter direction to price pressure. What you will see on the chart is a short position on peaks and a long position on valleys. This is slightly misleading since a range as well as a trend are best recognized, in hindsight, after the patterns occur on the chart. In the middle of a trade, one never knows how deep valleys will drop or how high peaks will rise. For certain, long trades will continue to trigger as the market prices fall and short trades on rising prices. This means that the maximum efficiency of this strategy is achieved in choppy markets where the price doesn’t extend very far from its adjacent pivot point. Conversely, this strategy will be the least efficient when market conditions exhibit long continuous single direction price pressure. Especially, when measured in weeks. Translation, the trend is not your friend with this strategy. Internally, the script attempts to recognize prolonged price pressure and changes tactics accordingly. However, at best, the goal is to weather the trend until the range bound market returns. At worst, trend detection fails and pyramid trades continue to be placed until the limit specified in the Properties tab is reached. In all likelihood this could trigger a margin call and if it hits the stop it could wipe out your account.
This script has been in beta test four times since inception. During all that time no one has been successful in creating a configuration from scratch. Most people give up after an hour or so. To be perfectly honest, the configuration process is a bear. I know that but there is no way, currently, to create libraries in Pine. There is also no way specify input parameters other than the flattened out 2-D inputs dialog. And the publish rules clearly state that script variations addressing markets or symbols (suites) are not permitted. I suppose the problem is systemic to be-all-end-all solutions like my script is trying to be. I needed a cloud strategy for all the symbols that I trade and since Pine does not support library modules, include files or inter process communication this script and its unruly inputs are my weapon of choice in the war against the market forces. It takes me about six hours to configure a new symbol. Also not all the symbols I configure are equally successful. I should mention that I have a facsimile of this strategy written in another platform which allows me to run a backtest on 10 years of historical data. The results provide me a sanity check on the inputs I select on this platform.
My personal configurations use a 10 minute bar interval on forex instruments and 15 minutes on crypto. I try to align my TradingView scripts to employ standard intervals available from the broker so that I can backtest longer durations than those available on TradingView. For example, Bitcoin at 15 minute bars is downloadable from several sources. I really like the 10 minute bar. It provides lots of detectable patterns and is easy to store many years in an SQL database.
The following steps provide a very brief set of instructions that will get you started but will most certainly not produce the best backtest. A trading system that you are willing to risk your hard earned capital will require a well crafted configuration that involves time, expertise and clearly defined goals. As previously mentioned, I have several example configurations that I use for my own trading that I can share with you if you like. To get hands on experience in setting up your own symbol from scratch please follow the steps below.
Step 1. Setup the Base currency and order size in the properties tab.
Step 2. Select the calculation presets in the Instrument Type field.
Step 3. Select “No Trade” in the Trading Mode field
Step 4. Select the Histogram indicator from Section 2. You will be experimenting with different ones so it doesn’t matter which one you try first.
Step 5. Turn on Show Markers in Section 2.
Step 6. Go to the chart and checkout where the markers show up. Blue is up and red is down. Long trades show up along the red markers and short trades on the blue.
Step 7. Make adjustments to “Base To Vertex” and “Vertex To Base” net change and ROC in Section 2. Use these fields to move the markers to where you want trades to be.
Step 8. Try a different indicator from Section 2 and repeat Step 7 until you find the best match for this instrument on this interval. This step is complete when the Vertex settings and indicator combination produce the most favorable results.
Step 9. Go to Section 4 and enable “Apply Red Base To Base Margin”.
Step 10. Go to Section 5 and enable “Apply Blue Base To Base Margin”.
Step 11. Go to Section 2 and adjust “Minimum Base To Base Blue” and “Minimum Base To Base Red”. Observe the chart and note where the markers move relative to each other. Markers further apart will produce less trades but will reduce cutoffs in “Ping Pong” mode.
Step 12. Turn off Show Markers in Section 2.
Step 13. Put in your Minimum Profit and Stop Loss in the first section. This is in pips or currency basis points (chart right side scale). Percentage is not currently supported. Note that the profit is taken as a conditional exit on a market order not a fixed limit. The actual profit taken will almost always be greater than the amount specified. The stop loss, on the other hand, is indeed a hard number which is executed by the TradingView broker simulator when the threshold is breached.
Step 14. Return to step 3 and select a Trading Mode (Long, Short, BiDir, Ping Pong). If you are planning to trade bidirectionally its best to configure long first then short. Combine them with “BiDir” or “Ping Pong” after setting up both sides of the trade individually. The difference between “BiDir” and “Ping Pong” is that “Ping Pong” uses position reversal and can cut off opposing trades less than the specified minimum profit. As a result “Ping Pong” mode produces the greatest number of trades.
Step 15. Take a look at the chart. Trades should be showing along the markers plotted earlier.
Step 16. Make adjustments to the Vertex fields in Section 2 until the TradingView performance report is showing a profit. This includes the “Minimum Base To Base” fields. If a profit cannot be achieved move on to Step 17.
Step 17. Improve the backtest profitability by adjusting the “Entry Net Change” and “Entry ROC” in Section 4 and 5.
Step 18. Enable the “Mandatory Snap” checkbox in Section 4 and 5 and adjust the “Snap Candle Delta” and “Snap Fractal Delta” in Section 2. This should reduce some chop producing unprofitable reversals.
Step 19. Increase the distance between opposing trades by adding an “Interleave Delta” in Sections 4 and 5. This is a floating point value which starts at 0.01 and typically does not exceed 2.0.
Step 20. Increase the distance between opposing trades even further by adding a “Decay Minimum Span” in Sections 4 and 5. This is an absolute value specified in the symbol’s quote currency (right side scale of the chart). This value is similar to the minimum profit and stop loss fields in Section 1.
Step 21. The “Buy Composite Strength” input works in tandem with “Long Decay Minimum Span” in Section 4. Try enabling and see if it improves the performance. This field is only relevant when there is a value in “Long Decay Minimum Span”.
Step 22. The “Sell Composite Weakness” input works in tandem with “Short Decay Minimum Span” in Section 5. Try enabling and see if it improves the performance. This field is only relevant when there is a value in “Short Decay Minimum Span”.
Step 23. Improve the backtest profitability by adjusting the “Adherence Delta” in Section 4 and 5. This field requires the “Adhere to Rising Trend” checkbox to be enabled.
Step 24. At this point your strategy should be more or less working. Experiment with the remaining check boxes in Section 4 and 5. Keep the ones which seem to improve the performance.
Step 25. Examine the chart and see that trades are being placed in accordance with your desired trading goals. This is an important step. If your desired model requires multiple trades per day then you should be seeing hundreds of trades on the chart. Alternatively, you may be looking to trade fewer steep peaks and deep valleys in which case you should see trades at major turning points. Don’t simply settle for what the backtest serves you. Work your configuration until the system aligns with your desired model. Try changing indicators and even intervals if you cannot reach your simulation goals. Generally speaking, the histogram and Candle indicators produce the most trades. The Fractal indicator captures the tallest peaks and valleys. The Transform indicator is the most reliable but doesn’t well work on all instruments.
Example Settings
To reproduce the performance shown on the chart please use the following configuration:
1. Select XBTUSD Kraken as the chart symbol.
2. On the properties tab set the Order Size to: 0.01 Bitcoin
3. On the properties tab set the Pyramiding to: 10
4. In Section 1: Select “Forex” for the Instrument Type
5. In Section 1: Select “Ping Pong” for the Trading Mode
6. In Section 1: Input 1200 for the Minimum Profit
7. In Section 1: Input 15000 for the Stop Offset
8. In Section 1: Input 1200 for the Pyramid Minimum Span
9. In Section 1: Check mark the Ultra Wide Pyramids
10. In Section 2: Check mark the Use Transform Indicator
So to be clear, I used a base position size of one - one hundredth of a Bitcoin and allow the script to add up to 10 downward pyramids. The example back-test did hit eight downward pyramids. That means the account would have to be able to withstand a base position size (0.01) times 28. The resulting position size is 0.28 of a Bitcoin. If the price of Bitcoin is 35K then the draw down amount (not including broker fees) would be $9800 dollars. Since I have a premium subscription my backtest chart includes 20K historical bars. That's roughly six months of data. As of today, pro accounts only get 10K bars so the performance cannot be exactly matched with such a difference in historical data. Please keep that in mind.
There are, of course, various ways to reduce the risk incurred from accumulating pyramids. You can increase the “Pyramid Minimum Span” input found in Section 2 which increases the space between each pyramid trade. Also you can set a “Pyramid Bale Out Offset” in the same input section. This lets you out of the trade faster on position recovery. For example: Set a value of 8000 into this input and the number of trades increase to 178 from 157. Since the positions didn’t go full term, more trades were created at less profit each. The total brute force approach would be to simply limit the number of pyramids in the Properties tab.
It should be noted that since this is crypto, accumulating on the long side may be what you want. If you are not trading on margin and thus outright buying coins on the Kraken exchange you likely are interested in increasing your Bitcoin position at depressed prices. This is a popular feature on some of the other crypto trading packages like CryptoHopper and Profit Trailer. Click on Enable TV Long Only Rule in Section 1. This switches the signal emitter to long only. However, you may still see short trades on the chart. They are treated as a close instead of a reversal.
Feel free to PM me with any questions related to this script. Thank you and happy trading!
CFTC RULE 4.41
These results are based on simulated or hypothetical performance results that have certain inherent limitations. Unlike the results shown in an actual performance record, these results do not represent actual trading. Also, because these trades have not actually been executed, these results may have under-or over-compensated for the impact, if any, of certain market factors, such as lack of liquidity. Simulated or hypothetical trading programs in general are also subject to the fact that they are designed with the benefit of hindsight. No representation is being made that any account will or is likely to achieve profits or losses similar to these being shown.

Volatility barometerIt is the indicator that analyzes the behaviour of VIX against CBOE volaility indices (VIX3M, VIX6M and VIX1Y) and VIX futures (next contract to the front one - VX!2). Because VIX is a derivate of SPX, the indicator shall be used on the SPX chart (or equivalent like SPY).
When the readings get above 90 / below 10, it means the market is overbought / oversold in terms of implied volatility. However, it does not mean it will reverse - if the price go higher along with the indicator readings then everything is fine. There is an alarming situation when the SPX is diverging - e.g. the price go higher, the readings lower. It means the SPX does not play in the same team as IVOL anymore and might reverse.
You can use it in conjunction with other implied volatility indicators for stronger signals: the Correlation overlay ( - the indicator that measures the correlation between VVIX and VIX) and VVIX/VIX ratio (it generates a signal the ratio makes 50wk high).

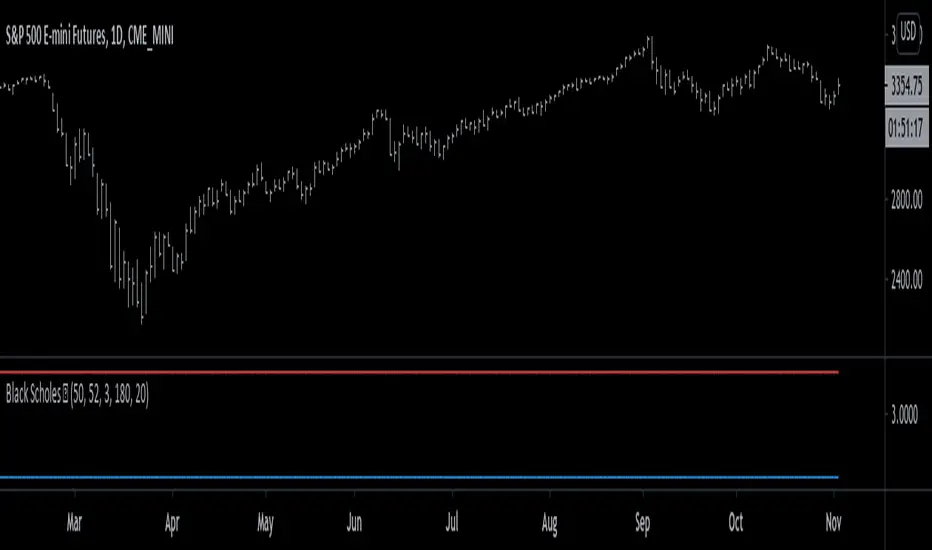
Black Scholes Model [racer8]This is the Black Scholes Model. This indicator tells you the prices of both a call option & a put option.
Input variables are spot price, strike price, risk free rate %, days to maturity, and implied volatility %.
This indicator was made generally for educational purposes.
By using this indicator, you will develop a better understanding of how options are priced.
This indicator was made to be as simple as possible so that the user can easily understand it.
I recreated the Black Scholes Model because there is very little scripts on TV that are based on the Black Scholes Model.
I am aware that are Black Scholes Model (BSM) scripts already on TV, but mine is not the same. Correct me if I'm wrong, but I don't think there is a BSM script out there yet that relies on the exact same inputs that mine does.
Why use this indicator?
If you don't already have your own IV indicator...
You can use this indicator to approximate the value of implied volatility %.
You already know every input variable except IV%, and you know the call & put option prices.
So put in the numbers for each input and put a random number between 0 to 100 into the IV% input to get the options prices.
Adjust that random number for IV% until the output (options prices) matches correctly with what you already know they are to be.
This is called the trial and error method.
On the other hand, if you already know all input variables including IV%. Then you can use this indicator to find the call & put options prices directly.
Hope this helps. Enjoy 🙂
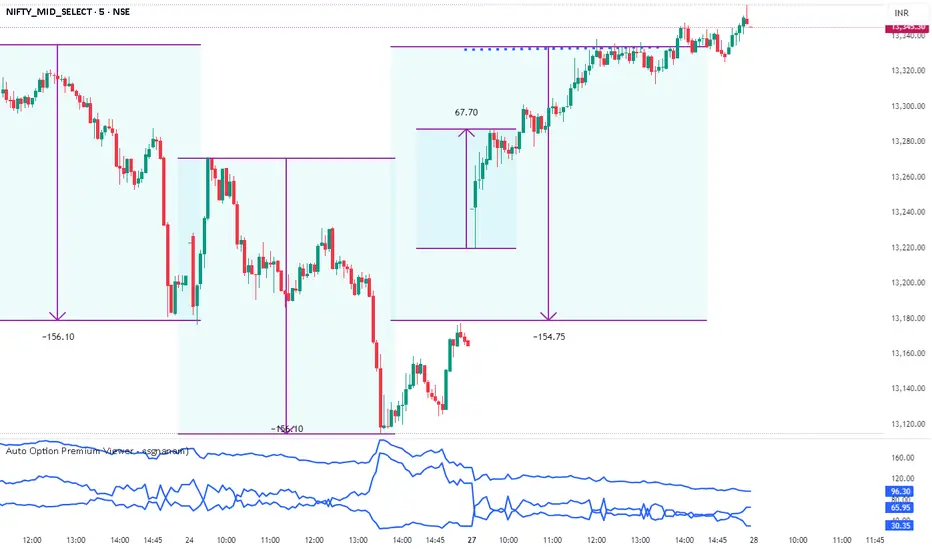
Auto Option Premium Viewer - csgnanamThat's a great idea! Clear documentation is key for anyone using your script. Since your selected code block is the dedicated space for documentation, I'll provide an explanation tailored for that context, covering the main features of your "Auto Option Premium Viewer" Canvas.
Here is a detailed explanation of the script's core functionality, which you can use in your Canvas description or in a separate document to help users understand it.
I will not edit the Canvas itself, as you requested a separate explanation.
***
### Explanation of the "Auto Option Premium Viewer" Canvas
This Pine Script indicator, **"Auto Option Premium Viewer — Full Auto Symbols (NSE format, improved detection),"** is designed to automatically fetch and display the At-The-Money (ATM) Call and Put option premiums for major NSE indices (NIFTY, BANKNIFTY, MIDCPNIFTY, FINNIFTY) in real-time.
The primary goal is to provide a single, clean chart overlay showing the total premium (CE + PE) for the options closest to the current spot price, without requiring the user to manually enter strike prices or steps.
#### 1. Automatic Index Detection (`AUTO` Functionality)
* **Smart Underlying Detection:** The script attempts to automatically detect the index you are currently viewing (`activeUnderlying`). For example, if your chart is set to `BANKNIFTY`, the indicator automatically focuses on Bank Nifty options.
* **Spot Ticker Mapping (The Fix):** To accurately find the spot price, the script uses a helper function (`getSpotTicker`) to map the common index name (like `FINNIFTY`) to the specific underlying ticker required by TradingView (like `CNXFINANCE` or `NIFTY_MID_SELECT`). This ensures accurate price referencing for ATM calculation across all indices.
#### 2. Fully Automated Strike & Step Sizing
* **No Base Strike Inputs:** The script dynamically calculates the At-The-Money (ATM) strike price based on the live spot price of the underlying index.
* **Fixed Strike Steps:** The strike increment (`current_step`) is hardcoded based on market conventions:
* **100:** NIFTY, BANKNIFTY, FINNIFTY
* **50:** MIDCPNIFTY
* **Dynamic ATM Calculation:** The live spot price is rounded to the nearest valid strike based on the correct step size. This automatically determines the central strike (B), along with the adjacent strikes (A and C) to ensure the fetched data is always relevant.
#### 3. Data Fetching and Display
* **Symbol Construction:** The `buildSymbol` function creates the exact NSE option symbol string (e.g., `NSE:NIFTY251028C26000`) required by the `request.security` function.
* **Option Price Request:** The script uses `request.security` to fetch the closing price (`close`) of the Call and Put options for the three relevant strikes (A, B, C) on a fixed **5-minute** timeframe (`dataTF`).
* **Plots:** The indicator displays three lines on the chart's lower panel:
1. **ATM CE Premium:** The price of the Call option closest to ATM.
2. **ATM PE Premium:** The price of the Put option closest to ATM.
3. **ATM Total Premium:** The sum of CE + PE, often used as a proxy for the minimum expected range or implied volatility.
This automatic setup makes the Canvas extremely efficient for quick analysis without needing to manually adjust any numerical settings.
VIX Implied move on ESCalculated the moves based on VIX and draws horizontal lines on ES. Best timeframe to start is 18 hrs.
GAMMA REGIME PROXYProxy to calculate gamma regime based on implied volatility
A short gamma regime can enhance the probabilities to have a breakout with a trend
A long gamma regime can enhance the probabilities to see reversal

OSOK AMERICANA [TakingProphets]OVERVIEW
OSOK is an ICT-inspired execution framework designed to help traders map the interaction between Higher-Timeframe (HTF) liquidity sweeps, qualifying Order Blocks, and Current-Timeframe (CTF) confirmation signals — all within a single, structured workflow.
By sequencing an HTF CRT → Order Block → CTF CRT model and integrating IPDA 20 equilibrium context, this tool provides traders with a visual framework for aligning intraday execution decisions with higher-timeframe intent. All plotted elements — sweeps, blocks, open prices, and equilibrium levels — update continuously in real time.
-----------------------------------------------------------------------------------------------
Core Concepts (ICT-Based)
-----------------------------------------------------------------------------------------------
Candle Range Transition (CRT) Sweeps
Bullish CRT → The second candle runs below the first candle’s low and closes back inside its range.
Bearish CRT → The second candle runs above the first candle’s high and closes back inside its range.
These patterns are frequently associated with liquidity grabs and potential directional shifts.
HTF → CTF Alignment
-Detects valid HTF CRTs (e.g., Daily CRTs derived from H4 or Weekly CRTs derived from Daily).
-Locates a qualifying Order Block within HTF Candle-2 to identify areas of potential interest.
-Waits for a modified CRT confirmation on the current timeframe before signaling possible directional bias.
IPDA 20 Equilibrium
-Plots the midpoint of the daily highest and lowest prices over the last 20 periods.
-Provides a visual reference for premium and discount pricing zones.
-----------------------------------------------------------------------------------------------
How OSOK Works
-----------------------------------------------------------------------------------------------
Step 1 — HTF CRT Check
On each new HTF candle, the script scans for a clean CRT formation on the higher aggregation (e.g., H4 → D or D → W).
If found, it tags the candles as C1, C2, and C3 and optionally shades their backgrounds for clear visual parsing.
Step 2 — HTF Order Block Identification
Searches within HTF Candle-2 for a qualifying Order Block using a compact pattern filter.
Draws a persistent OB level with clear labeling for context.
Step 3 — CTF Confirmation (Modified CRT)
Monitors your current chart timeframe for a modified CRT in alignment with the HTF setup:
For bullish setups → waits for a bullish modified CRT and close above C1’s high zone.
For bearish setups → expects a bearish modified CRT and close below C1’s low zone.
Step 4 — Real-Time Maintenance
All labels, lines, and background spans update intrabar.
If the setup invalidates — for example, if implied targets are exceeded before entry — the layout resets and waits for the next valid sequence.
-----------------------------------------------------------------------------------------------
KEY FEATURES
-----------------------------------------------------------------------------------------------
HTF CRT Visualization
-Optional “×” markers on Daily/Weekly CRT sweeps.
-Independent background shading for C1, C2, and C3.
Order Block + Open Price Context
-Draws HTF Order Block levels and plots C3 Open Price (DOP) for additional directional reference.
CTF CRT Execution Cue
-Displays a modified CRT on your current timeframe when conditions align with the HTF narrative.
IPDA 20 Line + Label
-Plots a dynamic midpoint level with an optional label for quick premium/discount context.
Optimized Drawing Engine
-Lightweight, efficient use of chart objects ensures smooth performance without visual clutter.
INPUTS
-Higher Timeframe Settings
-Toggle markers for Daily/Weekly CRT sweeps.
-Enable and color C1, C2, and C3 background spans.
-IPDA Display Options
-Control visibility, color, and line style for IPDA 20 equilibrium levels.
-Sweep, OB, and Open Price Styles
-Per-element customization for colors, widths, and labels.
-----------------------------------------------------------------------------------------------
BEST PRACTICES
-----------------------------------------------------------------------------------------------
Start on H4 or Daily to identify valid HTF CRT formations.
Confirm a qualifying OB inside Candle-2.
Drop to your execution timeframe and wait for the modified CTF CRT confirmation before acting.
Use IPDA 20 equilibrium as a reference for premium vs. discount zones.
Combine with your ICT session bias and overall market context for optimal decision-making.
-----------------------------------------------------------------------------------------------
Important Notes
-----------------------------------------------------------------------------------------------
OSOK is not a buy/sell signal provider. It’s a visual framework for understanding ICT-based execution models.
All objects reset automatically when new HTF candles form or setups invalidate.
Works on any symbol and timeframe by default, with HTF mapping set to H4 → D and D → W.
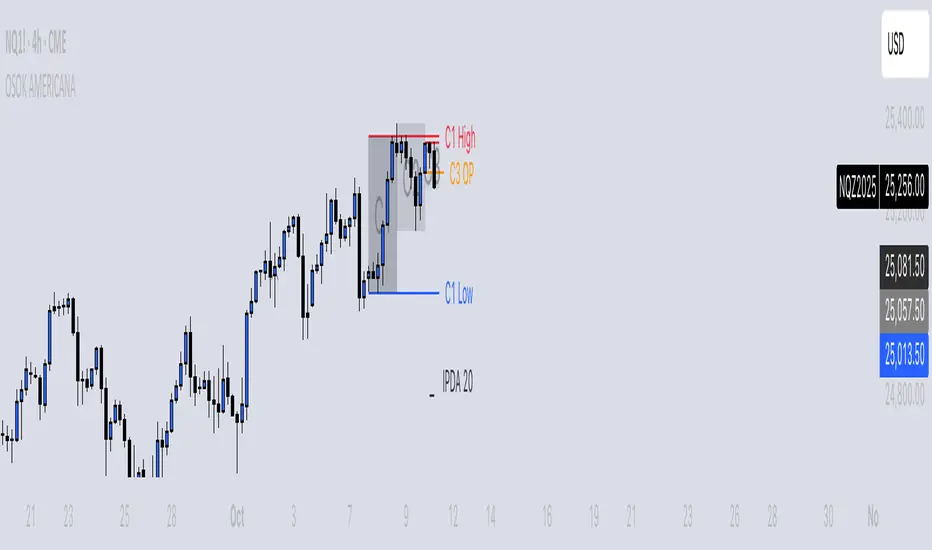
TradeVision Pro - Multi-Factor Analysis System═══════════════════════════════════════════════════════════════════
TRADEVISION PRO - MULTI-FACTOR ANALYSIS SYSTEM
Created by Zakaria Safri
═══════════════════════════════════════════════════════════════════
A comprehensive technical analysis tool combining multiple factors for
signal generation, trend analysis, and dynamic risk management visualization.
Designed for educational purposes to study multi-factor convergence trading
strategies across all markets and timeframes.
⚠️ IMPORTANT DISCLAIMER:
This indicator is provided for EDUCATIONAL and INFORMATIONAL purposes only.
It does NOT constitute financial advice, investment advice, or trading advice.
Past performance does not guarantee future results. Trading involves
substantial risk of loss. Always do your own research and consult a
financial advisor before making trading decisions.
🎯 KEY FEATURES
═══════════════════════════════════════════════════════════════════
✅ MULTI-FACTOR SIGNAL GENERATION
• Price Volume Trend (PVT) analysis
• Rate of Change (ROC) momentum confirmation
• Volume-Weighted Moving Average (VWMA) trend filter
• Simple Moving Average (SMA) price smoothing
• Signals only when all factors align
✅ DYNAMIC RISK VISUALIZATION (Educational Only)
• ATR-based stop loss calculation
• Risk-reward based take profit levels (1-5 targets)
• Visual lines and labels showing entry, SL, and TPs
• Automatically adapts to market volatility
• ⚠️ VISUAL REFERENCE ONLY - Does not execute trades
✅ SUPPORT & RESISTANCE DETECTION
• Automatic pivot-based level identification
• Red dashed lines for resistance zones
• Green dashed lines for support areas
• Helps identify key price levels
✅ VWMA TREND BANDS
• Volume-weighted moving average with standard deviation
• Color-changing bands (Green = Uptrend, Red = Downtrend)
• Filled band area for easy visualization
• Volume-confirmed trend strength
✅ TREND DETECTION SYSTEM
• Counting-based trend confirmation
• Three states: Up Trend, Down Trend, Ranging
• Requires threshold of consecutive bars
• Independent trend validation
✅ PRICE RANGE VISUALIZATION
• High/Low range lines showing market structure
• Filled area highlighting price volatility
• Helps identify breakout zones
✅ COMPREHENSIVE INFO TABLE
• Real-time trend status
• Last signal type (BUY/SELL)
• Entry price display
• Stop loss level
• All active take profit levels
• Clean, professional layout
✅ OPTIONAL FEATURES
• Bar coloring by trend direction
• Customizable alert notifications
• Toggle visibility for all components
• Fully configurable parameters
📊 HOW IT WORKS
═══════════════════════════════════════════════════════════════════
SIGNAL METHODOLOGY:
BUY SIGNAL generates when ALL conditions are met:
• Smoothed price > Moving Average (upward price trend)
• PVT > PVT Average (volume supporting uptrend)
• ROC > 0 (positive momentum)
• Close > VWMA (above volume-weighted average)
SELL SIGNAL generates when ALL conditions are met:
• Smoothed price < Moving Average (downward price trend)
• PVT < PVT Average (volume supporting downtrend)
• ROC < 0 (negative momentum)
• Close < VWMA (below volume-weighted average)
This multi-factor approach filters out weak signals and waits for
strong convergence before generating alerts.
RISK CALCULATION:
Stop Loss = Entry ± (ATR × SL Multiplier)
• Uses Average True Range for volatility measurement
• Automatically adjusts to market conditions
Take Profit Levels = Entry ± (Risk Distance × TP Multiplier × Level)
• Risk Distance = |Entry - Stop Loss|
• Creates risk-reward based targets
• Example: TP Multiplier 1.0 = 1:1, 2:2, 3:3 risk-reward
⚠️ NOTE: All risk levels are VISUAL REFERENCES for educational study.
They do not execute trades automatically.
⚙️ SETTINGS GUIDE
═══════════════════════════════════════════════════════════════════
SIGNAL SETTINGS:
• Signal Length (14): Main calculation period for averages
• Smooth Length (8): Price data smoothing period
• PVT Length (14): Price Volume Trend calculation period
• ROC Length (9): Rate of Change momentum period
RISK MANAGEMENT (Visual Only):
• ATR Length (14): Volatility measurement lookback
• SL Multiplier (2.2): Stop loss distance (× ATR)
• TP Multiplier (1.0): Risk-reward ratio per TP level
• TP Levels (1-5): Number of take profit targets to display
• Show TP/SL Lines: Toggle visual reference lines
SUPPORT & RESISTANCE:
• Pivot Lookback (10): Sensitivity for S/R detection
• Show SR: Toggle support/resistance lines
VWMA BANDS:
• VWMA Length (20): Volume-weighted average period
• Show Bands: Toggle band visibility
TREND DETECTION:
• Trend Threshold (5): Consecutive bars required for trend
PRICE LINES:
• Period (20): High/low calculation lookback
• Show: Toggle price range visualization
DISPLAY OPTIONS:
• Signals: Show/hide BUY/SELL labels
• Table: Show/hide information panel
• Color Bars: Enable trend-based bar coloring
ALERTS:
• Enable: Activate alert notifications for signals
💡 USAGE INSTRUCTIONS
═══════════════════════════════════════════════════════════════════
RECOMMENDED APPROACH:
• Works on all timeframes (1m to Monthly)
• Suitable for all markets (Stocks, Forex, Crypto, etc.)
• Best used with additional analysis and confirmation
• Always practice proper risk management
ENTRY STRATEGY:
1. Wait for BUY or SELL signal to appear
2. Check trend table for trend confirmation
3. Verify VWMA band color matches signal direction
4. Look for nearby support/resistance confluence
5. Consider entering on next candle open
6. Use visual SL level for risk management
EXIT STRATEGY:
1. Use TP levels as potential exit zones
2. Consider scaling out at multiple TP levels
3. Exit on opposite signal
4. Adjust stops as trade progresses
5. Account for spread and slippage
TREND TRADING:
• "Up Trend" → Focus on BUY signals
• "Down Trend" → Focus on SELL signals
• "Ranging" → Wait for clear trend or use range strategies
🎨 VISUAL ELEMENTS
═══════════════════════════════════════════════════════════════════
• GREEN VWMA BANDS → Bullish trend indication
• RED VWMA BANDS → Bearish trend indication
• ORANGE DASHED LINE → Entry price reference
• RED SOLID LINE → Stop loss level
• GREEN DOTTED LINES → Take profit targets
• RED DASHED LINES → Resistance levels
• GREEN DASHED LINES → Support levels
• GREY FILLED AREA → Price high/low range
• GREEN BUY LABEL → Long signal
• RED SELL LABEL → Short signal
• BLUE INFO TABLE → Current trade details
• GREEN/RED BARS → Trend direction (optional)
⚠️ IMPORTANT NOTES
═══════════════════════════════════════════════════════════════════
RISK WARNING:
• Trading involves substantial risk of loss
• You can lose more than your initial investment
• Past performance does not guarantee future results
• No indicator is 100% accurate
• Always use proper position sizing
• Never risk more than you can afford to lose
EDUCATIONAL PURPOSE:
• This tool is for learning and research
• Not a complete trading system
• Should be combined with other analysis
• Requires interpretation and context
• Test thoroughly before live use
• Consider consulting a financial advisor
TECHNICAL LIMITATIONS:
• Signals lag price action (all indicators lag)
• False signals occur in choppy markets
• Works better in trending conditions
• Support/resistance levels are approximate
• TP/SL levels are suggestions, not guarantees
📚 METHODOLOGY
═══════════════════════════════════════════════════════════════════
This indicator combines established technical analysis concepts:
• Price Volume Trend (PVT): Volume-weighted price momentum
• Rate of Change (ROC): Momentum measurement
• Volume-Weighted Moving Average (VWMA): Trend identification
• Average True Range (ATR): Volatility measurement (J. Welles Wilder)
• Pivot Points: Support/resistance detection
All methods are based on publicly available technical analysis
principles. No proprietary or "secret" algorithms are used.
⚖️ FULL DISCLAIMER
═══════════════════════════════════════════════════════════════════
LIABILITY:
The creator (Zakaria Safri) assumes NO liability for:
• Trading losses or damages of any kind
• Loss of capital or profits
• Incorrect signal interpretation
• Technical issues, bugs, or errors
• Any consequences of using this tool
USER RESPONSIBILITY:
By using this indicator, you acknowledge that:
• You are solely responsible for your trading decisions
• You understand the substantial risks involved
• You will not hold the creator liable for losses
• You will conduct your own research and analysis
• You may consult a licensed financial professional
• You are using this tool entirely at your own risk
AS-IS PROVISION:
This indicator is provided "AS IS" without warranty of any kind,
express or implied, including but not limited to warranties of
merchantability, fitness for a particular purpose, or non-infringement.
The creator is not a registered investment advisor, financial planner,
or broker-dealer. This tool is not approved or endorsed by any
financial authority.
📞 ABOUT THE CREATOR
═══════════════════════════════════════════════════════════════════
Created by: Zakaria Safri
Specialization: Technical analysis indicator development
Focus: Multi-factor analysis, risk visualization, trend detection
This is an educational tool designed to demonstrate technical
analysis concepts and multi-factor signal generation methods.
📋 VERSION INFO
═══════════════════════════════════════════════════════════════════
Version: 1.0
Platform: TradingView Pine Script v5
License: Mozilla Public License 2.0
Creator: Zakaria Safri
Year: 2024
═══════════════════════════════════════════════════════════════════
Study Carefully, Trade Wisely, Manage Risk Properly
TradeVision Pro - Educational Trading Tool
Created by Zakaria Safri
═══════════════════════════════════════════════════════════════════

Prophet Model [TakingProphets]The Prophet Model — context pipeline (HTF PDA → Sweep → CISD → EPE) with dynamic risk
Purpose
Informational overlay for organizing institutional context in real time. It does not issue buy/sell signals and is not financial advice. Use it to structure analysis and checklist-driven execution—not to automate decisions.
What it does (modules at a glance)
Projects HTF PD Arrays (FVGs) onto your current chart and maintains only the nearest active array.
Validates directional bias using Candle Range Theory (CRT) on the same HTF.
Tracks Liquidity Sweeps (BSL/SSL) on HTF-aware pivots.
Confirms Change in State of Delivery (CISD) via displacement after a sweep.
Optionally refines entries with EPE when a local (internal) imbalance forms right after CISD.
Derives dynamic TP/BE/SL from measured displacement and recent extremes (not fixed distances).
Keeps a rules checklist (PDA tap → CRT → Sweep → CISD) and a relationships table (common HTF↔LTF pairings) to enforce process.
How it works (integration, not a mashup)
The modules are sequenced on one HTF time base so each step gates the next:
HTF PD Arrays (context zone). The model identifies valid HTF FVGs, filters tiny/weekend gaps, removes arrays that are invalidated by clean trades-through, and persists only the nearest PDA. This focuses attention on the institutional zone most likely to matter now.
CRT (directional gating). CRT on the same HTF establishes a provisional bias. No entries are implied; CRT simply permits or forbids the following steps. If CRT disagrees with the PDA context, the checklist remains incomplete.
Liquidity Sweep (event). The model tracks HTF-aware BSL/SSL pivots. A sweep only “counts” if it occurs in relation to the active PDA (tap/engagement). This prevents generic swing-high/low tags from triggering downstream logic.
CISD (confirmation). After a qualified sweep, the tool looks for displacement through the sequence open (the open of the impulsive leg beginning at or immediately after the sweep). Crossing that threshold confirms CISD, which marks a structural delivery shift consistent with the CRT bias.
EPE (refinement, optional). Immediately following CISD, the model scans for a fresh internal imbalance. If found quickly, it promotes that price area as the Easiest Point of Entry (EPE) and relabels the reference. If not, the CISD level remains primary.
Dynamic risk levels. TP/BE/SL are derived from the measured displacement around the CISD leg (e.g., BE ≈ 1× leg, TP ≈ 2.25× stretch; SL aligned to nearby structural extremes rather than a fixed pip offset). Levels update with structure and can display prices.
By chaining PDA → CRT → Sweep → CISD → (EPE) → Risk on a single HTF backbone, the tool creates a coherent workflow where later signals simply do not appear without earlier context. That’s why this is not a bundle of independent features: each module’s output is another module’s input.
Concepts & operational rules (high level)
HTF PD Arrays (FVGs)
Uses a standard three-candle gap definition on the chosen HTF, with filters for weekend/tiny gaps.
Inverse mitigation: if price trades cleanly through an array, the box is removed and internal state resets.
Nearest-PDA persistence: when multiple arrays exist, only the closest remains visible to reduce clutter.
Optional right-extension draws lingering influence X bars forward.
Candle Range Theory (CRT)
Bullish CRT: candle 2 wicks below candle 1’s low but closes back inside candle 1’s range, without taking its high.
Bearish CRT: candle 2 wicks above candle 1’s high but closes back inside candle 1’s range, without taking its low.
Role: bias validation paired to CISD when alignments match the active PDA.
Liquidity Sweeps (BSL/SSL)
Tracks candidate HTF pivots as buy-/sell-side liquidity.
A sweep registers when price takes a tracked pivot in the vicinity of the active PDA.
CISD (Change in State of Delivery)
Finds the sequence open for the impulsive leg that begins at/after the sweep.
Bearish path (after BSL sweep): CISD when close < sequence-open.
Bullish path (after SSL sweep): CISD when close > sequence-open.
On confirmation, the model plots a CISD line, checks the box in the Strategy Checklist, and triggers risk calc.
EPE (Easiest Point of Entry)
Within a short window after CISD, scans for a local imbalance; if present, promotes that level as EPE.
If no imbalance forms, CISD remains the operative reference.
Dynamic TP / BE / SL
Built from the measured leg around CISD (not fixed pip steps).
Approximate geometry: BE ≈ 1× leg, TP ≈ 2.25× leg; SL respects nearby structural extremes.
Labels and price markers are optional.
Architecture notes
Maps the current chart to a higher timeframe (e.g., 15s→M5, M1→M15, M5→H1, M15→H4, H1→D, H4→W, D→M).
Retrieves HTF OHLC/time with no lookahead so structures update intrabar until the HTF bar closes.
Periodic cleanup clears obsolete lines/labels/boxes to keep charts responsive.
Inputs (summary)
FVGs/PD Arrays: show/hide, colors, borders, label size, right-extension, nearest-only toggle.
CRT: enable/disable, label style.
Sweeps/CISD/EPE: enable/disable, line/label styles, EPE window.
Risk Levels (TP/BE/SL): enable each, price labels on/off, colors.
Tables/Checklist: strategy checklist on/off; relationships table (common HTF↔LTF pairings); text sizes and header colors.
Alerts (optional)
You may add alertconditions aligned with these events in your own workspace:
HTF PDA tap (bullish/bearish box)
CRT detected (bullish/bearish)
CISD confirmed (bullish/bearish)
EPE set/updated
Example messages:
“Prophet: CISD confirmed on {{ticker}} / {{interval}}”
“Prophet: EPE refined at {{close}} ({{time}})”
Notes & limitations
HTF values are provisional until the HTF bar closes; labels/levels can update while forming.
CISD/EPE are live conditions; they can form and later invalidate within the same HTF bar.
Liquidity relationships vary by market/regime; thin sessions and large gaps can affect clarity.
Educational tool only. No performance claims; no trade signals.
Originality & scope (for protected/invite-only publications)
A single HTF-synchronized engine sequences PDA → CRT → Sweep → CISD → (EPE) and withholds later steps unless prerequisites are met.
Nearest-PDA persistence and inverse-mitigation enforce focus on the most relevant institutional zone.
Displacement-based risk math ties TP/BE/SL to structure instead of static offsets.
Checklist + relationships table promote consistent, rules-first behavior and reduce discretionary drift.
Attribution: Concepts inspired by ICT (PD arrays/FVGs, CRT, sweeps, displacement, refined entries). Design, integration logic, and risk framework by TakingProphets.
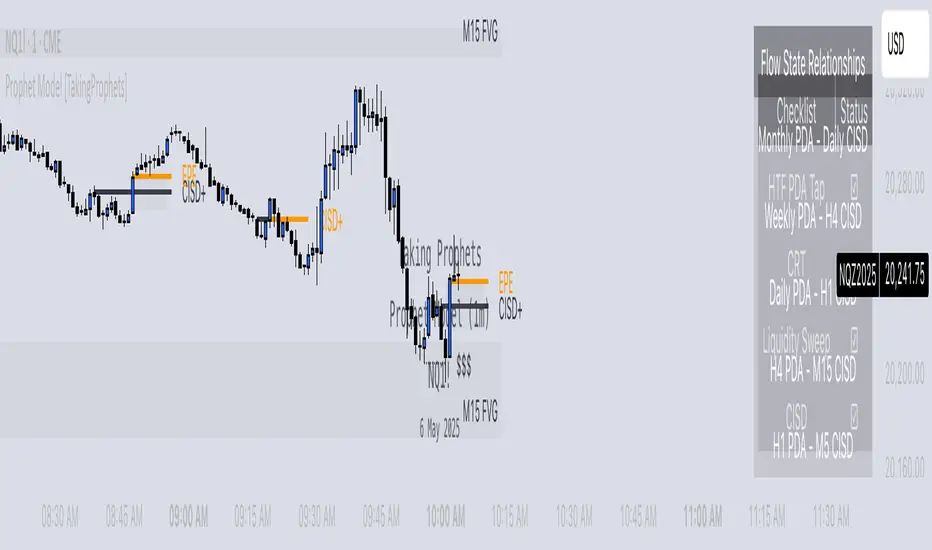
First-Move-Wrong Toolkit [CHE] First-Move-Wrong Toolkit — Session-bound sweep rejection with structure confirmation
Summary
This indicator marks potential “first move wrong” reversals during a defined trading session. It looks for a quick sweep beyond the prior day high or low, or the opening range high or low, followed by rejection and a basic structure confirmation. Optional rules require a retest and a VWAP reclaim in the direction of the trade idea. The script renders session levels as right-extended lines, signals as labels, optional SL/TP guide lines for visualization, and background tints during sweep events. Pivots are confirmed using swing width, which reduces repaint risk compared to live swings.
Motivation: Why this design?
Intraday reversals often start with a liquidity sweep around obvious highs or lows. Acting on the sweep alone can be noisy, while waiting for structure break and a retest can be slow. This tool balances both by checking a sweep and rejection at session-relevant levels, then requiring a simple structure cue and, optionally, a retest and a VWAP filter. The goal is a clear, rule-based signal layer that is easy to audit on chart without hidden state.
What’s different vs. standard approaches?
Baseline reference: Simple sweep detectors or basic CHOCH markers that ignore session context and liquidity anchors.
Architecture differences:
Session-aware opening range tracking that finalizes after the chosen minutes from session start.
Daily previous high and low pulled without lookahead, then extended forward as visual anchors.
Confirmed pivot highs and lows to avoid repaint from live, unconfirmed swings.
Optional retest rule using crossover or crossunder at the trigger level.
Optional VWAP filter to demand reclaim in the intended direction.
Global label cooldown to prevent clusters of signals.
Practical effect: Fewer one-off flips around noisy levels, clearer alignment with session structure, and compact visual feedback through lines, labels, and tints.
How it works (technical)
Levels: During the defined session, the script builds an opening range high and low until the configured minute mark after session start, then freezes those levels for the day. It also fetches the previous day high and low from the daily timeframe without lookahead and extends them forward.
Sweep and rejection: A sweep is defined as price moving beyond a target level and then rejecting back inside on the same bar. The script checks this condition separately for highs and lows against opening range and previous-day levels.
Structure validation: Confirmed pivot highs and lows are computed using a symmetric swing width. A bearish idea requires a prior sweep of a high plus a break through the last confirmed swing low. A bullish idea requires a prior sweep of a low plus a break through the last confirmed swing high.
Optional retest: If enabled, a bearish signal needs a cross under the bearish trigger level; a bullish signal needs a cross over the bullish trigger level.
VWAP filter (optional): The script requires a reclaim of VWAP in the intended direction when enabled.
State handling: Opening range values, previous-day lines, and the label cooldown timestamp are stored in persistent variables. Lines are created once and updated each bar to extend forward.
Repaint considerations: Pivots confirm only after the specified swing width, reducing repaint. The daily level request is performed without lookahead. Signals use closed-bar checks implied by crossover and crossunder logic.
Parameter Guide
Session (local) — Defines the active trading window. Default nine to seventeen. Narrower windows focus on the main session drive.
Opening Range (min) — Minutes from session start to finalize OR levels. Default fifteen. Shorter values react faster; longer values stabilize levels.
Use PrevDay H/L levels — Toggle previous-day anchors. On by default.
Use OR H/L levels — Toggle opening range anchors. On by default.
Equal H/L tolerance (ticks) — Intended tolerance for equal highs or lows. Default one. (Unknown/Optional) in current signals.
Swing width — Bars on both sides for confirmed pivots. Default two. Larger values reduce noise but confirm later.
Require CHOCH after sweep — Enforces structure break after a sweep. On by default.
Prefer retest entries — Requires crossover or crossunder of the trigger level. On by default.
VWAP filter — Demands a reclaim of VWAP in signal direction. Off by default.
TP in R (guide) — Multiplier for visual TP guides. Default one. Visualization only.
Show levels / Show signals / Show R-guides — Rendering toggles. R-guides are visual aids, not orders.
Label cooldown (bars) — Minimum bars between labels. Default five. Higher values reduce clusters.
Palette inputs — Colors and transparencies for levels, labels, VWAP, and tints.
Reading & Interpretation
Lines: Dotted lines represent opening range high and low after the OR window completes. Dashed lines represent previous-day high and low.
Signals: “Long” labels appear after a low-side sweep with rejection and structure confirmation, subject to optional retest and VWAP rules. “Short” labels mirror this on the high side.
Background tints: Red-tinted bars indicate a high-side sweep and rejection. Green-tinted bars indicate a low-side sweep and rejection.
R-guides: Circles display a visual stop level at the bar extreme and a target guide based on the selected multiple. They are informational only.
Practical Workflows & Combinations
Session reversal scans: During the first hour, watch for sweeps around previous-day or opening range levels, then wait for structure confirmation and optional retest.
Trend following with filters: Combine signals with higher-timeframe structure or a moving average regime check. Ignore signals against the dominant regime.
Exits and stops: Use the visual stop as a reference near the sweep extreme; adapt the target guide to volatility and market conditions.
Multi-asset / Multi-TF: Works on intraday timeframes for liquid futures, indices, forex, and large-cap equities. Start with default settings and adjust swing width and OR minutes to instrument volatility.
Behavior, Constraints & Performance
Repaint/confirmation: Pivots confirm after the swing window completes. Signals occur only when conditions are met on closed bars.
security()/HTF: Daily previous-day levels are requested without lookahead to reduce repaint.
Resources: Uses persistent variables and line updates per bar; no heavy loops or arrays.
Known limits: Signals can arrive later when swing width is large. Gaps around session boundaries may distort OR levels. VWAP behavior may vary with partial sessions or illiquid assets.
Sensible Defaults & Quick Tuning
Starting point: Session nine to seventeen, opening range fifteen minutes, swing width two, CHOCH required, retest on, VWAP off, cooldown five bars.
Too many flips: Increase swing width, enable VWAP filter, or raise label cooldown.
Too sluggish: Reduce swing width or shorten the opening range window.
Too many session-level hits: Disable either previous-day levels or opening range levels to simplify context.
What this indicator is—and isn’t
This is a session-aware visualization and signal layer focused on sweep-plus-structure behavior. It is not a complete trading system and does not manage orders, risk, or portfolio exposure. Use it with market structure, risk limits, and execution rules that fit your process.
Disclaimer
The content provided, including all code and materials, is strictly for educational and informational purposes only. It is not intended as, and should not be interpreted as, financial advice, a recommendation to buy or sell any financial instrument, or an offer of any financial product or service. All strategies, tools, and examples discussed are provided for illustrative purposes to demonstrate coding techniques and the functionality of Pine Script within a trading context.
Any results from strategies or tools provided are hypothetical, and past performance is not indicative of future results. Trading and investing involve high risk, including the potential loss of principal, and may not be suitable for all individuals. Before making any trading decisions, please consult with a qualified financial professional to understand the risks involved.
By using this script, you acknowledge and agree that any trading decisions are made solely at your discretion and risk.
Do not use this indicator on Heikin-Ashi, Renko, Kagi, Point-and-Figure, or Range charts, as these chart types can produce unrealistic results for signal markers and alerts.
Best regards and happy trading
Chervolino

VIX Delta SentimentThis script opens a new panel underneath the main panel.
It displays a table with the values of the CBOE volatility index VIX, which measures the last 30 days implied volatility of the S&P500 index, the VX1! and the VX2! values, which are the front month and the second month VIX futures.
To curves are plotted: the relative difference or delta of the two VIX futures as well as the relative delta between VIX and the first futures month. The dotted lines visualize the thresholds of these two relative deltas.
These values are needed to determine the market sentiment and to trigger a crash alert before it happens. It can be used to trade the major indices SPX, QQQ, etc. or to avoid catastrophic losses.
The market sentiment is annotated in the table and also visualized as background color.
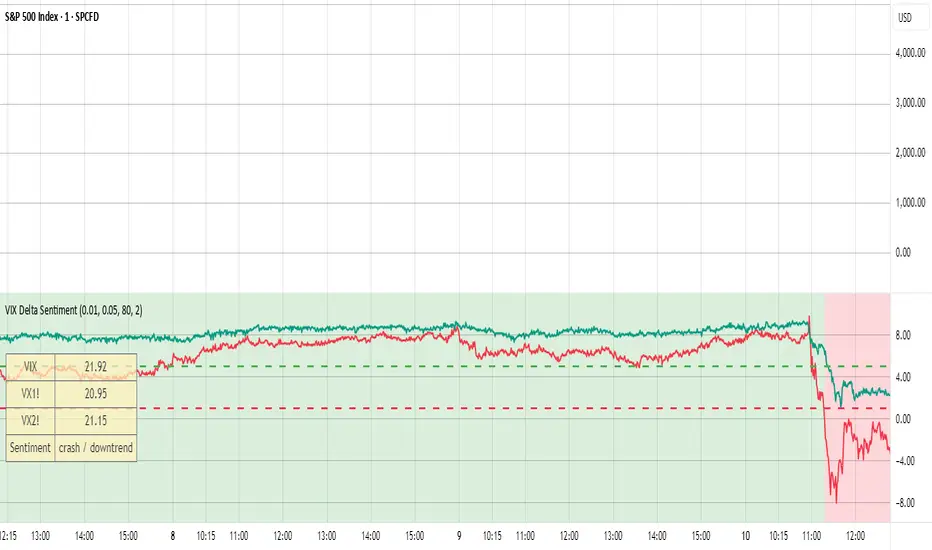
Market Regime IndexThe Market Regime Index is a top-down macro regime nowcasting tool that offers a consolidated view of the market’s risk appetite. It tracks 32 of the world’s most influential markets across asset classes to determine investor sentiment by applying trend-following signals to each independent asset. It features adjustable parameters and a built-in alert system that notifies investors when conditions transition between Risk-On and Risk-Off regimes. The selected markets are grouped into equities (7), fixed income (9), currencies (7), commodities (5), and derivatives (4):
Equities = S&P 500 E-mini Index Futures, Nasdaq-100 E-mini Index Futures, Russell 2000 E-mini Index Futures, STOXX Europe 600 Index Futures, Nikkei 225 Index Futures, MSCI Emerging Markets Index Futures, and S&P 500 High Beta (SPHB)/Low Beta (SPLV) Ratio.
Fixed Income = US 10Y Treasury Yield, US 2Y Treasury Yield, US 10Y-02Y Yield Spread, German 10Y Bund Yield, UK 10Y Gilt Yield, US 10Y Breakeven Inflation Rate, US 10Y TIPS Yield, US High Yield Option-Adjusted Spread, and US Corporate Option-Adjusted Spread.
Currencies = US Dollar Index (DXY), Australian Dollar/US Dollar, Euro/US Dollar, Chinese Yuan/US Dollar, Pound Sterling/US Dollar, Japanese Yen/US Dollar, and Bitcoin/US Dollar.
Commodities = ICE Brent Crude Oil Futures, COMEX Gold Futures, COMEX Silver Futures, COMEX Copper Futures, and S&P Goldman Sachs Commodity Index (GSCI) Futures.
Derivatives = CBOE S&P 500 Volatility Index (VIX), ICE US Bond Market Volatility Index (MOVE), CBOE 3M Implied Correlation Index, and CBOE VIX Volatility Index (VVIX)/VIX.
All assets are directionally aligned with their historical correlation to the S&P 500. Each asset contributes equally based on its individual bullish or bearish signal. The overall market regime is calculated as the difference between the number of Risk-On and Risk-Off signals divided by the total number of assets, displayed as the percentage of markets confirming each regime. Green indicates Risk-On and occurs when the number of Risk-On signals exceeds Risk-Off signals, while red indicates Risk-Off and occurs when the number of Risk-Off signals exceeds Risk-On signals.
Bullish Signal = (Fast MA – Slow MA) > (ATR × ATR Margin)
Bearish Signal = (Fast MA – Slow MA) < –(ATR × ATR Margin)
Market Regime = (Risk-On signals – Risk-Off signals) ÷ Total assets
This indicator is designed with flexibility in mind, allowing users to include or exclude individual assets that contribute to the market regime and adjust the input parameters used for trend signal detection. These parameters apply to each independent asset, and the overall regime signal is smoothed by the signal length to reduce noise and enhance reliability. Investors can position according to the prevailing market regime by selecting factors that have historically outperformed under each regime environment to minimise downside risk and maximise upside potential:
Risk-On Equity Factors = High Beta > Cyclicals > Low Volatility > Defensives.
Risk-Off Equity Factors = Defensives > Low Volatility > Cyclicals > High Beta.
Risk-On Fixed Income Factors = High Yield > Investment Grade > Treasuries.
Risk-Off Fixed Income Factors = Treasuries > Investment Grade > High Yield.
Risk-On Commodity Factors = Industrial Metals > Energy > Agriculture > Gold.
Risk-Off Commodity Factors = Gold > Agriculture > Energy > Industrial Metals.
Risk-On Currency Factors = Cryptocurrencies > Foreign Currencies > US Dollar.
Risk-Off Currency Factors = US Dollar > Foreign Currencies > Cryptocurrencies.
In summary, the Market Regime Index is a comprehensive macro risk-management tool that identifies the current market regime and helps investors align portfolio risk with the market’s underlying risk appetite. Its intuitive, color-coded design makes it an indispensable resource for investors seeking to navigate shifting market conditions and enhance risk-adjusted performance by selecting factors that have historically outperformed. While it has proven historically valuable, asset-specific characteristics and correlations evolve over time as market dynamics change.
