SB_CM_MacD_Ult_MTFThis strategy places the order based on the MACD signal.
Original Indicator: MacD Custom Indicator-Multiple Time Frame+All Available Options! by ChrisMoody
Link to the Indicator:
If your risk appetite is high you can replace the first statement with the below statement:
strategy(title="SB_CM_MacD_Ult_MTF", shorttitle="SB_CM_MacD_Ult_MTF", default_qty_type = strategy.percent_of_equity, default_qty_value = 100, pyramiding = 5)
You can check for repainting. Did not check for that.
Message if you think of any modifications/ enhancements/ any opportunities. :)
Donations/Tips... :) -
BTC: 1BjswGcRR6c23pka7qh5t5k56j46cuyyy2
ETH: 0x64fed71c9d6c931639c7ba4671aeb6b05e6b3781
LTC: LKT2ykQ8QSzzfTDB6Tnsf12xwYPjgq95h4
Recherche dans les scripts pour "macd"

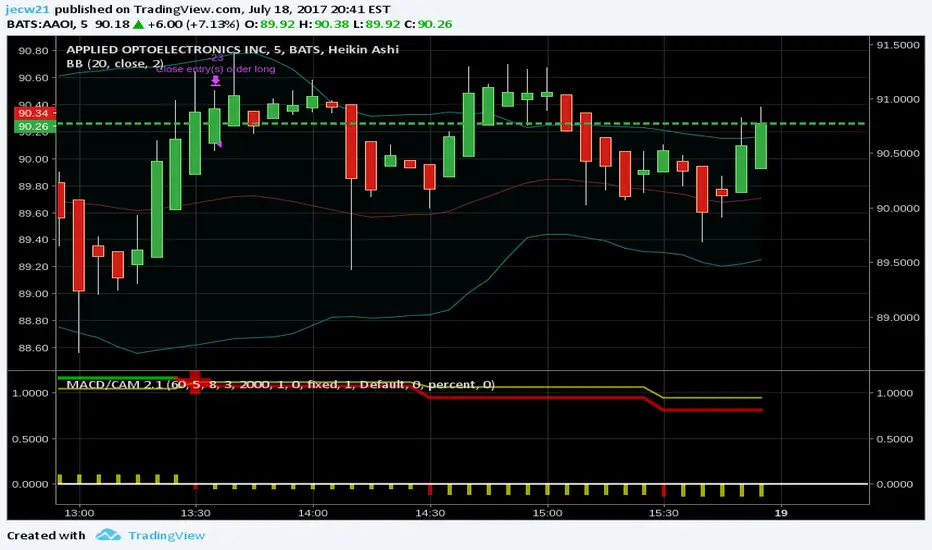
MACD/CAM 2.1
Added some modifications to Chris Moody's Macd indicator
Made fast length, slow length and signal length 5, 8, 3
Put initial capital of $2k
Buy at MACD/signal crossover
Sell at signal/MACD crossunder or when day low < previous day low
Open for feedback
5 MACD razi)• MACD confirmation to reduce false signals
• Strategy-ready: includes TP and SL
• Suitable for scalping and swing trades
• Non-repainting logic

Express Generator StrategyExpress Generator Strategy
Pine Script™ v6
The Express Generator Strategy is an algorithmic trading system that harnesses confluence from multiple technical indicators to optimize trade entries and dynamic risk management. Developed in Pine Script v6, it is designed to operate within a user-defined backtesting period—ensuring that trades are executed only during chosen historical windows for targeted analysis.
How It Works:
- Entry Conditions:
The strategy relies on a dual confirmation approach:- A moving average crossover system where a fast (default 9-period SMA) crossing above or below a slower (default 21-period SMA) average signals a potential trend reversal.
- MACD confirmation; trades are only initiated when the MACD line crosses its signal line in the direction of the moving average signal.
- An RSI filter refines these signals by preventing entries when the market might be overextended—ensuring that long entries only occur when the RSI is below an overbought level (default 70) and short entries when above an oversold level (default 30).
- Risk Management & Dynamic Position Sizing:
The strategy takes a calculated approach to risk by enabling the adjustment of position sizes using:- A pre-defined percentage of equity risk per trade (default 1%, adjustable between 0.5% to 3%).
- A stop-loss set in pips (default 100 pips, with customizable ranges), which is then adjusted by market volatility measured through the ATR.
- Trailing stops (default 50 pips) to help protect profits as the market moves favorably.
This combination of volatility-adjusted risk and equity-based position sizing aims to harmonize trade exposure with prevailing market conditions.
- Backtest Period Flexibility:
Users can define the start and end dates for backtesting (e.g., January 1, 2020 to December 31, 2025). This ensures that the strategy only opens trades within the intended analysis window. Moreover, if the strategy is still holding a position outside this period, it automatically closes all trades to prevent unwanted exposure.
- Visual Insights:
For clarity, the strategy plots the fast (blue) and slow (red) moving averages directly on the chart, allowing for visual confirmation of crossovers and trend shifts.
By integrating multiple technical indicators with robust risk management and adaptable position sizing, the Express Generator Strategy provides a comprehensive framework for capturing trending moves while prudently managing downside risk. It’s ideally suited for traders looking to combine systematic entries with a disciplined and dynamic risk approach.

Chande Momentum Oscillator (CMO) Buy Sell Strategy [TradeDots]The "Chande Momentum Oscillator (CMO) Buy Sell Strategy" leverages the CMO indicator to identify short-term buy and sell opportunities.
HOW DOES IT WORK
The standard CMO indicator measures the difference between recent gains and losses, divided by the total price movement over the same period. However, this version of the CMO has some limitations.
The primary disadvantage of the original CMO is its responsiveness to short-term volatility, making the signals less smooth and more erratic, especially in fluctuating markets. This instability can lead to misleading buy or sell signals.
To address this, we integrated the concept from the Moving Average Convergence Divergence (MACD) indicator. By applying a 9-period exponential moving average (EMA) to the CMO line, we obtained a smoothed signal line. This line acts as a filter, identifying confirmed overbought or oversold states, thereby reducing the number of false signals.
Similar to the MACD histogram, we generate columns representing the difference between the CMO and its signal line, reflecting market momentum. We use this momentum indicator as a criterion for entry and exit points. Trades are executed when there's a convergence of CMO and signal lines during an oversold state, and they are closed when the CMO line diverges from the signal line, indicating increased selling pressure.
APPLICATION
Since the 9-period EMA smooths the CMO line, it's less susceptible to extreme price fluctuations. However, this smoothing also makes it more challenging to breach the original +50 and -50 benchmarks.
To increase trading opportunities, we've tightened the boundary ranges. Users can customize the target benchmark lines in the settings to adjust for the volatility of the underlying asset.
The 'cool down period' is essentially the number of bars that await before the next signal generation. This feature is employed to dodge the occurrence of multiple signals in a short period.
DEFAULT SETUP
Commission: 0.01%
Initial Capital: $10,000
Equity per Trade: 80%
Signal Cool Down Period: 5
RISK DISCLAIMER
Trading entails substantial risk, and most day traders incur losses. All content, tools, scripts, articles, and education provided by TradeDots serve purely informational and educational purposes. Past performances are not definitive predictors of future results.

Divergence for Many [Dimkud - v5]Strategy is based on "Divergence for Many Indicators v4 ST" strategy by CannyTolany01
which is based on "Divergence for Many Indicator" indicator by LonesomeTheBlue
This strategy is searching for divergences on 18 indicators which you can select and optimise one by one.
Additionally you can connect any other External Indicator value. (just add this indicator the the chart and select option in settings)
To the original indicator/strategy I have added 9 additional indicators:
( Money Flow Index, Williams_Vix, Stochastic RSI , SMI Ergodic Oscillator, Volume Weighted MACD , Bull Bear Power, Balance of Power , Relative Volatility Index , Logistic Settings).
Converted strategy to v5 of Pine Script.
Added Static SL/TP in percents (%).
Added filters to filter enters:
1. Volume Weighted MACD - Multi-TimeFrame Filter
(It checks for histogram to falling or rising for a set periods of bars)
2. Money Flow Index - Multi-TimeFrame Filter
(It checks if MFI Oscillator is in the set diapason.
Also It checks if MFI is falling or rising for a set periods of bars )
3. ATR filter
(check changes in fast ATR to slow ATR )
Strategy shows good backtest results on many crypto tokens on 45m - 1h periods. (with parameters optimisation for every indicator)
To find best parameters - you can enable indicators one-by one, and optimise best parameters for each of them.
Then enable all indicators with successful results.
Optimise SL/TP.
Then try to enable and optimise filters (channels etc.)
The better is to optimise parameters separately for Short and Long trading. And run two separate bots (in settings enable only Long or only Short.)
Updates:
- Added visualisation for open trades (SL/TP)
- Added Volatility filter by ATR with many options for tests.
- Fixed some small bugs.
- Added second RSI filter (you can use two RSIs with different TF or settings)
- Updated ATR volatility and MFI filter. Removed non-effective options
- Added CCI filter
- Added option to Enable/Disable visualisation of TP/SL on chart
- Fixed one small quick bug. ("ATR filter short" was not working)
- Added Super Trend filter
- Added Momentum filter
- Added Volume Filter
- All "request.security" MultiTimeFrame calls changed to 100% non-repait function "f_security()"

Trend Movement S1-TMIdea:
This script combines: Moving Average (MA), Directional Movement (DMI), MACD
When condition of long or short position from all mentioned indicator are met script opens position. Once trend changes, it closes the position.
Then add some filter conditions to avoid noise.
Concept:
(Note that we take the close to get the closing price)
-Using only cross up down with MA will give a reversal point, but the downside is that it can be noisy.
-MACD will show the current trend detected by cross point.
-Then the +DI , -DI , ADX values are taken into account to confirm the price direction and movement strength.
-This strategy solves this problem by combining 2 more moving averages called 2 trend lines 1 long and 1 short. When the short line crosses up, it will show that the price trend is increasing (at this time the background between these 2 lines will be green) and vice versa (red). To determine if the current trend is bullish or bearish . This will avoid buying when price tend to go down.
-However, there will be many points where some more complex logic is needed. It will add conditions and calculate the probabilities before triggering the signals (You can see them through the item symbols B1, B2, ... ).
How it works:
1. The thin line is stand for short term moving average, and the thick line is stand for long term moving average.
If thin lines cross the thick lines, their color and background will turn green, the price is tend to go up (Uptrend).
If thin lines cross down thick lines, their color and background will turn red, the price is tend to go down (Downtrend).
2. Ability to check the checkbox in setting to show the Golden/De*ath cross.
The yellow symbol "+" is the Golden cross.
The black symbol "+" is the De*th cross.
3. Buy and Sell are show clearly on strategy as the buy and sell point. The default source from bar is CLOSE
4. Setting "Buy only" it using for spot market.
5. When "Not buy in down trend" is checked, it will not trigger buy when in down trend (thin lines cross down thick lines like description in 1.)
6. Setting High spread will call Close buy when it match the High spread bar with the High spread % value
7. It provides setting "Back test From date/To date" for backtest feature. You can set "BacktestFrom date" as the begin of test period. If check box "Using To Date" is check: "Backtest To Date" will be the end of test period.
Suitable time frames:
4h, 1D, 1W
* Please note that this logic does not attempt to predict future prices or 100% accurate signal; Strategy Tester are available to test the profitability of this strategy.
(INVITE ONLY indicator. Please direct message or visit website to try it out)
Hope you guys enjoy!
Examples:
BTCUSD 4H
TSLA 4H

DCA After Downtrend v2 (by BHD_Trade_Bot)The purpose of the strategy is to identify the end of a short-term downtrend . So that you can easily to DCA certain amount of money for each month.
ENTRY
The buy orders are placed on a monthly basis for assets at the end of a short-term downtrend:
- Each month condition: In 1-hour time frame, each month has 24 * 30 candles
- The end of short-term downtrend condition: use MACD for less delay
CLOSE
The sell orders are placed when:
- Is last bar
The strategy use $1000 and trading fee is 1.1% for each order.
Pro tip: The 1-hour time frame has the best results on average:
- Total spent: $1000 x 33 = $33,000
- Total profit: $65,578

DCA After Downtrend (by BHD_Trade_Bot)The purpose of the strategy is to identify the end of a short-term downtrend . So that you can easily to DCA certain amount of money for each month.
ENTRY
The buy orders are placed on a monthly basis for assets at the end of a short-term downtrend:
- Each month condition: In 1-hour time frame, each month has 240 candles
- The end of short-term downtrend condition: use MACD for less delay
CLOSE
The sell orders are placed when:
- Is last bar
The strategy use $1000 and trading fee is 0.1% for each order.
Pro tip: The 1-hour time frame for TSLA has the best results on average:
- Total spent: $1000 x 85 = $85,000
- Total profit: $790,556

MACD StrategyBTCUSD -- 5 min
BUY POSITION
1 : The price is above the EMA
2 : The macd line crosses above the line signal below 0
SELL POSITION
1 : The price is bellow the EMA
2 : The macd line crosses below the signal line above 0

Hulk Strategy x35 Leverage 5m chart w/Alerts This strategy is a pullback strategy that utilizes 2 EMAs as a way of identifying trend, MACD as an entry signal, and RSI and ADX to filter bad trades. By using the confirmation of all of these indicators the strategy attempts to catch pullbacks, and it is optimized to wait for high probability setups. Take not that the strategy is optimized for use on BTCUSDT along with 35 times leverage(Using leverage is risky). The Hulk Strategy waits for strong trend confirmation and then attempts to identify pullbacks using MACD and RSI. By using these it identifies strong short term movement against the trend(hence the name Hulk). To use the strategy wait for the strategy to make an entry, and then enter with a stop loss of 1.1% and a take profit of 1.35% with respect to if it is a long or short position. The trade frequency of this strategy is high as it is made for use on the 5m timeframe. But this does not mean you will have to be staring at your computer constantly as an average of 1 trade takes place each day. This will vary a lot though, somedays the strategy enters up to 4 times. I wish you good trading and hope that you like this strategy!
P.S. The indicators on my chart are visualizations of the indicators used in the strategy, they are not necessary for the strategy to work though. Also the colored in cloud on the price chart is an EMA cloud and it comes with the strategy when you add it to your chart. This EMA cloud consists of two EMAs a 50 and a 200 EMA.

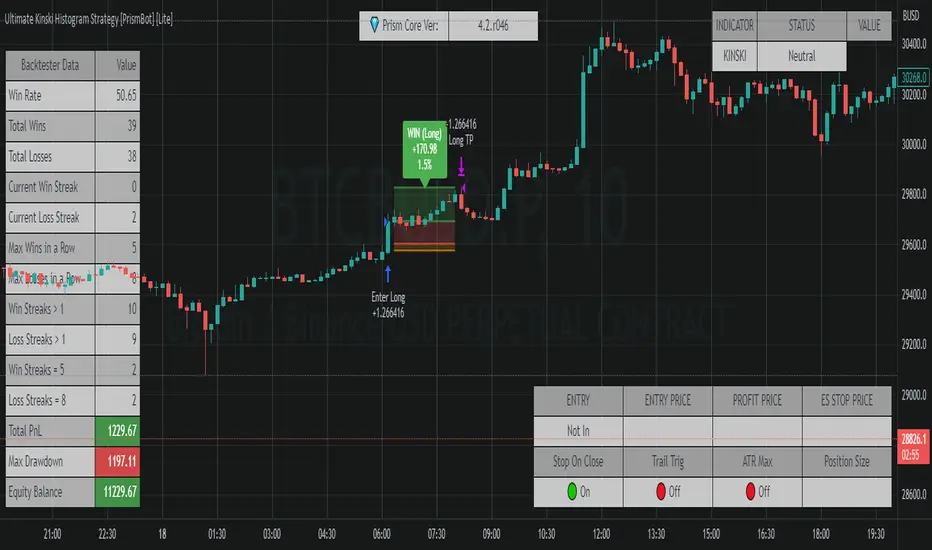
Ultimate Kinski Histogram Strategy [PrismBot] [Lite]This is an anti-curve fitting strategy that has no value inputs for the strategy settings. It just works , as they say.
This is based on the @KINSKI Buy-Sell Signal , but also incorporates other confluence (an MACD and histogram) and incorporates it into a fully automatable strategy with customizable order settings and quantity calculations.
The strategy has potential in scalping, but works best (in my testing) on higher timeframes (15M and up) with the default strategy.
Included in this Strategy:
✔️ Tweak a multitude of specific settings (MA lengths, R:R, SL distance etc)
✔️ Enable advanced setup filters
✔️ Use money management and risk calculations
✔️ Draw trade info directly to chart (eg. SL size in percent, win rate etc)
✔️ Use various filters (eg. time filter, date filter, MA slope angle etc)
✔️ Manage risk per position when auto-trading forex through AutoView
✔️ Choose from various alert conditions!
✔️ Sync to any bot or algorithmic trading system
MATIC/USD 1H Bot for 3commas (works w/o 3commas too)This is a MATIC/USD or USDT specific implementation of my BNB/USD 1 hour bot. It should work out of the gate correctly for MATIC, at least based on what has been happening with it for the past seven weeks. You can fiddle with the following settings using the gear icon:
Fast and slow MACD length
The decision to use RSI thresholds as requirements for buys and/or sells, as well as the chart timeframe to use for that (make sure you use the same timeframe as your chart or a higher timeframe. You don't want to use a 1m RSI on a one hour chart but you can use a 4 hour RSI on a 1 hour chart with no issues.)
Buy and/or sell RSI threshold limits
Trailing stop loss %
Start date (for backtesting, I usually leave mine with 1-2 months trailing as those are usually better indicators than how they would have performed over the past few years)
Stress levels
Moving Average length and type
Linear regression amount
The gist of this bot is that it will use a smoothed EMA to make informed buys and sells. The smoothing prevents most noise from affecting your orders. It also allows you to set a trailing stop loss. If you don't want to use this feature set the value to 100 and it will effectively disable it.
Finally, you can disable RSI threshold point visibility. This won't affect bot operation, it just makes it cleaner to look at on your chart. Disabling RSI buys or sells will also disable visibility.
This bot takes a shotgun strategy to buys and sells. It makes a lot of buys and the majority of them are closed with little to no movement up or down. However, the ones that are profitable make a LOT as you will see once you start testing.
I make the full version of these bots available (though the script is protected) so users can test them, however if you want to use it with 3commas you will need access to the full script. Message me if you want the code and we can figure something out.

MACD + DMI Scalping with Volatility Stop by (Coinrule)Trend-following strategies are cool because they allow you to catch potential high returns.
The main limit of such strategies are:
False signals > the asset is not experiencing a strong trend. The strategy gets stuck with a sideways move or, worst, with the beginning of a downtrend.
The sell signal may come later than the actual top, leading in some cases to turn a trade in profit into a loss.
This strategy tries to address these limitations to develop a trading system that optimises the entry and closes trade once the profit achieves a pre-set level.
ENTRY
The trading system uses the MACD and the DMI to confirm when is the best time for buying. Combining these two indicators prevents trading during downtrends and reduces the likelihood of getting stuck in a market with low volatility.
The system confirms the entry when:
The MACD histogram turns bullish.
When the positive DMI is greater than the negative DMI, there are more chances that the asset is trading in a sustained uptrend.
EXIT
The strategy comes with a fixed take profit combined with a volatility stop, which acts as a trailing stop to adapt to the trend's strength. Depending on your long term confidence in the asset, you can edit the fixed take profit to be more conservative or aggressive.
The position is closed when:
The price increases by 3%
The price crosses below the volatility stop.
The best time frame for this strategy based on our backtest is the 3-hr . The 4-hr can work well. In general, this approach suits medium to long term strategies
The strategy assumes each order to trade 30% of the available capital to make the results more realistic. A trading fee of 0.1% is taken into account. The fee is aligned to the base fee applied on Binance, which is the largest cryptocurrency exchange.

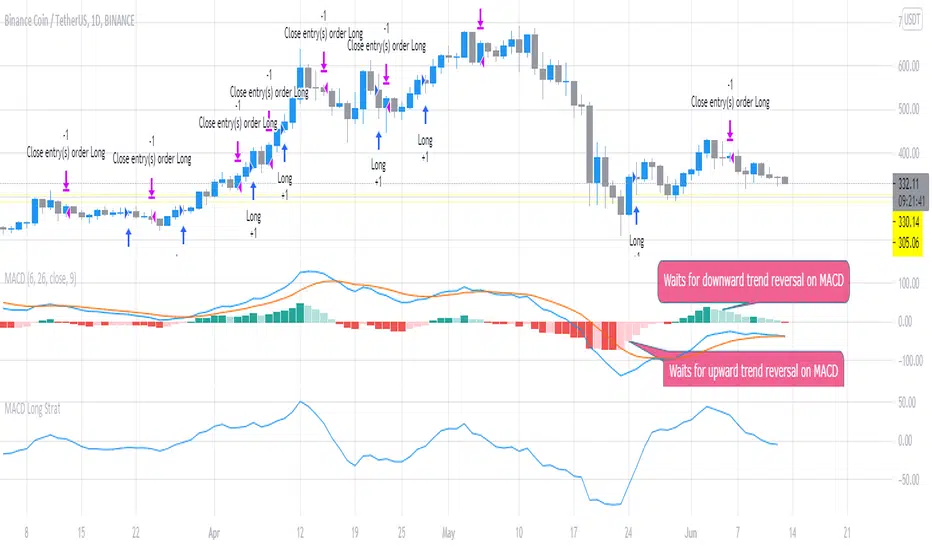
MACD Long StratFirst script I've written, but the concept is pretty simple. This uses the MACD with settings fast_SMA = 6 and slow SMA=16 and uses the distance between the 2 (histogram) to look for potential trend reversals to flag potential entries for Long trades. It waits for the confirmation looking backward 2 x timeframes (to reduce false calls slightly). You can adjust it to open / close quicker (1 timeframe instread of 2) but backtesting shows 2 timeframe delay is best to avoid false signals.
The script suggests Long entry points based on this criteria and uses the converse (reducing histogram / SMA difference delayed by 2 timeframes) to suggest exit or trade close points for downward reversal. It was originally written looking at 1m scalps but backtesting shows this is even more effective on higher timeframes (1D).
MACD BTC Long/Short Strategy v1.0This strategy will use only default MACD with Simple MA(Signal Line) mode 'ON' to determine when it's time to long/short using its histogram value.
Current version has 2 more entries added to increase more trades and profits along the way while maintaining low 'max drawdown' and high returns.
Entry will be opened when macd line(blue) crossed with signal line(red).
Entry will be closed when histogram increased/decreased opposite its previous histogram.
Re-enter will opened a position when histogram continues after X delay (Re-enter Delay setting).
Sculp will opened a position when histogram is still in light colors for X delay (Sculp Delay setting).

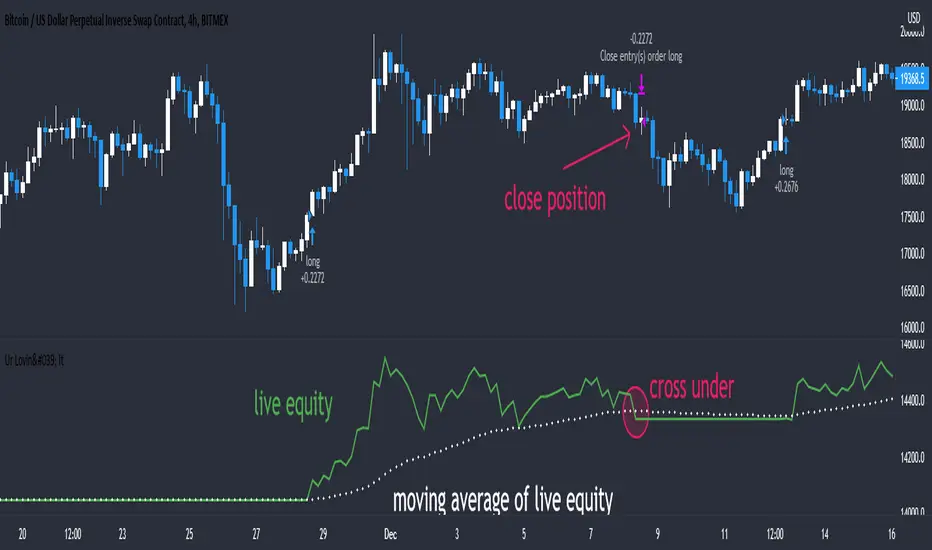
MACD controlled risk strategy exampleUsing a basic MACD as a signal this code is an example of how to base strategies around stops and calculated risk per trade rather than the more common approach of 'equity flipping' long and short for every trade and using an arbitrary %age stop which can leave you a bit exposed, lead to excessive drawdown and miss out on bigger sized positions for more profits.
Buy and Sell Signals (With Stops and TP) - No Repaint
This strategy is primarily based on the MACD-indicator, but signals are filtered with the 200 ema.
This indicator gives you for every trade a stopp loss and take profit line.
As with every other strategy risk management is key. The trades taken have all 1.5:1 risk ratios, so when you lose one trade and win one you are still in profit.
This will only work if you calculate your position size accordingly when actually trading!
Without leverage:
position_size = (portfolio * loss_per_trade) / (stop_loss_in_percent )
Leverage:
position_size = (portfolio * loss_per_trade) / (stop_loss_in_percent * leverage)
For example:
portfolio = 100000
loss_per_trade = 0.01 | I only want to lose 1% per trade
stop_loss_in_percent = 0.04 | The stoploss is 4% away from our entry
(100000 * 0.01) / 0.04 = 2500 => if this trade hits my stop, I will only lose 1 % of my portfolio.
This strategy works well with:
BTCUSD 30m
BANDUSDTPERP 5m
EUR DOLLAR 15m
Of course it can be applied to anything, but you should firstly validate the strategy via backtest for the according trading pair and timeframe as it can perform differenlty in various timeframes.
This script does not repaint.
If you are interested in this strategy dm me.
Good luck on your trades!

BTC and ETH Long strategy - version 2I wrote my first article in May 2020. See below
BTC and ETH Long strategy - version1
After 6 months, it is now time to check the result of my script for the last 6 months.
XBTUSD (4H): 14/05/2020 --> 22/11/2020 = +78% in 4 trades
ETHXBT (4H): 14/05/2020 --> 22/11/2020 = +21% in 9 trades
ETHUSD (4H): 14/05/2020 --> 22/11/2020 = +90% in 6 trades
Using the signals from this strategy to trade manually has shown that this was a bit frustrating because of the low rate of winning trades.
If you have to enter 100 trades and see 75% of them failing and 25% winning, this is frustrating. For sure the strategy makes good money but it is difficult to hold this mentality.
So, I have reviewed and modified it to get a higher winning rate.
After few days of work, tests and validation, I managed to get a wining rate close to 60%.
The key element was also to decrease the number of trades by using a higher time frame. (4H candles instead of 2H candles).
- Entry in position is based on
MACD, EMA (20), SMA (100), SMA (200) moving up
AND EMA (20) > SMA (100)
AND SMA (100) > SMA (200)
- Exit the position if: Stoploss is reached OR EMA (20) crossUnder SMA (100)
The goal of this new script is to be able to follow the signals manually and only make few trades per years.
I have also validated it against some other altcoins where some are giving very good results.
Here are some results for 2020 (from 01/01/2020 until now (22/11/2020). Those results are the one I get when using 4H candles.
ETH/USD: +144% in 8 trades.
BTC/USD: +120% in 7 trades.
ETH/BTC: +33% in 9 trades.
ICX/USD: +123% in 10 trades.
LINK/USD: +155% in 11 trades.
MLN/USD: +388% in 8 trades.
ADA/USD: +180% in 7 trades.
LINK/BTC: +97% in 10 trades.
The best is that above results are without considering compound effect. If you re-invest all gains done in each new trade, this will give you the below results :)
ETH/USD: +189% in 8 trades.
BTC/USD: +260% in 7 trades.
ETH/BTC: +29% in 9 trades.
ICX/USD: +112% in 10 trades.
LINK/USD: +222% in 11 trades.
MLN/USD: +793% in 8 trades.
ADA/USD: +319% in 7 trades.
LINK/BTC: +103% in 10 trades.
As you can see, the results are good and the number of trades for 11 months is not big, which allows the trader to place orders manually.
But still, I'm lazy :), so, I have also coded this strategy in HaasScript language which allows you to automate this strategy using the HaasOnline software specialized in automated crypto trading.
I hope that this strategy will give you ideas or will be the starting point for your own strategy.
Let me know if you need more details.

Trading Technicals Strategy V1This strategy was developed in order to optimize 'bull' and 'bear' entry and exit signals based on a set of relatively basic but unique parameters, consisting of Exponential Moving Averages, candlestick formation, as well as data from the common RSI and MACD indicators.
Revisions should be expected as my goal with this strategy is to collect data by manipulating the existing entry and exit conditions in order to find the most successful results. I would like to optimize this strategy for a certain time period as well, as there are varying degrees of results between, say, the 5m chart and the 1h chart. I hope to revise this script when I have what I believe to be significantly improved results, and I would also consider the idea of publishing multiple strategies based on the code that works best for each time frame (V1 may work best for the 30m period, a future V2 may be best suited for the 45m period, etc.)
As of publishing this script, two significant points to note are:
1. There are no overnight holds - all positions are exited before market close
2. While you may see several instances in one day's time of the 'bull' signal rising, then returning to zero, a bullish position will not exit at zero, only - the position will remain active until a 'bear' position is signaled, at which point the 'bull' position will be closed and a 'bear' position will open. The same is true in the opposite scenario.
These points are of course subject to change throughout the optimization process. Lastly, my goal is not to look for the strategy that only yields the most profit, but the one that provides the most consistency in achieving those profits.

MACD Cross+MAStrategy MACD cross + Ma cross
การเข้าจะเข้าต่อเมื่อมีการ Cross ของ MACD ก่อน แล้วมีการ Cross ของเส้น ma 9,26 ตามมา
จากการ Backtest ของผมถือว่าเป้น Indicator ที่ค่อนข้างบอกให้เข้าช้าเลยทีเดียว แต่ใช้ Follow เทรนพอใช้ได้อยู่ครับ
แนะนำให้ใช้ในช่วงที่ตลาดเป็นขาขึ้นนะครับ ช่วงหมียาวอย่างปี 2018 Indicator ตั้วนี้ไม่เวิร์คอย่างแรงเลยครับ
ในภาพ backtest ตั้งแต่ปี 2019 - ปัจจุบันนะครับ
ใช้ใน TF Day จะเห็นผลดีที่สุด

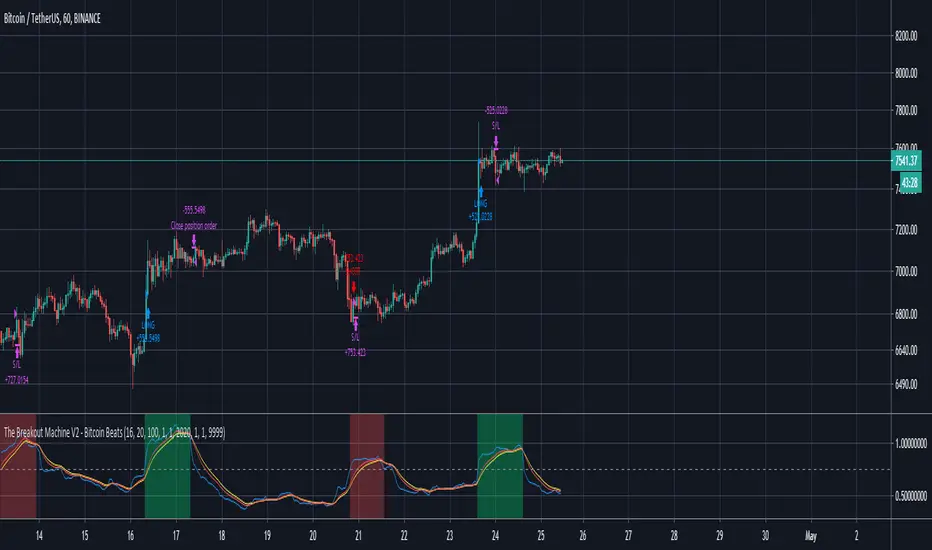
The Breakout Machine V2 BTCUSDT - Bitcoin BeatsHello, Hello, Hello and welcome back to Bitcoin Beats.
As the title suggests, this is Version 2 of The Breakout Machine. Unlike the previous version, this one has been fine-tuned to work best on Binance Futures(BTCUSDT).
The stats shown below are from 2020.
PLEASE BE CAREFUL WITH YOUR LEVERAGE AND DON'T GET REKT.
Trade at your own risk! Good luck!
This strategy takes MACD and Volume spikes to calculate pumps and dumps in the bitcoin market.
I've also added custom backtesting inputs and leverage for you all to experiment with and see the profitability of the Strategy.
Alerts version coming soon...
Thank you, And goodbye, from Bitcoin Beats.