ISS V5 Strategy for ETHUSDTSimple long/short strategy. Using MACD and few more oscillators.
Optimized for ETHUSDT 4h, Enjoy!
Recherche dans les scripts pour "macd"

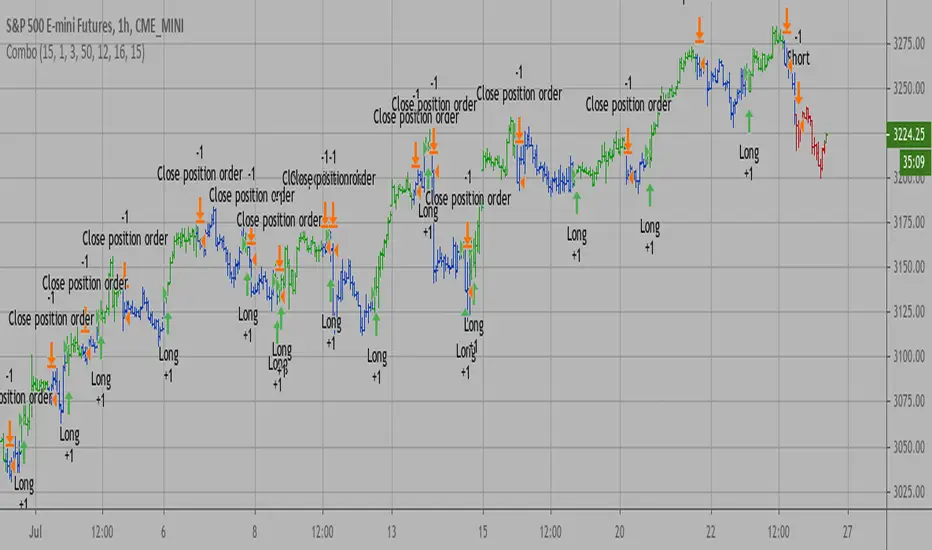
Combo Backtest 123 Reversal & Ergodic MACD This is combo strategies for get a cumulative signal.
First strategy
This System was created from the Book "How I Tripled My Money In The
Futures Market" by Ulf Jensen, Page 183. This is reverse type of strategies.
The strategy buys at market, if close price is higher than the previous close
during 2 days and the meaning of 9-days Stochastic Slow Oscillator is lower than 50.
The strategy sells at market, if close price is lower than the previous close price
during 2 days and the meaning of 9-days Stochastic Fast Oscillator is higher than 50.
Second strategy
This is one of the techniques described by William Blau in his book
"Momentum, Direction and Divergence" (1995). If you like to learn more,
we advise you to read this book. His book focuses on three key aspects
of trading: momentum, direction and divergence. Blau, who was an electrical
engineer before becoming a trader, thoroughly examines the relationship
between price and momentum in step-by-step examples. From this grounding,
he then looks at the deficiencies in other oscillators and introduces some
innovative techniques, including a fresh twist on Stochastics. On directional
issues, he analyzes the intricacies of ADX and offers a unique approach to help
define trending and non-trending periods.
Blau`s indicator is like usual MACD, but it plots opposite of meaningof
stndard MACD indicator.
WARNING:
- For purpose educate only
- This script to change bars colors.
T3 ICL MACD STRATEGY
Backtested manually and received approx 60% winrate. Tradingview strategy tester is skewed because this program does not specify when to sell at profit target or at a stop loss.
Uses 1 min for entry and a longer time frame for confirmation (5,10,15, etc..) (Not sure what the yellow arrows are in the picture but they can be ignored)
Ideal Long Entry - The algo uses T3 moving average (T3) and the Ichimoku Conversion Line (ICL) to determine when to enter a long or short position. In this case we are going to showcase what causes the algo to alert long. It first checks to see if the the ICL is greater than T3. Once that condition is met T3 must be green in order to enter long and finally the last closing price has to be greater than the ICL. You can use the MACD to further verify a long trend as well!
Ideal Short Entry - The algo uses T3 moving average (T3) and the Ichimoku Conversion Line (ICL) to determine when to enter a long or short position. In this case we are going to showcase what causes the algo to alert short. It first checks to see if the the ICL is less than T3. Once that condition is met T3 must be red in order to enter short and finally the last closing price has to be less than the ICL. You can use the MACD to further verify a long trend as well!

Ichimoku Cloud & ADX & DMI & MACD [tg1]Hi There! Sharing my strategy that is mainly build on Ichimoku Kinko Hyo and its Tenkan and Kijun crosses.
In addition, I added a few other indicators to have less false breakout signals. See more details below:
Long conditions :
1) Tenkan crosses over Kijun
2) Tenkan & Kijun > Kumo
3) Close > Kumo
4) Chikou > Kumo (-n periods)
5) ADX > Custom value
6) DI+ > DI-
7) MACD > Signal
8) SMA > 200
Short conditions are simply the other way around. This indicator has been mainly tested and tuned for BTCUSDT.

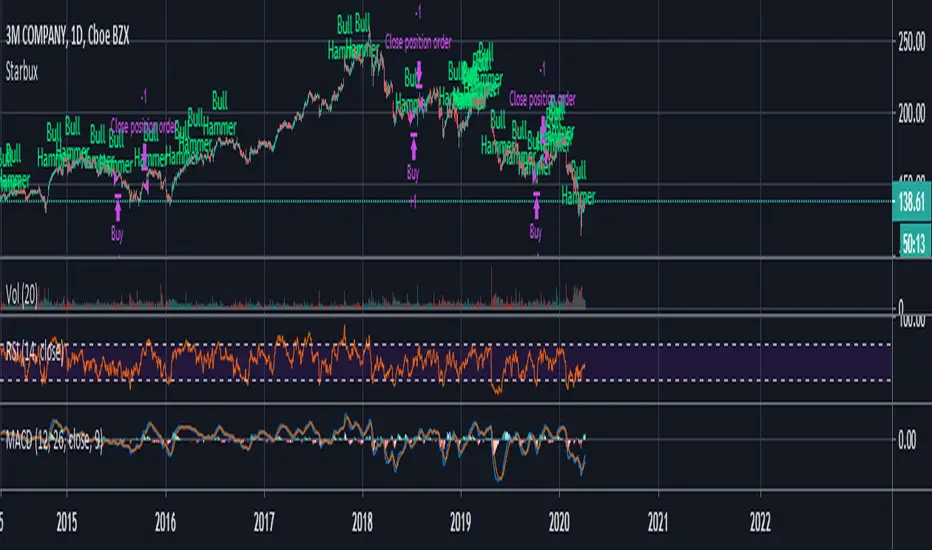
StarbuxI made this in starbucks .
Bullish hammer trading signal algorithm
using MACD for trend determination and holding period.
Crypto_Melih StrategyThis indicator is formed by combining 3 different indicators.
1 - MOST: Moving Stop Loss Indicator
2 - Inverse Fisher Transform on STOCHASTIC
3 - MACD
When MOST gives BUY signal; If Inverse Fisher Transform on STOCHASTIC and MACD states are positive, the process is entered.
When the MOST gives the SELL signal, the process is exited.

New RenaissancePrelim version of MACD long entry and exit with custom time frame selector.
To do:
Add Stoch and Stoch RSI criteria.

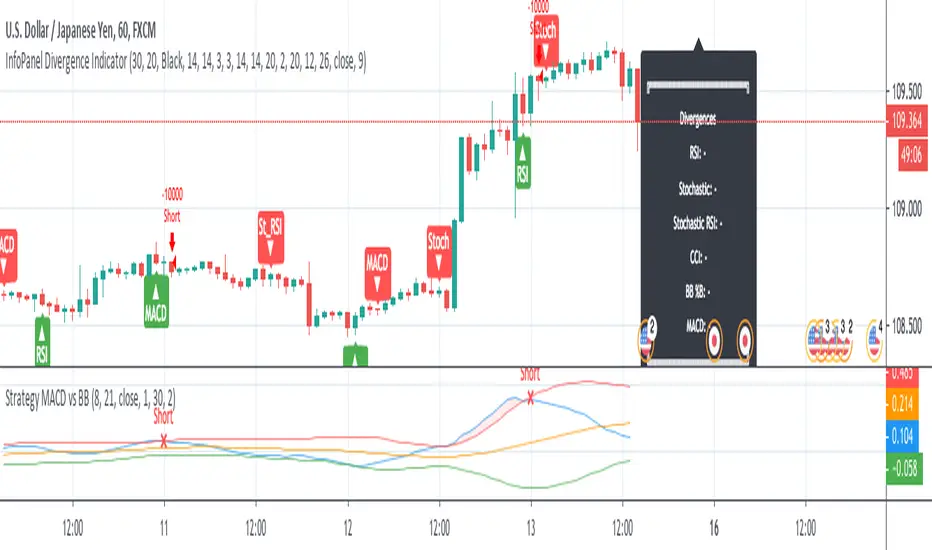
Strategy MACD vs BBStrategy based on MACD and Bollinger Bands, where BBs are calculatend from macd signal.
Strategy doesn't open at breakout of bands but it waits for a pullback.
Upper and lower bands are used as resistance and support.
There are various parameters that can be optimized.
I have also a study with alerts.
Please use comment section for any feedback or cointact me if you need support.
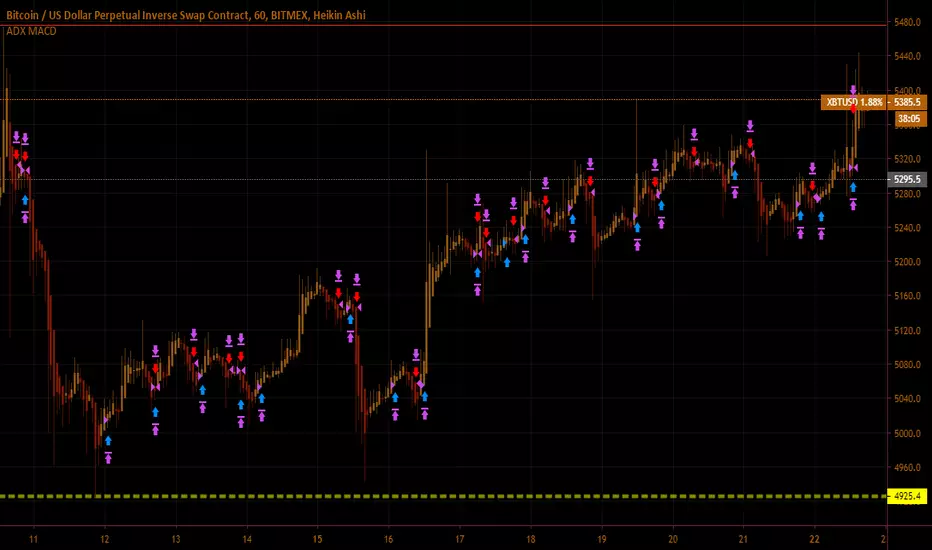
BitMEX pump catcher - MACDThis is a modified version of the BitMEX pump catcher by Jomy .
I have tweaked the algorithm to use the difference in MACD to get the correct direction of entries rather than using direction of candles which are not always indicative of trend direction. These changes increase net profit, profitable trades, while reducing drawdown.
Below is a copy and paste of Jomy's explanation of the algorithm.
What is going on here? This strategy is pretty simple. We start by measuring a very long chunk of volume history on BitMEX:XBTUSD 1 hour chart to find out if the current volume is high or low. At 1.0 the indicator is showing we are at 100% of normal historical volume . The blue line is a measure of recent volume! This indicator gets interested when the volume drops below 90% of the regular volume (0.9), and then comes back up over 90%. There's usually a pump of increased price activity during this time. When the 0.9 line is crossed by the blue line, the indicator surveys the last 2 bars of price action to figure out which way we're going, long or short. Green is long. Red is short. To exit the trade we use a 7 period fast ema of the volume crossing under an 11 ema slower period which shows declining interest in the market signifying an end to the pump or dump. The profit factor is quite high with 5x leverage, but historically we see 50% drawdown -- very risky. 1x leverage looks nice and tight with very low drawdown. Play with the inputs to see what matches your own risk profile. I would not recommend taking this into much lower timeframes as trading fees are not included in the profit calculations. Please don't get burned trading on stupid high leverage. This indicator is probably not going to work well on alts, as Bitcoin FOMO build up and behavior is different. This whole indicator is tuned to Bitcoin , and attempts to trade only the meatiest part of the market moves.
Jomy should get full credit to this indicator

AlgoNinja RSI/MACDAlgoNinja buy/sell signal based on MADC/RSI/StochRSI data. BETA - Use at your own risk!

DB Rsi-Stoch-Macd StrategyA Long/Short strategy based on combined signals from MACD, Stochastics, ATR, RSI and VIX.
Developed with input from the BoldTimers Investment group.


E-Z's Slither Maker Strategy v0.01This is a strategy I built based on custom MACD and ADX/DMI settings.
Works best for scalping the one hour.
If you run into any issues let me know.
If this script makes you money and feel thankful for all my hard work, you can donate to the addresses below <3
BTC: 3CS6VqDrCf7XRn46bqcXMUZQecbQJ7TKfs
BCC/BCH: bitcoincash:qqrca9z7w2gl2wevjvry6uv7quhcn7kaycx43r34tf
DOGE: AC9tZB6NMoWpvMZmmtop5yXsv7GhHYAxWd
LTC: 34HajDFE3aDWgs1etG3851CLvqNV9pg5Te
Volatile Stocks - Simple Strategy w/Profit and StopThis strategy is based off of a script I wrote for another highly volatile asset, cryptocurrencies. It prints BUY and SELL signals based off of inputs that you can specify. I used this script as a time saver. If there is no signal on the chart, I'm less interested in analyzing it.
BUY SIGNALS
Bullish EMA Cross
Positive MACD Cross
Single-candle gains
SELL SIGNALS
Profit %
Stop Loss %
Naturally, I don't trade based off of the BUY and SELL signals alone, but it does help me identify the most important charts to look at.

STOCH MACD SAR RSI V2 STRAT 15M// Strategy based on Stochastic Oscillator ( STOCH ), Moving Average Convergence / Divergence ( MACD ), Parabolic Stop and Reverse (PSAR) and Relative Strength Index (RSI)
// In the second version RSI added
// Adapted for15M time frame
// Created and based on Binance chart
// Working with comission
// No repaints

STOCH MACD SAR Strategy 15M// Strategy based on Stochastic Oscillator (STOCH), Moving Average Convergence / Divergence (MACD) and Parabolic Stop and Reverse (PSAR)
// Adapted for15M time frame
// Created and based on Binance chart
// Working with comission
// No repaints

Matt's MACD Algo v1This script is meant to be viewed with the Heiken Ashi candlestick chart. I use it for pretty much everything. It has a lot of extra stuff just for visual reference, but the trades are based on the MACD (3,5,9) indicator. I found that speeding up the intervals of the MACD makes for a much more reactive chart. In this heavily volatile market, it has been performing well. If the market is not very volatile, it tends to have too many noisy signals. Any help or criticism would be greatly appreciated.


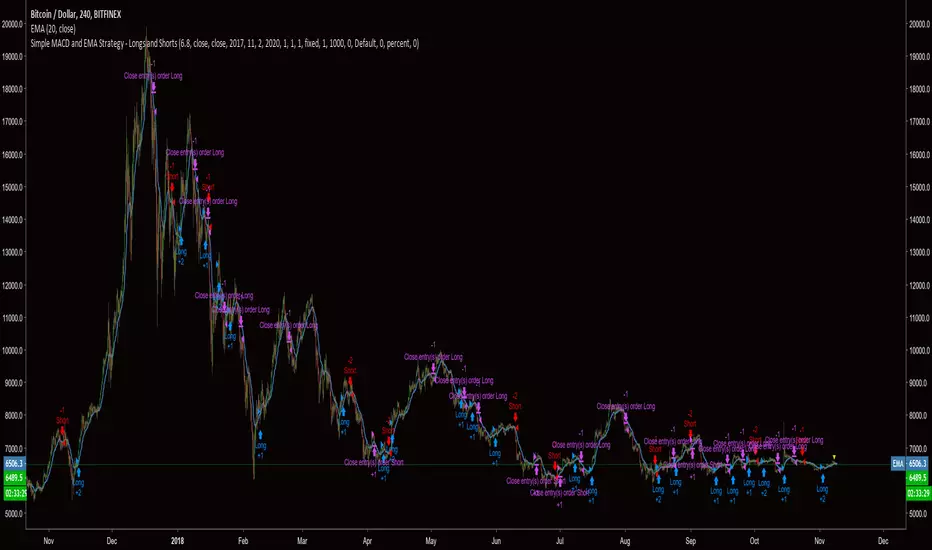
Simple MACD and EMA StrategyThis is a basic Simple MACD and EMA trend following strategy. I will add shorts to the strategy very soon. Best results seem to be on the 4HR charts.
VB Strategy + MACD
This strategy should be used with VB Indicator PRO.
This Strategy used volume flow and bollinger bands + MACD

Confirmed Strength Index - MACD*RESULTS ARE FROM x10 LEVERAGING*
Uses the MACD principle with CSI, looks for bottoms and tops to short and long. Favorite to use.

RSI MACD with conditional MA indicator backtestingbacktesting for the RSI MACD with conditional MA indicator:
RSI + MACD Strategy (ETHUSD 1D)This script uses a combination of MACD, RSI and Stochastic RSI to find tops and bottoms with a ~70% profit rate. While it is successful with all of the top market coins, ETHUSD is by far showing the best results. It is fine tuned only for 1D charts, any other time interval results in losses. It's been tested with shorting as well, but longing + selling gives better returns.
Each market is slightly different, but backtests from October 2015 on Poloniex show almost 300,000%(!!) gains. While it is unlikely to produce such gains going forward (but who knows!), the profit rate is still much higher than buy–and–hold on any long-term backtests. As always, don't follow a script blindly and use your own best judgement when trading.
DISCLAIMER:
This script should be used for educational purposes only, and is not intended to provide trading advice. Use at your own risk!
