SB_Elder Impulse SystemThe strategy is based on LazyBear's Elder Impulse System
Strategy(in layman terms):
Long: When the green bar in the Elder Impulse System's indicator shows up
Short: When the red bar in the Elder Impulse System's indicator shows up
Close trade/Profit booking: When the blue bar in the Elder Impulse System's indicator shows up
Original Idea:
Message in the script if you think of any modifications/ enhancements.
Donations/Tips... :) -
BTC: 1BjswGcRR6c23pka7qh5t5k56j46cuyyy2
ETH: 0x64fed71c9d6c931639c7ba4671aeb6b05e6b3781
LTC: LKT2ykQ8QSzzfTDB6Tnsf12xwYPjgq95h4
Recherche dans les scripts pour "macd"

Strategy Testing Advanced Buy/Sell SignalsThis is strategy testing my Advanced Buy/Sell Signal script found here
TradingView is limited to strategy testing based on close price, so this is actually buying/selling a day later than each arrow. This does not repaint- arrows appear in realtime on the actual script, which is nice because that makes it useful.

HA+I strategy by C.Molti fix sopratutto al riconoscimento del trend. non ci siamo ancora ma credo si tratti solo di fine tuning dei parametri ;)


MACD Strategy- Script Example how to use % SL in your script ** Tired of Script showing a trade that you stopped out on but is still long on your script? Not any more**
I used Pine script to create realistic trading scenarios for SL users. Now your scripts will reflect what you see on the order book.
a=0.0
a := (*Insert buy condition*)? close: nz(a )
plot(0.98*a, color= green) //2%SL for BUY
b=0.0
b:= (*Insert Short condition*) ? close: nz(b )
plot(1.02*b, color= red) //2% SL for Short
Please check the script on how to implement this :)


🚀⚠️ Aggressive + Confirmed Long Strategy (v2)//@version=5
strategy("🚀⚠️ Aggressive + Confirmed Long Strategy (v2)",
overlay=true,
pyramiding=0,
initial_capital=10000,
default_qty_type=strategy.percent_of_equity,
default_qty_value=10, // % of equity per trade
commission_type=strategy.commission.percent,
commission_value=0.05)
// ========= Inputs =========
lenRSI = input.int(14, "RSI Length")
lenSMA1 = input.int(20, "SMA 20")
lenSMA2 = input.int(50, "SMA 50")
lenBB = input.int(20, "Bollinger Length")
multBB = input.float(2, "Bollinger Multiplier", step=0.1)
volLen = input.int(20, "Volume MA Length")
smaBuffP = input.float(1.0, "Margin above SMA50 (%)", step=0.1)
confirmOnClose = input.bool(true, "Confirm signals only after candle close")
useEarly = input.bool(true, "Allow Early entries")
// Risk
atrLen = input.int(14, "ATR Length", minval=1)
slATR = input.float(2.0, "Stop = ATR *", step=0.1)
tpRR = input.float(2.0, "Take-Profit RR (TP = SL * RR)", step=0.1)
useTrail = input.bool(false, "Use Trailing Stop instead of fixed SL/TP")
trailATR = input.float(2.5, "Trailing Stop = ATR *", step=0.1)
moveToBE = input.bool(true, "Move SL to breakeven at 1R TP")
// ========= Indicators =========
// MAs
sma20 = ta.sma(close, lenSMA1)
sma50 = ta.sma(close, lenSMA2)
// RSI
rsi = ta.rsi(close, lenRSI)
rsiEarly = rsi > 45 and rsi < 55
rsiStrong = rsi > 55
// MACD
= ta.macd(close, 12, 26, 9)
macdCross = ta.crossover(macdLine, signalLine)
macdEarly = macdCross and macdLine < 0
macdStrong = macdCross and macdLine > 0
// Bollinger
= ta.bb(close, lenBB, multBB)
bollBreakout = close > bbUpper
// Candle & Volume
bullishCandle = close > open
volCondition = volume > ta.sma(volume, volLen)
// Price vs MAs
smaCondition = close > sma20 and close > sma50 and close > sma50 * (1 + smaBuffP/100.0)
// Confirm-on-close helper
useSignal(cond) =>
confirmOnClose ? (cond and barstate.isconfirmed) : cond
// Entries
confirmedEntry = useSignal(rsiStrong and macdStrong and bollBreakout and bullishCandle and volCondition and smaCondition)
earlyEntry = useSignal(rsiEarly and macdEarly and close > sma20 and bullishCandle) and not confirmedEntry
longSignal = confirmedEntry or (useEarly and earlyEntry)
// ========= Risk Mgmt =========
atr = ta.atr(atrLen)
slPrice = close - atr * slATR
tpPrice = close + (close - slPrice) * tpRR
trailPts = atr * trailATR
// ========= Orders =========
if strategy.position_size == 0 and longSignal
strategy.entry("Long", strategy.long)
if strategy.position_size > 0
if useTrail
// Trailing Stop
strategy.exit("Exit", "Long", trail_points=trailPts, trail_offset=trailPts)
else
// Normal SL/TP
strategy.exit("Exit", "Long", stop=slPrice, limit=tpPrice)
// Move SL to breakeven when TP1 hit
if moveToBE and high >= tpPrice
strategy.exit("BE", "Long", stop=strategy.position_avg_price)
// ========= Plots =========
plot(sma20, title="SMA 20", color=color.orange, linewidth=2)
plot(sma50, title="SMA 50", color=color.new(color.blue, 0), linewidth=2)
plot(bbUpper, title="BB Upper", color=color.new(color.fuchsia, 0))
plot(bbBasis, title="BB Basis", color=color.new(color.gray, 50))
plot(bbLower, title="BB Lower", color=color.new(color.fuchsia, 0))
plotshape(confirmedEntry, title="🚀 Confirmed", location=location.belowbar,
color=color.green, style=shape.labelup, text="🚀", size=size.tiny)
plotshape(earlyEntry, title="⚠️ Early", location=location.belowbar,
color=color.orange, style=shape.labelup, text="⚠️", size=size.tiny)
// ========= Alerts =========
alertcondition(confirmedEntry, title="🚀 Confirmed Entry", message="🚀 {{ticker}} confirmed entry on {{interval}}")
alertcondition(earlyEntry, title="⚠️ Early Entry", message="⚠️ {{ticker}} early entry on {{interval}}")

Hilly's Advanced Crypto Scalping Strategy - 5 Min ChartTo determine the "best" input parameters for the Advanced Crypto Scalping Strategy on a 5-minute chart, we need to consider the goals of optimizing for profitability, minimizing false signals, and adapting to the volatile nature of cryptocurrencies. The default parameters in the script are a starting point, but the optimal values depend on the specific cryptocurrency pair, market conditions, and your risk tolerance. Below, I'll provide recommended input values based on common practices in crypto scalping, along with reasoning for each parameter. I’ll also suggest how to fine-tune them using TradingView’s backtesting and optimization tools.
Recommended Input Parameters
These values are tailored for a 5-minute chart for liquid cryptocurrencies like BTC/USD or ETH/USD on exchanges like Binance or Coinbase. They aim to balance signal frequency and accuracy for day trading.
Fast EMA Length (emaFastLen): 9
Reasoning: A 9-period EMA is commonly used in scalping to capture short-term price movements while remaining sensitive to recent price action. It reacts faster than the default 10, aligning with the 5-minute timeframe.
Slow EMA Length (emaSlowLen): 21
Reasoning: A 21-period EMA provides a good balance for identifying the broader trend on a 5-minute chart. It’s slightly longer than the default 20 to reduce noise while confirming the trend direction.
RSI Length (rsiLen): 14
Reasoning: The default 14-period RSI is a standard choice for momentum analysis. It works well for detecting overbought/oversold conditions without being too sensitive on short timeframes.
RSI Overbought (rsiOverbought): 75
Reasoning: Raising the overbought threshold to 75 (from 70) reduces false sell signals in strong bullish trends, which are common in crypto markets.
RSI Oversold (rsiOversold): 25
Reasoning: Lowering the oversold threshold to 25 (from 30) filters out weaker buy signals, ensuring entries occur during stronger reversals.
MACD Fast Length (macdFast): 12
Reasoning: The default 12-period fast EMA for MACD is effective for capturing short-term momentum shifts in crypto, aligning with scalping goals.
MACD Slow Length (macdSlow): 26
Reasoning: The default 26-period slow EMA is a standard setting that works well for confirming momentum trends without lagging too much.
MACD Signal Smoothing (macdSignal): 9
Reasoning: The default 9-period signal line is widely used and provides a good balance for smoothing MACD crossovers on a 5-minute chart.
Bollinger Bands Length (bbLen): 20
Reasoning: The default 20-period Bollinger Bands are effective for identifying volatility breakouts, which are key for scalping in crypto markets.
Bollinger Bands Multiplier (bbMult): 2.0
Reasoning: A 2.0 multiplier is standard and captures most price action within the bands. Increasing it to 2.5 could reduce signals but improve accuracy in highly volatile markets.
Stop Loss % (slPerc): 0.8%
Reasoning: A tighter stop loss of 0.8% (from 1.0%) suits the high volatility of crypto, helping to limit losses on false breakouts while keeping risk manageable.
Take Profit % (tpPerc): 1.5%
Reasoning: A 1.5% take-profit target (from 2.0%) aligns with scalping’s goal of capturing small, frequent gains. Crypto markets often see quick reversals, so a smaller target increases the likelihood of hitting profits.
Use Candlestick Patterns (useCandlePatterns): True
Reasoning: Enabling candlestick patterns (e.g., engulfing, hammer) adds confirmation to signals, reducing false entries in choppy markets.
Use Volume Filter (useVolumeFilter): True
Reasoning: The volume filter ensures signals occur during high-volume breakouts, which are more likely to sustain in crypto markets.
Signal Arrow Size (signalSize): 2.0
Reasoning: Increasing the arrow size to 2.0 (from 1.5) makes buy/sell signals more visible on the chart, especially on smaller screens or volatile price action.
Background Highlight Transparency (bgTransparency): 85
Reasoning: A slightly higher transparency (85 from 80) keeps the background highlights subtle but visible, avoiding chart clutter.
How to Apply These Parameters
Copy the Script: Use the Pine Script provided in the previous response.
Paste in TradingView: Open TradingView, go to the Pine Editor, paste the code, and click "Add to Chart."
Set Parameters: In the strategy settings, manually input the recommended values above or adjust them via the input fields.
Test on a 5-Minute Chart: Apply the strategy to a liquid crypto pair (e.g., BTC/USDT, ETH/USDT) on a 5-minute chart.
Fine-Tuning for Optimal Performance
To find the absolute best parameters for your specific trading pair and market conditions, use TradingView’s Strategy Tester and optimization features:
Backtesting:
Run the strategy on historical data for your chosen pair (e.g., BTC/USDT on Binance).
Check metrics like Net Profit, Profit Factor, Win Rate, and Max Drawdown in the Strategy Tester.
Focus on a sample period of at least 1–3 months to capture various market conditions (bull, bear, sideways).
Parameter Optimization:
In the Strategy Tester, click the settings gear next to the strategy name.
Enable optimization for key inputs like emaFastLen (test range: 7–12), emaSlowLen (15–25), slPerc (0.5–1.5), and tpPerc (1.0–3.0).
Run the optimization to find the combination with the highest net profit or best Sharpe ratio, but avoid over-optimization (curve-fitting) by testing on out-of-sample data.
Market-Specific Adjustments:
Volatile Pairs (e.g., DOGE/USDT): Use tighter stop losses (e.g., 0.5–0.7%) and smaller take-profit targets (e.g., 1.0–1.2%) to account for rapid price swings.
Stable Pairs (e.g., BTC/USDT): Slightly wider stop losses (e.g., 1.0–1.2%) and take-profit targets (e.g., 1.8–2.5%) may work better.
Trending Markets: Increase emaSlowLen (e.g., to 25–30) to follow stronger trends.
Choppy Markets: Tighten bbMult (e.g., to 1.8) and lower rsiOverbought/rsiOversold (e.g., to 70/30) to filter noise.
Forward Testing:
After backtesting, run the strategy in real-time on a demo account for 1–2 weeks to validate performance under current market conditions.
Important Notes
No Universal "Best" Numbers: Optimal parameters vary by crypto pair, exchange, and market conditions (e.g., bull vs. bear market). The suggested values are a starting point based on common scalping practices.
Risk Management: Never risk more than 1–2% of your account per trade. Adjust position sizing in TradingView’s strategy settings to align with your risk tolerance.
Market Volatility: Crypto markets are highly volatile. Test the strategy on your specific pair and adjust parameters if signals are too frequent or too rare.
Not Financial Advice: This is an educational tool. Backtest thoroughly and use a demo account before trading with real funds.
If you want me to generate a chart showing backtest performance for specific parameters or to tweak the script further (e.g., adding more indicators or adjusting signal logic), let me know!can you add clear buy ans sell signs above the candles in this codeTo add clear buy and sell signals above the candles in the provided Pine Script, I'll modify the existing code to include prominent text labels directly above (for sell signals) and below (for buy signals) the candles. These labels will be larger, color-coded, and positioned to avoid clutter, ensuring they are easily visible on the chart. The core strategy logic (EMA, RSI, MACD, Bollinger Bands, candlestick patterns, and volume filter) will remain unchanged, and I'll reuse the same artifact_id since this is an update to the previous script.AdvancedCryptoScalpingStrategy.pinex-pine

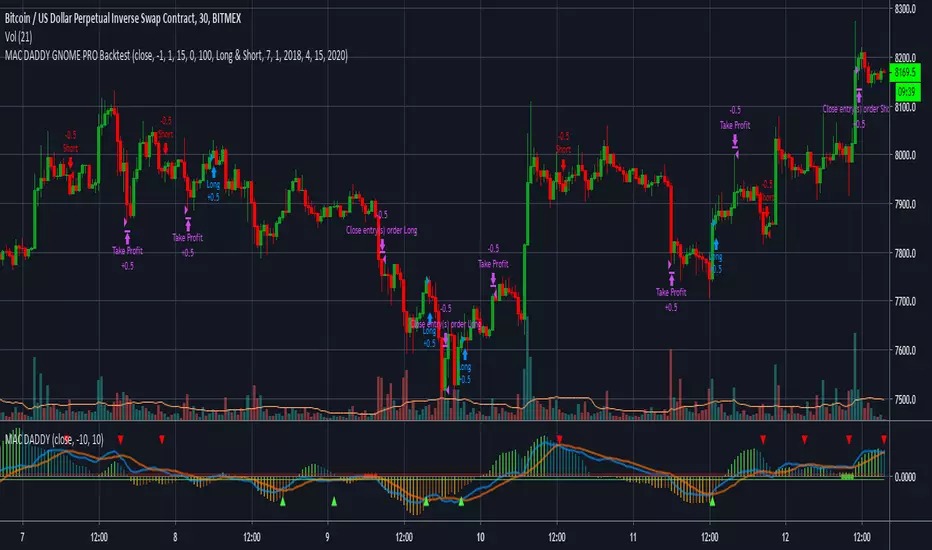
MAC DADDY GNOME PRO BacktestHello Fellow Traders!
-------------------------------------------
This is the newest addition to Gnome Alerts PRO!
This is one of the newer scripts that we are using for scalping on the lower time frames on Bitmex & Binance.
This is a script that can be used on all time frames and includes back-testing. All of our scripts included back-testing and BUY & SELL alerts.
This Script allows you to fire Long, Short, or Flip with Both
Also Includes TTM 2.77% Squeeze Bubbles for Manual trading.
INCLUDES:
------------------------
*Autoview Ready*
BUY ALERTS
- supports pyramiding
- sell based of %gain
SELL ALERTS
- supports pyramiding
- sell based of %gain
- stop loss configured
- sell on gain configured
Backtesting is also available!
More info on how gain access in my profile!
SPY 1 Minute Day TraderWhen scalping options, users are looking for where breakouts are going to occur instead of sitting thru areas choppy price action that drain delta and cause them to lose value even if price is up trending. This script tries to identify when a trend reversal is expected based on one minute price action on the SPY. It alerts users to prepare for potential breakout when 5 out of the 6 key optimized parameters are discovered by showing a white L or S. Once all six trigger, it informs the user at the close of that candle with a golden triangle with Pivot Up or Pivot Down. As scalping options is something that is expected to be short in duration, a take profit and stop loss of 30 cents of price actions is established. If five or more parameters occur after the pivot is initiated, then stop losses and take profits are adhered to; however, if there are less, then it waits to take profit or stop the trade, as likely it is just noise and it will finish trend with an additional breakout.
This script has been created to take into account how the following variables impact trend for SPY 1 Minute:
ema vs 13 ema : A cross establishes start of trend
MACD (Line, Signal & Slope) : If you have momentum
ADX : if you are trending
RSI : If the trend has strength
The above has been optimized to determine pivot points in the trend using key values for these 6 indicators
bounce up = ema5 > ema13 and macdLine < .5 and adx > 20 and macdSlope > 0 and signalLine > -.1 and rsiSignal > 40
bounce down = ema5 < ema13 and macdLine > -.5 and adx > 20 and signalLine < 0 and macdSlope < 0 and rsiSignal < 60
White L's indicate that 5 of 6 conditions are met due to impending uptrend w/ missing one in green below it
Yellow L's indicate that 6 of 6 conditions still are met
White S's indicate that 5 of 6 conditions are met due to impending downtrend w/ missing condition in red above it
Yellow S's indicate that 6 of 6 conditions still are met
After a downtrend or uptrend is established, once it closes it can't repeat for 10 minutes
Won't open any trades on last two minutes of any hours to avoid volatility
Will close any open trades going into last minute of hour to avoid large overnight random swings.

Advanced Adaptive Grid Trading StrategyThis strategy employs an advanced grid trading approach that dynamically adapts to market conditions, including trend, volatility, and risk management considerations. The strategy aims to capitalize on price fluctuations in both rising (long) and falling (short) markets, as well as during sideways movements. It combines multiple indicators to determine the trend and automatically adjusts grid parameters for more efficient trading.
How it Works:
Trend Analysis:
Short, long, and super long Moving Averages (MA) to determine the trend direction.
RSI (Relative Strength Index) to identify overbought and oversold levels, and to confirm the trend.
MACD (Moving Average Convergence Divergence) to confirm momentum and trend direction.
Momentum indicator.
The strategy uses a weighted scoring system to assess trend strength (strong bullish, moderate bullish, strong bearish, moderate bearish, sideways).
Grid System:
The grid size (the distance between buy and sell levels) changes dynamically based on market volatility, using the ATR (Average True Range) indicator.
Grid density also adapts to the trend: in a strong trend, the grid is denser in the direction of the trend.
Grid levels are shifted depending on the trend direction (upwards in a bear market, downwards in a bull market).
Trading Logic:
The strategy opens long positions if the trend is bullish and the price reaches one of the lower grid levels.
It opens short positions if the trend is bearish and the price reaches one of the upper grid levels.
In a sideways market, it can open positions in both directions.
Risk Management:
Stop Loss for every position.
Take Profit for every position.
Trailing Stop Loss to protect profits.
Maximum daily loss limit.
Maximum number of positions limit.
Time-based exit (if the position is open for too long).
Risk-based position sizing (optional).
Input Options:
The strategy offers numerous settings that allow users to customize its operation:
Timeframe: The chart's timeframe (e.g., 1 minute, 5 minutes, 1 hour, 4 hours, 1 day, 1 week).
Base Grid Size (%): The base size of the grid, expressed as a percentage.
Max Positions: The maximum number of open positions allowed.
Use Volatility Grid: If enabled, the grid size changes dynamically based on the ATR indicator.
ATR Length: The period of the ATR indicator.
ATR Multiplier: The multiplier for the ATR to fine-tune the grid size.
RSI Length: The period of the RSI indicator.
RSI Overbought: The overbought level for the RSI.
RSI Oversold: The oversold level for the RSI.
Short MA Length: The period of the short moving average.
Long MA Length: The period of the long moving average.
Super Long MA Length: The period of the super long moving average.
MACD Fast Length: The fast period of the MACD.
MACD Slow Length: The slow period of the MACD.
MACD Signal Length: The period of the MACD signal line.
Stop Loss (%): The stop loss level, expressed as a percentage.
Take Profit (%): The take profit level, expressed as a percentage.
Use Trailing Stop: If enabled, the strategy uses a trailing stop loss.
Trailing Stop (%): The trailing stop loss level, expressed as a percentage.
Max Loss Per Day (%): The maximum daily loss, expressed as a percentage.
Time Based Exit: If enabled, the strategy exits the position after a certain amount of time.
Max Holding Period (hours): The maximum holding time in hours.
Use Risk Based Position: If enabled, the strategy calculates position size based on risk.
Risk Per Trade (%): The risk per trade, expressed as a percentage.
Max Leverage: The maximum leverage.
Important Notes:
This strategy does not guarantee profits. Cryptocurrency markets are volatile, and trading involves risk.
The strategy's effectiveness depends on market conditions and settings.
It is recommended to thoroughly backtest the strategy under various market conditions before using it live.
Past performance is not indicative of future results.

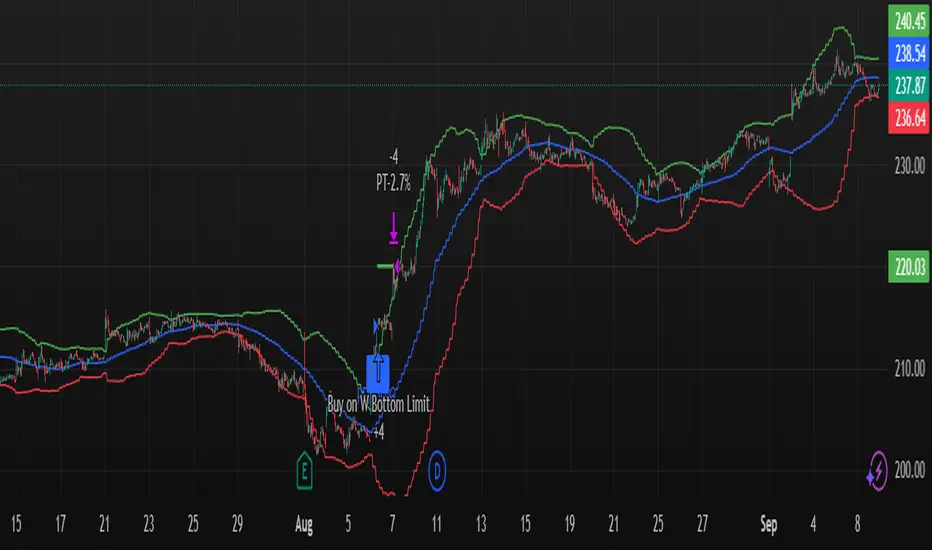
W Bottom Reversal Strategy W Bottom Reversal Strategy (15m-close entries; intrabar TP; daily MACD exit; JSON alerts v49.3-expire2)
Overview
A precision reversal strategy designed for 15-minute charts on liquid symbols. It detects a capitulation-and-stabilization “W” base using 1-hour (1H) context, confirms momentum improvement, then enters only on bar close to avoid early/“ghost” signals. Exits combine a fast intrabar take-profit (~2.7%) with a daily MACD risk-off exit that closes positions when higher-timeframe momentum turns against the setup.
How it works (high-level, matching code)
1H volatility + oversold gate (arming)
Compute 1H Bollinger-style bands (basis = SMA(close, bbLength=20), stdev multiplier bbMult=2.0).
Arm the setup when a 1H bar closes with price < 1H lower band and 1H RSI( rsiLength=14 ) < rsiThreshold (default 20.0).
1H momentum flip → pending entry
When a new 1H bar closes and 1H MACD line (EMA12−EMA26) crosses above 0 while armed and flat, set an entryPending flag.
This does not enter yet—it prepares a confirmed, bar-close entry on the lower timeframe.
Bar-close execution on the chart timeframe (15m)
On the next 15m bar close (or within N bars, see below) and still flat, fire the entry using a limit order at close × (1 − 0.00001) (≈ 0.001% below close) to reduce slippage and maintain chart/alert alignment.
Anti-late filter (no stale triggers)
If the pending entry doesn’t trigger within N chart bars (input: “Pending entry valid for N chart bars”, default 1, range 1–8), it expires and the arm state resets. This prevents late fills long after the 1H confirmation.
Exit logic
Primary: Standing intrabar take-profit at +2.7% from the average entry price (managed via strategy.exit limit).
Risk-off: On daily bar close, if Daily MACD line (EMA12−EMA26) crosses under 0, close the position (flat on daily momentum flip).
Default Properties (used for this publication)
Timeframe: 15m (with 1H and Daily higher-timeframe confirmations via request.security)
Initial capital: $10,000
Position sizing: Percent of equity = 10% per trade (enters only when flat; no stacking while in a position)
Commission: 0.05% per side
Slippage: Recommend 1 tick in Strategy Properties for realistic fills
Inputs exposed:
BB Length: 20 • BB Multiplier: 2.0
RSI Length: 14 • RSI Threshold: 20.0
MACD: Short 12, Long 26, Signal 9 (signal kept for compatibility; logic uses MACD line vs 0)
Pending entry valid for N chart bars: default 1 (1–8)
Execution behavior (per code):
calc_on_every_tick = false (evaluates on bar close)
process_orders_on_close = true (orders placed at bar close)
Limit entry at close −0.001%
Intrabar TP (2.7%)
Daily risk-off exit on MACD<0 at daily bar close
Alerts (exact behavior in code)
Uses alert() function calls with standardized JSON.
Set your alert to “Only alert() function calls” and “Once per bar close.”
Two events are emitted:
LONG_CONFIRMED on entry fire (15m bar close)
EXIT_CONFIRMED_DAILY_MACD on daily MACD<0 (daily bar close)
JSON fields include: event, version ("v49.3-expire2"), symbol, interval, price, and time.
How to use
Apply on liquid tickers (tight spreads, healthy volume).
Keep defaults initially; run across a broad, liquid watchlist to gather a proper sample.
For automation, route bar-close alerts to your executor; confirm broker lot/route settings and that limit orders at close −0.001% are acceptable.
Expect fewer signals in powerful trends; the daily risk-off helps cut failed bases.
Methodology & expectations (results transparency)
Evaluate on a dataset yielding 100+ trades before drawing conclusions.
Keep commission & slippage enabled (see defaults).
Risk sizing: With 10% of equity per trade and flat-to-flat entries, exposure aligns with typical 5–10% guidance.
No performance guarantees—outcomes depend on symbol selection, volatility regime, news, and execution quality.
Originality & value (vendor justification)
While it uses familiar building blocks (BB/RSI/MACD), the edge comes from the 1H volatility + oversold arming, 1H momentum flip, strict 15m bar-close limit execution, and the N-bar pending expiry that prevents stale triggers—paired with a dual-exit design (intrabar TP + daily risk-off). The focus is on reducing premature fills, keeping alerts 1:1 with chart marks, and capturing the first impulse out of a W-base.
Disclaimers
For educational purposes only; not financial advice. Paper-test first. Verify alerts, fills, and symbol liquidity with your broker before live use.
Changelog: v49.3-expire2 — Bar-close limit entries; anti-late pending window; standardized JSON alerts; intrabar 2.7% TP; daily MACD risk-off exit.
Dskyz (DAFE) Adaptive Regime - Quant Machine ProDskyz (DAFE) Adaptive Regime - Quant Machine Pro:
Buckle up for the Dskyz (DAFE) Adaptive Regime - Quant Machine Pro, is a strategy that’s your ultimate edge for conquering futures markets like ES, MES, NQ, and MNQ. This isn’t just another script—it’s a quant-grade powerhouse, crafted with precision to adapt to market regimes, deliver multi-factor signals, and protect your capital with futures-tuned risk management. With its shimmering DAFE visuals, dual dashboards, and glowing watermark, it turns your charts into a cyberpunk command center, making trading as thrilling as it is profitable.
Unlike generic scripts clogging up the space, the Adaptive Regime is a DAFE original, built from the ground up to tackle the chaos of futures trading. It identifies market regimes (Trending, Range, Volatile, Quiet) using ADX, Bollinger Bands, and HTF indicators, then fires trades based on a weighted scoring system that blends candlestick patterns, RSI, MACD, and more. Add in dynamic stops, trailing exits, and a 5% drawdown circuit breaker, and you’ve got a system that’s as safe as it is aggressive. Whether you’re a newbie or a prop desk pro, this strat’s your ticket to outsmarting the markets. Let’s break down every detail and see why it’s a must-have.
Why Traders Need This Strategy
Futures markets are a gauntlet—fast moves, volatility spikes (like the April 28, 2025 NQ 1k-point drop), and institutional traps that punish the unprepared. Meanwhile, platforms are flooded with low-effort scripts that recycle old ideas with zero innovation. The Adaptive Regime stands tall, offering:
Adaptive Intelligence: Detects market regimes (Trending, Range, Volatile, Quiet) to optimize signals, unlike one-size-fits-all scripts.
Multi-Factor Precision: Combines candlestick patterns, MA trends, RSI, MACD, volume, and HTF confirmation for high-probability trades.
Futures-Optimized Risk: Calculates position sizes based on $ risk (default: $300), with ATR or fixed stops/TPs tailored for ES/MES.
Bulletproof Safety: 5% daily drawdown circuit breaker and trailing stops keep your account intact, even in chaos.
DAFE Visual Mastery: Pulsing Bollinger Band fills, dynamic SL/TP lines, and dual dashboards (metrics + position) make signals crystal-clear and charts a work of art.
Original Craftsmanship: A DAFE creation, built with community passion, not a rehashed clone of generic code.
Traders need this because it’s a complete, adaptive system that blends quant smarts, user-friendly design, and DAFE flair. It’s your edge to trade with confidence, cut through market noise, and leave the copycats in the dust.
Strategy Components
1. Market Regime Detection
The strategy’s brain is its ability to classify market conditions into five regimes, ensuring signals match the environment.
How It Works:
Trending (Regime 1): ADX > 20, fast/slow EMA spread > 0.3x ATR, HTF RSI > 50 or MACD bullish (htf_trend_bull/bear).
Range (Regime 2): ADX < 25, price range < 3% of close, no HTF trend.
Volatile (Regime 3): BB width > 1.5x avg, ATR > 1.2x avg, HTF RSI overbought/oversold.
Quiet (Regime 4): BB width < 0.8x avg, ATR < 0.9x avg.
Other (Regime 5): Default for unclear conditions.
Indicators: ADX (14), BB width (20), ATR (14, 50-bar SMA), HTF RSI (14, daily default), HTF MACD (12,26,9).
Why It’s Brilliant:
Regime detection adapts signals to market context, boosting win rates in trending or volatile conditions.
HTF RSI/MACD add a big-picture filter, rare in basic scripts.
Visualized via gradient background (green for Trending, orange for Range, red for Volatile, gray for Quiet, navy for Other).
2. Multi-Factor Signal Scoring
Entries are driven by a weighted scoring system that combines candlestick patterns, trend, momentum, and volume for robust signals.
Candlestick Patterns:
Bullish: Engulfing (0.5), hammer (0.4 in Range, 0.2 else), morning star (0.2), piercing (0.2), double bottom (0.3 in Volatile, 0.15 else). Must be near support (low ≤ 1.01x 20-bar low) with volume spike (>1.5x 20-bar avg).
Bearish: Engulfing (0.5), shooting star (0.4 in Range, 0.2 else), evening star (0.2), dark cloud (0.2), double top (0.3 in Volatile, 0.15 else). Must be near resistance (high ≥ 0.99x 20-bar high) with volume spike.
Logic: Patterns are weighted higher in specific regimes (e.g., hammer in Range, double bottom in Volatile).
Additional Factors:
Trend: Fast EMA (20) > slow EMA (50) + 0.5x ATR (trend_bull, +0.2); opposite for trend_bear.
RSI: RSI (14) < 30 (rsi_bull, +0.15); > 70 (rsi_bear, +0.15).
MACD: MACD line > signal (12,26,9, macd_bull, +0.15); opposite for macd_bear.
Volume: ATR > 1.2x 50-bar avg (vol_expansion, +0.1).
HTF Confirmation: HTF RSI < 70 and MACD bullish (htf_bull_confirm, +0.2); RSI > 30 and MACD bearish (htf_bear_confirm, +0.2).
Scoring:
bull_score = sum of bullish factors; bear_score = sum of bearish. Entry requires score ≥ 1.0.
Example: Bullish engulfing (0.5) + trend_bull (0.2) + rsi_bull (0.15) + htf_bull_confirm (0.2) = 1.05, triggers long.
Why It’s Brilliant:
Multi-factor scoring ensures signals are confirmed by multiple market dynamics, reducing false positives.
Regime-specific weights make patterns more relevant (e.g., hammers shine in Range markets).
HTF confirmation aligns with the big picture, a quant edge over simplistic scripts.
3. Futures-Tuned Risk Management
The risk system is built for futures, calculating position sizes based on $ risk and offering flexible stops/TPs.
Position Sizing:
Logic: Risk per trade (default: $300) ÷ (stop distance in points * point value) = contracts, capped at max_contracts (default: 5). Point value = tick value (e.g., $12.5 for ES) * ticks per point (4) * contract multiplier (1 for ES, 0.1 for MES).
Example: $300 risk, 8-point stop, ES ($50/point) → 0.75 contracts, rounded to 1.
Impact: Precise sizing prevents over-leverage, critical for micro contracts like MES.
Stops and Take-Profits:
Fixed: Default stop = 8 points, TP = 16 points (2:1 reward/risk).
ATR-Based: Stop = 1.5x ATR (default), TP = 3x ATR, enabled via use_atr_for_stops.
Logic: Stops set at swing low/high ± stop distance; TPs at 2x stop distance from entry.
Impact: ATR stops adapt to volatility, while fixed stops suit stable markets.
Trailing Stops:
Logic: Activates at 50% of TP distance. Trails at close ± 1.5x ATR (atr_multiplier). Longs: max(trail_stop_long, close - ATR * 1.5); shorts: min(trail_stop_short, close + ATR * 1.5).
Impact: Locks in profits during trends, a game-changer in volatile sessions.
Circuit Breaker:
Logic: Pauses trading if daily drawdown > 5% (daily_drawdown = (max_equity - equity) / max_equity).
Impact: Protects capital during black swan events (e.g., April 27, 2025 ES slippage).
Why It’s Brilliant:
Futures-specific inputs (tick value, multiplier) make it plug-and-play for ES/MES.
Trailing stops and circuit breaker add pro-level safety, rare in off-the-shelf scripts.
Flexible stops (ATR or fixed) suit different trading styles.
4. Trade Entry and Exit Logic
Entries and exits are precise, driven by bull_score/bear_score and protected by drawdown checks.
Entry Conditions:
Long: bull_score ≥ 1.0, no position (position_size <= 0), drawdown < 5% (not pause_trading). Calculates contracts, sets stop at swing low - stop points, TP at 2x stop distance.
Short: bear_score ≥ 1.0, position_size >= 0, drawdown < 5%. Stop at swing high + stop points, TP at 2x stop distance.
Logic: Tracks entry_regime for PNL arrays. Closes opposite positions before entering.
Exit Conditions:
Stop-Loss/Take-Profit: Hits stop or TP (strategy.exit).
Trailing Stop: Activates at 50% TP, trails by ATR * 1.5.
Emergency Exit: Closes if price breaches stop (close < long_stop_price or close > short_stop_price).
Reset: Clears stop/TP prices when flat (position_size = 0).
Why It’s Brilliant:
Score-based entries ensure multi-factor confirmation, filtering out weak signals.
Trailing stops maximize profits in trends, unlike static exits in basic scripts.
Emergency exits add an extra safety layer, critical for futures volatility.
5. DAFE Visuals
The visuals are pure DAFE magic, blending function with cyberpunk flair to make signals intuitive and charts stunning.
Shimmering Bollinger Band Fill:
Display: BB basis (20, white), upper/lower (green/red, 45% transparent). Fill pulses (30–50 alpha) by regime, with glow (60–95 alpha) near bands (close ≥ 0.995x upper or ≤ 1.005x lower).
Purpose: Highlights volatility and key levels with a futuristic glow.
Visuals make complex regimes and signals instantly clear, even for newbies.
Pulsing effects and regime-specific colors add a DAFE signature, setting it apart from generic scripts.
BB glow emphasizes tradeable levels, enhancing decision-making.
Chart Background (Regime Heatmap):
Green — Trending Market: Strong, sustained price movement in one direction. The market is in a trend phase—momentum follows through.
Orange — Range-Bound: Market is consolidating or moving sideways, with no clear up/down trend. Great for mean reversion setups.
Red — Volatile Regime: High volatility, heightened risk, and larger/faster price swings—trade with caution.
Gray — Quiet/Low Volatility: Market is calm and inactive, with small moves—often poor conditions for most strategies.
Navy — Other/Neutral: Regime is uncertain or mixed; signals may be less reliable.
Bollinger Bands Glow (Dynamic Fill):
Neon Red Glow — Warning!: Price is near or breaking above the upper band; momentum is overstretched, watch for overbought conditions or reversals.
Bright Green Glow — Opportunity!: Price is near or breaking below the lower band; market could be oversold, prime for bounce or reversal.
Trend Green Fill — Trending Regime: Fills between bands with green when the market is trending, showing clear momentum.
Gold/Yellow Fill — Range Regime: Fills with gold/aqua in range conditions, showing the market is sideways/oscillating.
Magenta/Red Fill — Volatility Spike: Fills with vivid magenta/red during highly volatile regimes.
Blue Fill — Neutral/Quiet: A soft blue glow for other or uncertain market states.
Moving Averages:
Display: Blue fast EMA (20), red slow EMA (50), 2px.
Purpose: Shows trend direction, with trend_dir requiring ATR-scaled spread.
Dynamic SL/TP Lines:
Display: Pulsing colors (red SL, green TP for Trending; yellow/orange for Range, etc.), 3px, with pulse_alpha for shimmer.
Purpose: Tracks stops/TPs in real-time, color-coded by regime.
6. Dual Dashboards
Two dashboards deliver real-time insights, making the strat a quant command center.
Bottom-Left Metrics Dashboard (2x13):
Metrics: Mode (Active/Paused), trend (Bullish/Bearish/Neutral), ATR, ATR avg, volume spike (YES/NO), RSI (value + Oversold/Overbought/Neutral), HTF RSI, HTF trend, last signal (Buy/Sell/None), regime, bull score.
Display: Black (29% transparent), purple title, color-coded (green for bullish, red for bearish).
Purpose: Consolidates market context and signal strength.
Top-Right Position Dashboard (2x7):
Metrics: Regime, position side (Long/Short/None), position PNL ($), SL, TP, daily PNL ($).
Display: Black (29% transparent), purple title, color-coded (lime for Long, red for Short).
Purpose: Tracks live trades and profitability.
Why It’s Brilliant:
Dual dashboards cover market context and trade status, a rare feature.
Color-coding and concise metrics guide beginners (e.g., green “Buy” = go).
Real-time PNL and SL/TP visibility empower disciplined trading.
7. Performance Tracking
Logic: Arrays (regime_pnl_long/short, regime_win/loss_long/short) track PNL and win/loss by regime (1–5). Updated on trade close (barstate.isconfirmed).
Purpose: Prepares for future adaptive thresholds (e.g., adjust bull_score min based on regime performance).
Why It’s Brilliant: Lays the groundwork for self-optimizing logic, a quant edge over static scripts.
Key Features
Regime-Adaptive: Optimizes signals for Trending, Range, Volatile, Quiet markets.
Futures-Optimized: Precise sizing for ES/MES with tick-based risk inputs.
Multi-Factor Signals: Candlestick patterns, RSI, MACD, and HTF confirmation for robust entries.
Dynamic Exits: ATR/fixed stops, 2:1 TPs, and trailing stops maximize profits.
Safe and Smart: 5% drawdown breaker and emergency exits protect capital.
DAFE Visuals: Shimmering BB fill, pulsing SL/TP, and dual dashboards.
Backtest-Ready: Fixed qty and tick calc for accurate historical testing.
How to Use
Add to Chart: Load on a 5min ES/MES chart in TradingView.
Configure Inputs: Set instrument (ES/MES), tick value ($12.5/$1.25), multiplier (1/0.1), risk ($300 default). Enable ATR stops for volatility.
Monitor Dashboards: Bottom-left for regime/signals, top-right for position/PNL.
Backtest: Run in strategy tester to compare regimes.
Live Trade: Connect to Tradovate or similar. Watch for slippage (e.g., April 27, 2025 ES issues).
Replay Test: Try April 28, 2025 NQ drop to see regime shifts and stops.
Disclaimer
Trading futures involves significant risk of loss and is not suitable for all investors. Past performance does not guarantee future results. Backtest results may differ from live trading due to slippage, fees, or market conditions. Use this strategy at your own risk, and consult a financial advisor before trading. Dskyz (DAFE) Trading Systems is not responsible for any losses incurred.
Backtesting:
Frame: 2023-09-20 - 2025-04-29
Slippage: 3
Fee Typical Range (per side, per contract)
CME Exchange $1.14 – $1.20
Clearing $0.10 – $0.30
NFA Regulatory $0.02
Firm/Broker Commis. $0.25 – $0.80 (retail prop)
TOTAL $1.60 – $2.30 per side
Round Turn: (enter+exit) = $3.20 – $4.60 per contract
Final Notes
The Dskyz (DAFE) Adaptive Regime - Quant Machine Pro is more than a strategy—it’s a revolution. Crafted with DAFE’s signature precision, it rises above generic scripts with adaptive regimes, quant-grade signals, and visuals that make trading a thrill. Whether you’re scalping MES or swinging ES, this system empowers you to navigate markets with confidence and style. Join the DAFE crew, light up your charts, and let’s dominate the futures game!
(This publishing will most likely be taken down do to some miscellaneous rule about properly displaying charting symbols, or whatever. Once I've identified what part of the publishing they want to pick on, I'll adjust and repost.)
Use it with discipline. Use it with clarity. Trade smarter.
**I will continue to release incredible strategies and indicators until I turn this into a brand or until someone offers me a contract.
Created by Dskyz, powered by DAFE Trading Systems. Trade smart, trade bold.

Supertrend Advance Pullback StrategyHandbook for the Supertrend Advance Strategy
1. Introduction
Purpose of the Handbook:
The main purpose of this handbook is to serve as a comprehensive guide for traders and investors who are looking to explore and harness the potential of the Supertrend Advance Strategy. In the rapidly changing financial market, having the right tools and strategies at one's disposal is crucial. Whether you're a beginner hoping to dive into the world of trading or a seasoned investor aiming to optimize and diversify your portfolio, this handbook offers the insights and methodologies you need. By the end of this guide, readers should have a clear understanding of how the Supertrend Advance Strategy works, its benefits, potential pitfalls, and practical application in various trading scenarios.
Overview of the Supertrend Advance Pullback Strategy:
At its core, the Supertrend Advance Strategy is an evolution of the popular Supertrend Indicator. Designed to generate buy and sell signals in trending markets, the Supertrend Indicator has been a favorite tool for many traders around the world. The Advance Strategy, however, builds upon this foundation by introducing enhanced mechanisms, filters, and methodologies to increase precision and reduce false signals.
1. Basic Concept:
The Supertrend Advance Strategy relies on a combination of price action and volatility to determine the potential trend direction. By assessing the average true range (ATR) in conjunction with specific price points, this strategy aims to highlight the potential starting and ending points of market trends.
2. Methodology:
Unlike the traditional Supertrend Indicator, which primarily focuses on closing prices and ATR, the Advance Strategy integrates other critical market variables, such as volume, momentum oscillators, and perhaps even fundamental data, to validate its signals. This multidimensional approach ensures that the generated signals are more reliable and are less prone to market noise.
3. Benefits:
One of the main benefits of the Supertrend Advance Strategy is its ability to filter out false breakouts and minor price fluctuations, which can often lead to premature exits or entries in the market. By waiting for a confluence of factors to align, traders using this advanced strategy can increase their chances of entering or exiting trades at optimal points.
4. Practical Applications:
The Supertrend Advance Strategy can be applied across various timeframes, from intraday trading to swing trading and even long-term investment scenarios. Furthermore, its flexible nature allows it to be tailored to different asset classes, be it stocks, commodities, forex, or cryptocurrencies.
In the subsequent sections of this handbook, we will delve deeper into the intricacies of this strategy, offering step-by-step guidelines on its application, case studies, and tips for maximizing its efficacy in the volatile world of trading.
As you journey through this handbook, we encourage you to approach the Supertrend Advance Strategy with an open mind, testing and tweaking it as per your personal trading style and risk appetite. The ultimate goal is not just to provide you with a new tool but to empower you with a holistic strategy that can enhance your trading endeavors.
2. Getting Started
Navigating the financial markets can be a daunting task without the right tools. This section is dedicated to helping you set up the Supertrend Advance Strategy on one of the most popular charting platforms, TradingView. By following the steps below, you'll be able to integrate this strategy into your charts and start leveraging its insights in no time.
Setting up on TradingView:
TradingView is a web-based platform that offers a wide range of charting tools, social networking, and market data. Before you can apply the Supertrend Advance Strategy, you'll first need a TradingView account. If you haven't set one up yet, here's how:
1. Account Creation:
• Visit TradingView's official website.
• Click on the "Join for free" or "Sign up" button.
• Follow the registration process, providing the necessary details and setting up your login credentials.
2. Navigating the Dashboard:
• Once logged in, you'll be taken to your dashboard. Here, you'll see a variety of tools, including watchlists, alerts, and the main charting window.
• To begin charting, type in the name or ticker of the asset you're interested in the search bar at the top.
3. Configuring Chart Settings:
• Before integrating the Supertrend Advance Strategy, familiarize yourself with the chart settings. This can be accessed by clicking the 'gear' icon on the top right of the chart window.
• Adjust the chart type, time intervals, and other display settings to your preference.
Integrating the Strategy into a Chart:
Now that you're set up on TradingView, it's time to integrate the Supertrend Advance Strategy.
1. Accessing the Pine Script Editor:
• Located at the top-center of your screen, you'll find the "Pine Editor" tab. Click on it.
• This is where custom strategies and indicators are scripted or imported.
2. Loading the Supertrend Advance Strategy Script:
• Depending on whether you have the script or need to find it, there are two paths:
• If you have the script: Copy the Supertrend Advance Strategy script, and then paste it into the Pine Editor.
• If searching for the script: Click on the “Indicators” icon (looks like a flame) at the top of your screen, and then type “Supertrend Advance Strategy” in the search bar. If available, it will show up in the list. Simply click to add it to your chart.
3. Applying the Strategy:
• After pasting or selecting the Supertrend Advance Strategy in the Pine Editor, click on the “Add to Chart” button located at the top of the editor. This will overlay the strategy onto your main chart window.
4. Configuring Strategy Settings:
• Once the strategy is on your chart, you'll notice a small settings ('gear') icon next to its name in the top-left of the chart window. Click on this to access settings.
• Here, you can adjust various parameters of the Supertrend Advance Strategy to better fit your trading style or the specific asset you're analyzing.
5. Interpreting Signals:
• With the strategy applied, you'll now see buy/sell signals represented on your chart. Take time to familiarize yourself with how these look and behave over various timeframes and market conditions.
3. Strategy Overview
What is the Supertrend Advance Strategy?
The Supertrend Advance Strategy is a refined version of the classic Supertrend Indicator, which was developed to aid traders in spotting market trends. The strategy utilizes a combination of data points, including average true range (ATR) and price momentum, to generate buy and sell signals.
In essence, the Supertrend Advance Strategy can be visualized as a line that moves with the price. When the price is above the Supertrend line, it indicates an uptrend and suggests a potential buy position. Conversely, when the price is below the Supertrend line, it hints at a downtrend, suggesting a potential selling point.
Strategy Goals and Objectives:
1. Trend Identification: At the core of the Supertrend Advance Strategy is the goal to efficiently and consistently identify prevailing market trends. By recognizing these trends, traders can position themselves to capitalize on price movements in their favor.
2. Reducing Noise: Financial markets are often inundated with 'noise' - short-term price fluctuations that can mislead traders. The Supertrend Advance Strategy aims to filter out this noise, allowing for clearer decision-making.
3. Enhancing Risk Management: With clear buy and sell signals, traders can set more precise stop-loss and take-profit points. This leads to better risk management and potentially improved profitability.
4. Versatility: While primarily used for trend identification, the strategy can be integrated with other technical tools and indicators to create a comprehensive trading system.
Type of Assets/Markets to Apply the Strategy:
1. Equities: The Supertrend Advance Strategy is highly popular among stock traders. Its ability to capture long-term trends makes it particularly useful for those trading individual stocks or equity indices.
2. Forex: Given the 24-hour nature of the Forex market and its propensity for trends, the Supertrend Advance Strategy is a valuable tool for currency traders.
3. Commodities: Whether it's gold, oil, or agricultural products, commodities often move in extended trends. The strategy can help in identifying and capitalizing on these movements.
4. Cryptocurrencies: The volatile nature of cryptocurrencies means they can have pronounced trends. The Supertrend Advance Strategy can aid crypto traders in navigating these often tumultuous waters.
5. Futures & Options: Traders and investors in derivative markets can utilize the strategy to make more informed decisions about contract entries and exits.
It's important to note that while the Supertrend Advance Strategy can be applied across various assets and markets, its effectiveness might vary based on market conditions, timeframe, and the specific characteristics of the asset in question. As always, it's recommended to use the strategy in conjunction with other analytical tools and to backtest its effectiveness in specific scenarios before committing to trades.
4. Input Settings
Understanding and correctly configuring input settings is crucial for optimizing the Supertrend Advance Strategy for any specific market or asset. These settings, when tweaked correctly, can drastically impact the strategy's performance.
Grouping Inputs:
Before diving into individual input settings, it's important to group similar inputs. Grouping can simplify the user interface, making it easier to adjust settings related to a specific function or indicator.
Strategy Choice:
This input allows traders to select from various strategies that incorporate the Supertrend indicator. Options might include "Supertrend with RSI," "Supertrend with MACD," etc. By choosing a strategy, the associated input settings for that strategy become available.
Supertrend Settings:
1. Multiplier: Typically, a default value of 3 is used. This multiplier is used in the ATR calculation. Increasing it makes the Supertrend line further from prices, while decreasing it brings the line closer.
2. Period: The number of bars used in the ATR calculation. A common default is 7.
EMA Settings (Exponential Moving Average):
1. Period: Defines the number of previous bars used to calculate the EMA. Common periods are 9, 21, 50, and 200.
2. Source: Allows traders to choose which price (Open, Close, High, Low) to use in the EMA calculation.
RSI Settings (Relative Strength Index):
1. Length: Determines how many periods are used for RSI calculation. The standard setting is 14.
2. Overbought Level: The threshold at which the asset is considered overbought, typically set at 70.
3. Oversold Level: The threshold at which the asset is considered oversold, often at 30.
MACD Settings (Moving Average Convergence Divergence):
1. Short Period: The shorter EMA, usually set to 12.
2. Long Period: The longer EMA, commonly set to 26.
3. Signal Period: Defines the EMA of the MACD line, typically set at 9.
CCI Settings (Commodity Channel Index):
1. Period: The number of bars used in the CCI calculation, often set to 20.
2. Overbought Level: Typically set at +100, denoting overbought conditions.
3. Oversold Level: Usually set at -100, indicating oversold conditions.
SL/TP Settings (Stop Loss/Take Profit):
1. SL Multiplier: Defines the multiplier for the average true range (ATR) to set the stop loss.
2. TP Multiplier: Defines the multiplier for the average true range (ATR) to set the take profit.
Filtering Conditions:
This section allows traders to set conditions to filter out certain signals. For example, one might only want to take buy signals when the RSI is below 30, ensuring they buy during oversold conditions.
Trade Direction and Backtest Period:
1. Trade Direction: Allows traders to specify whether they want to take long trades, short trades, or both.
2. Backtest Period: Specifies the time range for backtesting the strategy. Traders can choose from options like 'Last 6 months,' 'Last 1 year,' etc.
It's essential to remember that while default settings are provided for many of these tools, optimal settings can vary based on the market, timeframe, and trading style. Always backtest new settings on historical data to gauge their potential efficacy.
5. Understanding Strategy Conditions
Developing an understanding of the conditions set within a trading strategy is essential for traders to maximize its potential. Here, we delve deep into the logic behind these conditions, using the Supertrend Advance Strategy as our focal point.
Basic Logic Behind Conditions:
Every strategy is built around a set of conditions that provide buy or sell signals. The conditions are based on mathematical or statistical methods and are rooted in the study of historical price data. The fundamental idea is to recognize patterns or behaviors that have been profitable in the past and might be profitable in the future.
Buy and Sell Conditions:
1. Buy Conditions: Usually formulated around bullish signals or indicators suggesting upward price momentum.
2. Sell Conditions: Centered on bearish signals or indicators indicating downward price momentum.
Simple Strategy:
The simple strategy could involve using just the Supertrend indicator. Here:
• Buy: When price closes above the Supertrend line.
• Sell: When price closes below the Supertrend line.
Pullback Strategy:
This strategy capitalizes on price retracements:
• Buy: When the price retraces to the Supertrend line after a bullish signal and is supported by another bullish indicator.
• Sell: When the price retraces to the Supertrend line after a bearish signal and is confirmed by another bearish indicator.
Indicators Used:
EMA (Exponential Moving Average):
• Logic: EMA gives more weight to recent prices, making it more responsive to current price movements. A shorter-period EMA crossing above a longer-period EMA can be a bullish sign, while the opposite is bearish.
RSI (Relative Strength Index):
• Logic: RSI measures the magnitude of recent price changes to analyze overbought or oversold conditions. Values above 70 are typically considered overbought, and values below 30 are considered oversold.
MACD (Moving Average Convergence Divergence):
• Logic: MACD assesses the relationship between two EMAs of a security’s price. The MACD line crossing above the signal line can be a bullish signal, while crossing below can be bearish.
CCI (Commodity Channel Index):
• Logic: CCI compares a security's average price change with its average price variation. A CCI value above +100 may mean the price is overbought, while below -100 might signify an oversold condition.
And others...
As the strategy expands or contracts, more indicators might be added or removed. The crucial point is to understand the core logic behind each, ensuring they align with the strategy's objectives.
Logic Behind Each Indicator:
1. EMA: Emphasizes recent price movements; provides dynamic support and resistance levels.
2. RSI: Indicates overbought and oversold conditions based on recent price changes.
3. MACD: Showcases momentum and direction of a trend by comparing two EMAs.
4. CCI: Measures the difference between a security's price change and its average price change.
Understanding strategy conditions is not just about knowing when to buy or sell but also about comprehending the underlying market dynamics that those conditions represent. As you familiarize yourself with each condition and indicator, you'll be better prepared to adapt and evolve with the ever-changing financial markets.
6. Trade Execution and Management
Trade execution and management are crucial aspects of any trading strategy. Efficient execution can significantly impact profitability, while effective management can preserve capital during adverse market conditions. In this section, we'll explore the nuances of position entry, exit strategies, and various Stop Loss (SL) and Take Profit (TP) methodologies within the Supertrend Advance Strategy.
Position Entry:
Effective trade entry revolves around:
1. Timing: Enter at a point where the risk-reward ratio is favorable. This often corresponds to confirmatory signals from multiple indicators.
2. Volume Analysis: Ensure there's adequate volume to support the movement. Volume can validate the strength of a signal.
3. Confirmation: Use multiple indicators or chart patterns to confirm the entry point. For instance, a buy signal from the Supertrend indicator can be confirmed with a bullish MACD crossover.
Position Exit Strategies:
A successful exit strategy will lock in profits and minimize losses. Here are some strategies:
1. Fixed Time Exit: Exiting after a predetermined period.
2. Percentage-based Profit Target: Exiting after a certain percentage gain.
3. Indicator-based Exit: Exiting when an indicator gives an opposing signal.
Percentage-based SL/TP:
• Stop Loss (SL): Set a fixed percentage below the entry price to limit potential losses.
• Example: A 2% SL on an entry at $100 would trigger a sell at $98.
• Take Profit (TP): Set a fixed percentage above the entry price to lock in gains.
• Example: A 5% TP on an entry at $100 would trigger a sell at $105.
Supertrend-based SL/TP:
• Stop Loss (SL): Position the SL at the Supertrend line. If the price breaches this line, it could indicate a trend reversal.
• Take Profit (TP): One could set the TP at a point where the Supertrend line flattens or turns, indicating a possible slowdown in momentum.
Swing high/low-based SL/TP:
• Stop Loss (SL): For a long position, set the SL just below the recent swing low. For a short position, set it just above the recent swing high.
• Take Profit (TP): For a long position, set the TP near a recent swing high or resistance. For a short position, near a swing low or support.
And other methods...
1. Trailing Stop Loss: This dynamic SL adjusts with the price movement, locking in profits as the trade moves in your favor.
2. Multiple Take Profits: Divide the position into segments and set multiple TP levels, securing profits in stages.
3. Opposite Signal Exit: Exit when another reliable indicator gives an opposite signal.
Trade execution and management are as much an art as they are a science. They require a blend of analytical skill, discipline, and intuition. Regularly reviewing and refining your strategies, especially in light of changing market conditions, is crucial to maintaining consistent trading performance.
7. Visual Representations
Visual tools are essential for traders, as they simplify complex data into an easily interpretable format. Properly analyzing and understanding the plots on a chart can provide actionable insights and a more intuitive grasp of market conditions. In this section, we’ll delve into various visual representations used in the Supertrend Advance Strategy and their significance.
Understanding Plots on the Chart:
Charts are the primary visual aids for traders. The arrangement of data points, lines, and colors on them tell a story about the market's past, present, and potential future moves.
1. Data Points: These represent individual price actions over a specific timeframe. For instance, a daily chart will have data points showing the opening, closing, high, and low prices for each day.
2. Colors: Used to indicate the nature of price movement. Commonly, green is used for bullish (upward) moves and red for bearish (downward) moves.
Trend Lines:
Trend lines are straight lines drawn on a chart that connect a series of price points. Their significance:
1. Uptrend Line: Drawn along the lows, representing support. A break below might indicate a trend reversal.
2. Downtrend Line: Drawn along the highs, indicating resistance. A break above might suggest the start of a bullish trend.
Filled Areas:
These represent a range between two values on a chart, usually shaded or colored. For instance:
1. Bollinger Bands: The area between the upper and lower band is filled, giving a visual representation of volatility.
2. Volume Profile: Can show a filled area representing the amount of trading activity at different price levels.
Stop Loss and Take Profit Lines:
These are horizontal lines representing pre-determined exit points for trades.
1. Stop Loss Line: Indicates the level at which a trade will be automatically closed to limit losses. Positioned according to the trader's risk tolerance.
2. Take Profit Line: Denotes the target level to lock in profits. Set according to potential resistance (for long trades) or support (for short trades) or other technical factors.
Trailing Stop Lines:
A trailing stop is a dynamic form of stop loss that moves with the price. On a chart:
1. For Long Trades: Starts below the entry price and moves up with the price but remains static if the price falls, ensuring profits are locked in.
2. For Short Trades: Starts above the entry price and moves down with the price but remains static if the price rises.
Visual representations offer traders a clear, organized view of market dynamics. Familiarity with these tools ensures that traders can quickly and accurately interpret chart data, leading to more informed decision-making. Always ensure that the visual aids used resonate with your trading style and strategy for the best results.
8. Backtesting
Backtesting is a fundamental process in strategy development, enabling traders to evaluate the efficacy of their strategy using historical data. It provides a snapshot of how the strategy would have performed in past market conditions, offering insights into its potential strengths and vulnerabilities. In this section, we'll explore the intricacies of setting up and analyzing backtest results and the caveats one must be aware of.
Setting Up Backtest Period:
1. Duration: Determine the timeframe for the backtest. It should be long enough to capture various market conditions (bullish, bearish, sideways). For instance, if you're testing a daily strategy, consider a period of several years.
2. Data Quality: Ensure the data source is reliable, offering high-resolution and clean data. This is vital to get accurate backtest results.
3. Segmentation: Instead of a continuous period, sometimes it's helpful to backtest over distinct market phases, like a particular bear or bull market, to see how the strategy holds up in different environments.
Analyzing Backtest Results:
1. Performance Metrics: Examine metrics like the total return, annualized return, maximum drawdown, Sharpe ratio, and others to gauge the strategy's efficiency.
2. Win Rate: It's the ratio of winning trades to total trades. A high win rate doesn't always signify a good strategy; it should be evaluated in conjunction with other metrics.
3. Risk/Reward: Understand the average profit versus the average loss per trade. A strategy might have a low win rate but still be profitable if the average gain far exceeds the average loss.
4. Drawdown Analysis: Review the periods of losses the strategy could incur and how long it takes, on average, to recover.
9. Tips and Best Practices
Successful trading requires more than just knowing how a strategy works. It necessitates an understanding of when to apply it, how to adjust it to varying market conditions, and the wisdom to recognize and avoid common pitfalls. This section offers insightful tips and best practices to enhance the application of the Supertrend Advance Strategy.
When to Use the Strategy:
1. Market Conditions: Ideally, employ the Supertrend Advance Strategy during trending market conditions. This strategy thrives when there are clear upward or downward trends. It might be less effective during consolidative or sideways markets.
2. News Events: Be cautious around significant news events, as they can cause extreme volatility. It might be wise to avoid trading immediately before and after high-impact news.
3. Liquidity: Ensure you are trading in assets/markets with sufficient liquidity. High liquidity ensures that the price movements are more reflective of genuine market sentiment and not due to thin volume.
Adjusting Settings for Different Markets/Timeframes:
1. Markets: Each market (stocks, forex, commodities) has its own characteristics. It's essential to adjust the strategy's parameters to align with the market's volatility and liquidity.
2. Timeframes: Shorter timeframes (like 1-minute or 5-minute charts) tend to have more noise. You might need to adjust the settings to filter out false signals. Conversely, for longer timeframes (like daily or weekly charts), you might need to be more responsive to genuine trend changes.
3. Customization: Regularly review and tweak the strategy's settings. Periodic adjustments can ensure the strategy remains optimized for the current market conditions.
10. Frequently Asked Questions (FAQs)
Given the complexities and nuances of the Supertrend Advance Strategy, it's only natural for traders, both new and seasoned, to have questions. This section addresses some of the most commonly asked questions regarding the strategy.
1. What exactly is the Supertrend Advance Strategy?
The Supertrend Advance Strategy is an evolved version of the traditional Supertrend indicator. It's designed to provide clearer buy and sell signals by incorporating additional indicators like EMA, RSI, MACD, CCI, etc. The strategy aims to capitalize on market trends while minimizing false signals.
2. Can I use the Supertrend Advance Strategy for all asset types?
Yes, the strategy can be applied to various asset types like stocks, forex, commodities, and cryptocurrencies. However, it's crucial to adjust the settings accordingly to suit the specific characteristics and volatility of each asset type.
3. Is this strategy suitable for day trading?
Absolutely! The Supertrend Advance Strategy can be adjusted to suit various timeframes, making it versatile for both day trading and long-term trading. Remember to fine-tune the settings to align with the timeframe you're trading on.
4. How do I deal with false signals?
No strategy is immune to false signals. However, by combining the Supertrend with other indicators and adhering to strict risk management protocols, you can minimize the impact of false signals. Always use stop-loss orders and consider filtering trades with additional confirmation signals.
5. Do I need any prior trading experience to use this strategy?
While the Supertrend Advance Strategy is designed to be user-friendly, having a foundational understanding of trading and market analysis can greatly enhance your ability to employ the strategy effectively. If you're a beginner, consider pairing the strategy with further education and practice on demo accounts.
6. How often should I review and adjust the strategy settings?
There's no one-size-fits-all answer. Some traders adjust settings weekly, while others might do it monthly. The key is to remain responsive to changing market conditions. Regular backtesting can give insights into potential required adjustments.
7. Can the Supertrend Advance Strategy be automated?
Yes, many traders use algorithmic trading platforms to automate their strategies, including the Supertrend Advance Strategy. However, always monitor automated systems regularly to ensure they're operating as intended.
8. Are there any markets or conditions where the strategy shouldn't be used?
The strategy might generate more false signals in markets that are consolidative or range-bound. During significant news events or times of unexpected high volatility, it's advisable to tread with caution or stay out of the market.
9. How important is backtesting with this strategy?
Backtesting is crucial as it allows traders to understand how the strategy would have performed in the past, offering insights into potential profitability and areas of improvement. Always backtest any new setting or tweak before applying it to live trades.
10. What if the strategy isn't working for me?
No strategy guarantees consistent profits. If it's not working for you, consider reviewing your settings, seeking expert advice, or complementing the Supertrend Advance Strategy with other analysis methods. Remember, continuous learning and adaptation are the keys to trading success.
Other comments
Value of combining several indicators in this script and how they work together
Diversification of Signals: Just as diversifying an investment portfolio can reduce risk, using multiple indicators can offer varied perspectives on potential price movements. Each indicator can capture a different facet of the market, ensuring that traders are not overly reliant on a single data point.
Confirmation & Reduced False Signals: A common challenge with many indicators is the potential for false signals. By requiring confirmation from multiple indicators before acting, the chances of acting on a false signal can be significantly reduced.
Flexibility Across Market Conditions: Different indicators might perform better under different market conditions. For example, while moving averages might excel in trending markets, oscillators like RSI might be more useful during sideways or range-bound conditions. A mashup strategy can potentially adapt better to varying market scenarios.
Comprehensive Analysis: With multiple indicators, traders can gauge trend strength, momentum, volatility, and potential market reversals all at once, providing a holistic view of the market.
How do the different indicators in the Supertrend Advance Strategy work together?
Supertrend: This is primarily a trend-following indicator. It provides traders with buy and sell signals based on the volatility of the price. When combined with other indicators, it can filter out noise and give more weight to strong, confirmed trends.
EMA (Exponential Moving Average): EMA gives more weight to recent price data. It can be used to identify the direction and strength of a trend. When the price is above the EMA, it's generally considered bullish, and vice versa.
RSI (Relative Strength Index): An oscillator that measures the magnitude of recent price changes to evaluate overbought or oversold conditions. By cross-referencing with other indicators like EMA or MACD, traders can spot potential reversals or confirmations of a trend.
MACD (Moving Average Convergence Divergence): This indicator identifies changes in the strength, direction, momentum, and duration of a trend in a stock's price. When the MACD line crosses above the signal line, it can be a bullish sign, and when it crosses below, it can be bearish. Pairing MACD with Supertrend can provide dual confirmation of a trend.
CCI (Commodity Channel Index): Initially developed for commodities, CCI can indicate overbought or oversold conditions. It can be used in conjunction with other indicators to determine entry and exit points.
In essence, the synergy of these indicators provides a balanced, comprehensive approach to trading. Each indicator offers its unique lens into market conditions, and when they align, it can be a powerful indication of a trading opportunity. This combination not only reduces the potential drawbacks of each individual indicator but leverages their strengths, aiming for more consistent and informed trading decisions.
Backtesting and Default Settings
• This indicator has been optimized to be applied for 1 hour-charts. However, the underlying principles of this strategy are supply and demand in the financial markets and the strategy can be applied to all timeframes. Daytraders can use the 1min- or 5min charts, swing-traders can use the daily charts.
• This strategy has been designed to identify the most promising, highest probability entries and trades for each stock or other financial security.
• The combination of the qualifiers results in a highly selective strategy which only considers the most promising swing-trading entries. As a result, you will normally only find a low number of trades for each stock or other financial security per year in case you apply this strategy for the daily charts. Shorter timeframes will result in a higher number of trades / year.
• Consequently, traders need to apply this strategy for a full watchlist rather than just one financial security.
• Default properties: RSI on (length 14, RSI buy level 50, sell level 50), EMA, RSI, MACD on, type of strategy pullback, SL/TP type: ATR (length 10, factor 3), trade direction both, quantity 5, take profit swing hl 5.1, highest / lowest lookback 2, enable ATR trail (ATR length 10, SL ATR multiplier 1.4, TP multiplier 2.1, lookback = 4, trade direction = both).

Algoway V4.2📌 Algoway V4.2 — Multi-layered Strategy Powered by ADX, MACD & PSO
Overview
Algoway V4.2 is a layered algorithmic strategy designed for volatility-rich assets like cryptocurrencies. While some core components (such as PSO, MACD, and ADX oscillators) are adapted from known indicator models, the original logic, state tracking, and Candle Strength Oscillator (CSO) are fully custom-developed.
This strategy is not a simple combination of tools — it implements a conditional entry-exit logic system based on ADX zone transitions, momentum structure, and MACD/PSO signal synchronization, enhanced by custom-built CSO filtering.
🧠 Key Modules and How They Work Together
PSO (Premium Stochastic Oscillator)
Used to confirm local oversold/overbought pressure. Acts as a directional filter.
MACD (Normalized)
Volatility-normalized MACD values allow consistent signal detection even on volatile pairs. It triggers entries when momentum begins shifting.
ADX Zonal Logic
Divides the market into Range / MidRange / Trend Peak zones. Entries are allowed only under specific transitions — e.g., long entries only in yellow (low volatility) zones or in trend climax zones under certain pullbacks.
CSO (Candle Strength Oscillator) — Custom Module
Designed to measure real candle momentum and price structure consistency. It avoids false breakouts and filters trend fatigue.
🔁 How Logic Works
Strategy maintains state variables to track entry type and zone.
Exit conditions depend on the entry origin: entries from "Range" exit in "Peak", while "Peak" entries exit during pullbacks or mid-strength trend reversals.
Additional logic prevents entries when signals are not aligned across modules, minimizing noise.
Optional CSO module acts as a final microstructure confirmation before executing MACD-based midpoint entries.
📊 Example Parameters (for 5M crypto scalping)
Each module is tuned to respond to 5-minute crypto volatility:
Stochastic: fast response, tight thresholds
MACD: shortened EMAs, normalized
ADX: traditional smoothing, custom thresholds for zone switching
CSO: candle-based dynamic filter with visual zone mapping
🧪 Conclusion
Algoway V4.2 is not a script merger — it is a custom logic engine using familiar technical components but governed by a proprietary decision model, with additional filters and dynamic variable tracking.
It’s suitable for scalping or swing setups, and the internal logic is optimized for real trading conditions, not just visual backtests.

KT Litmus2
Hello everyone,
Recently I saw a very good indicator on TV called Ichimoku Oscillator. This is a K-line convergence and divergence indicator similar to MACD. After backtesting research, this indicator performs well on long-term trends.
Since it is an indicator, it is made into a strategy category. Several optimizations have also been made.
This strategy takes into account the following market factors:
EMA -> Trend
Fast line - slow line -> moving average
EMA Squeeze -> Momentum Conversion, Trend
ATR -> Noise Reduction
How does it compare to the original indicator?
Optimized background display so the canvas doesn't feel cluttered with excessive colors.
Optimized part of the position reduction logic so that too many trading signals will not affect the performance of the strategy.
NOTE: As you can see, there are potential improvements that can be made by merging volumes.
Signal
Input level -> Kinetic energy enhancement, +4 long, -4 short
Partial exit level -> moving average (EMA | fast and slow line) crossing, trend unchanged
All exit levels -> trend conversion
Risk Management
"Trend Stop Loss" and "Momentum Take Profit" are used here.
Trend stop loss: Use the conversion of the strategy trend parameter wave range to close the order.
Momentum take profit: take advantage of the weakening or reverse trend momentum of the strategy to take profit.
As described, the strategy has obvious advantages in trend trading, but in volatile markets, stop loss may be triggered due to frequent signals.
Now, a set of knowledge is provided for the inexperienced reader.
MACD usually consists of three components. The MACD line is the fast exponential moving average (usually taken on the 12th day) minus the slow exponential moving average (usually taken on the 26th day), generally called the difference (DIF). The second line is the signal line, which is the exponential moving average of DIF (usually 9 days), generally called DEA. The last component is the MACD histogram, whose value is the difference between DIF and DEA. However, the time value of the MACD indicator can also be adjusted according to the trader's preference and trading category.
The underlying logic of DIF is that the short-term exponential moving average reflects current price movements, while the long-term EMA reflects earlier price movements. Therefore, if there is a large gap between these two EMAs, then the market is trending up or down. While the MACD histogram is oscillating around the zero line, indicating the strength of the trend.
EMA: Exponential Moving Average; similar to a simple moving average but exponentially weights the input data.
Sincerely,
salute
---
Acknowledgments:
@LonesomeTheBlue
renew
March 14
Strategies for increasing Python version

Road To Dubai v.2.99.4ROAD TO DUBAI 2.99.4
Usueful for daily trading over all type of asset, from Stock to Crypto, Forex and Commodities. It works best with 5min to 1hr graphs, if you are a intraday trader.
This is not a simple mashup of indicators, because you can add them as your own.
This script is more like a tool to understand price action based on indicators position. Thanks to cross call based on MACD, RSI with EMA applied and few index realtime mapping, this tool will let you reduce time effort for graph analysis.
As extra feature it will let you to try different strategies all fully customizable.
I've tried my best to keep it readble, and easy to use.
STANDARD FEATURES
VWAP : Green/Red line. It will reset everyday at 00.00.
EMA80 : White Line
BLUELINES : Positive and negative overextend value from VWap. This is based on a range of bar and it will extend on the opposite side the lower or higher candle. Useful for understading where price can arrive, expecially if a spike will appear.
Those indicators are quite useful for understading trends, price positions and maximum price range.
RSI EMA10 OVERBOUGHT / OVERSOLD
Yellow arrow marks where RSI arrived at his Top or Bottom. If on different timeframes (5min, 30min and 60min) something similar happen area is filled with Red or Green.
This is base on EMA10 applied to RSI (I usually refer at it as Yellow Line on my indicator HighFreq Trader)
To find good values please try High Freq Trader 1.3
RSI EMA80 CALL
Red Cross or Green Square advice for a really potential inversion of trend. When a Silver bar appear, this means the same call was triggered on different Timeframe in the sametime.
This is based on EMA80 applied to RSI (I usually refer at it as Blue Line on my indicator HighFreq Trader).
To find good values please try High Freq Trader 1.3
MACD CALL
Based on MACD with standard settings. When triggered, a lime Triangle appears. Differents size based on timeframe (5min smaller, 60min bigger). If the same call is triggered on the same place a Lime Bar appear on the opposite side of trend (this is a graphical contents, bacause with all enabled, standard use, can be difficult to read signals).
In Menu Settings you will be able to set your best parameter for your asset.
MACD FIBONACCI EXTRA FEATURE
If you want you can enable a Fibonacci draw based on MACD. This works at his best (on my opinion) with 30min MACD
EXAMPLE
NATURAL GAS
In this chart 30min you can see all calls triggered for a Short. Yellow RSI Arrow, Red Cross, Macd Triangle and Colored Red, Lime and Silver Bars are all calling for Short.
In this way you can see in notime if this can be a perfect moment for take position
ORDER PLANNER
This feature will help you to understand a better way to place order, where Stop Loss and Take Profit could be place. It can be manual or Automatic (based on price position if above or below VWap)
VIX VXN DXY CALLS
If VIX, VXN is triggered a small Green Dot will appear. If both are in the same time a bigger Dot appear. Very useful to find trend inversion.
If DXY is triggered a Red Dot will appear (only on Daily Chart). Very Useful to understand trend inversion on whole market.
VOLUMES REMINDERS
Find if there was an High Volume traded (HV) or Low Volume Traded (LV) in the near past. Useful to understand if some tricky situation could happen (like a sudden sell, an accumulation or distribution)
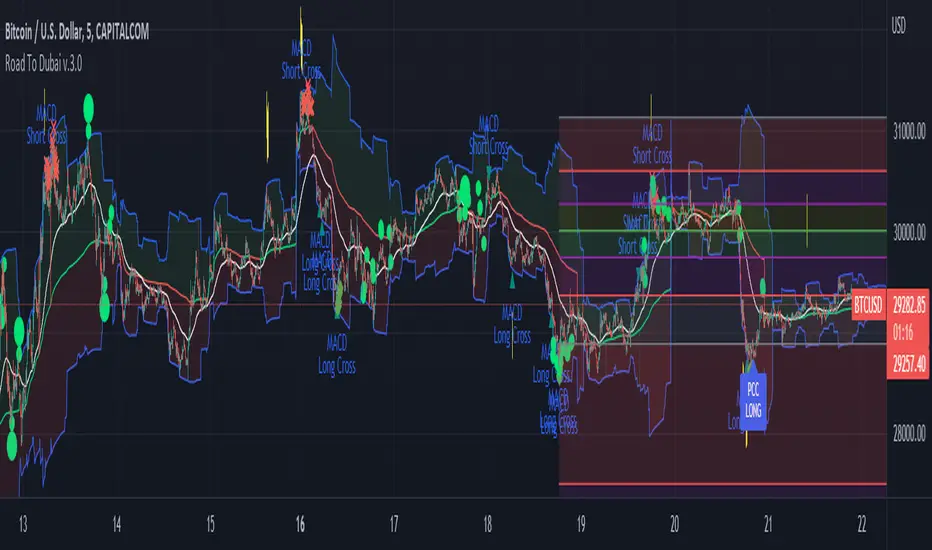
Momentum Pull Back Stratergy"Master Pull Back Strategy" is a highly detailed momentum and volume-based trading system designed for Trading View. It visually annotates the chart, detects buy/sell signals, tracks market phases, and evaluates retracements and confirmations. Below is a full breakdown of its logic and components:
🔷 1. Volume Profile Highlights (Arrow Emojis)
Purpose: Show volume strength vs. average using color-coded arrows.
Calculates average volume over a user-defined period (length = 10).
Divides current volume by average volume to get volRatio.
Based on volRatio, plots small arrows (acting like diamonds) in various colors:
Low volume (black, navy, blue...) to high volume (yellow, red, purple).
Visual Purpose: Give a quick sense of how "loud" or "quiet" a candle's volume is.
📈 2. Highs of Day Tracking
Purpose: Track the high price reached during different trading sessions.
Defines pre-market, regular, and post-market sessions.
Tracks the highest price (high) in each session.
Plots colored lines:
Orange: Pre-market high
Red: Regular market high
Blue: Post-market high
🟩 3. Green Candle Pattern Detection
Purpose: Detect bullish patterns formed by consecutive green candles.
Key Conditions:
Count green candles (greenCount) until a red candle appears or 10 candles max.
Require at least 1 silver-or-above volume candle (volRatio >= 1.0).
Must have ≥3% price gain during the green sequence.
Must accumulate >20,000 volume during the green run.
If Valid:
Locks the pattern.
Records important values:
patternStartPrice, patternEndPrice, totalPatternVolume, patternHigh, patternBars
Marks the bar after which red starts (redStartBar)
⬇️ 4. Retracement Monitoring
Purpose: Track retracement from the pattern high after it locks.
Defines retracement percentage:
(greenPatternHigh - low) / (greenPatternHigh - greenPatternLow)
If retracement exceeds 80%, it invalidates the pattern.
Buy signal is disabled if pattern retraces too far.
✅ 5. Buy Signal Logic
Purpose: Fire a buy signal after pattern lock if price breaks above local high.
Conditions:
Pattern is locked (patternLocked).
Price breaks above a short-term high (triggerBreak).
It's not the first red candle.
Price is within 8.5% above EMA9.
Buy signal fires and:
Sets buyActive = true
Tracks highest price after buy
Stores buyPrice = close
❌ 6. Sell Signal Logic
Purpose: Exit signal after retracement from post-buy high.
While buy is active:
If price retraces ≥3% from the post-buy high → sellSignal = true
Resets buyActive, trackedHigh, and buyPrice
Plots a red "SELL" label above the bar.
🎨 7. Buy Signal Visual Color Coding
Purpose: Color buy signal based on how deep the retracement is.
Uses retracement percentage:
≥65% → Red (high risk)
45–65% + MACD bullish → Yellow (moderate)
<45% + MACD bullish → Green (ideal)
Plots BUY label below bar in the respective color.
🔻 8. Retracement Triangle Visuals
Purpose: Shows retracement progression while pattern is locked.
If pattern is locked and not ready for buy:
Plots triangle below bar in the buyColor for visual tracking.
⭐ 9. Star Markers Above Lock Candle
Purpose: Confirmations when pattern locks.
First Star:
Plotted above the first red candle after green pattern lock.
Second Star (⭐⭐):
Additional confirmations:
Volume OK (less than previous)
MACD bullish
Price > VWAP
VolAtLock > 100K
Price up >6% from first green candle
Price below 75% of daily EMA200 or above EMA200
Third Star (⭐⭐⭐):
Even stricter confirmations:
Volume < 60% of previous
High <= previous high
VolAtLock > 500K
Price > $3
Gain >9% from first green
Price < 50% of daily EMA200 or above EMA200
📊 10. Bar Coloring
Purpose: Visually highlight bars based on pattern phase and MACD.
Gray: MACD Bearish
Light Green: Part of active green pattern
Blue: In locked phase but no buy triggered
🔄 11. Reset Logic
Purpose: Clears all tracking variables once a buy signal fires or pattern is invalidated.
Also resets if:
Retracement is too deep
10 candles pass post-lock without a trigger
⛰️ 12. Double Top Detection
Purpose: Basic visual marker when current high == previous high.
Plots a gray triangle if current and previous bar highs match.
📌 Summary: What This Strategy Shows
Buy Opportunities: Based on high-volume green runs and confirmed breakouts.
Sell Triggers: Once a retracement from peak exceeds 3%.
Visuals for Confirmation:
Diamonds for volume
Stars for lock confidence
Colors for retracement strength
Risk Management:
Retracement filtering
Time limits on locked phases
Volume filters
Market Context: Tracks pre/regular/post market highs and daily EMA 200.

TASC 2024.08 Volume Confirmation For A Trend System█ OVERVIEW
This script demonstrates the use of volume data to validate price movements based on the techniques Buff Pelz Dormeier discusses in his "Volume Confirmation For A Trend System" article from the August 2024 edition of TASC's Traders' Tips . It presents a trend-following system implementation that utilizes a combination of three indicators: the Average Directional Index (ADX), the Trend Thrust Indicator (TTI), and the Volume Price Confirmation Indicator (VPCI).
█ CONCEPTS
In his article, Buff Pelz Dormeier recounts his search for an optimal trend-following strategy enhanced with volume data, starting with a simple system combining the ADX , MACD , and OBV indicators. Even in these early tests, the author observed that the volume confirmation from OBV notably improved trading performance. Subsequently, the author replaced OBV with his VPCI, which considers the proportional weights of volume and price, to enhance the validation of trend momentum. Lastly, the author explored the inclusion of his TTI, a modified MACD that features volume-based enhancements, as a strategy component for improved trend-following performance.
According to the author's research, the ADX+TTI+VPCI system outperformed similar strategies he tested in the article, yielding significantly higher returns and enhanced perceived reliability. Because the system's design revolves around catching pronounced trends, it performs best with a portfolio of individual stocks. The author applies the system in the article by allocating 5% of the equity to long positions in S&P 500 components that meet the ADX+TTI+VPCI entry criteria (see the Calculations section below for details). He uses the proceeds from closing positions to enter new positions in other stocks meeting the screening criteria, holding any excess proceeds in cash.
█ CALCULATIONS
The TTI is similar to the MACD. Its calculation entails the following steps:
Calculate fast (short-term) and slow (long-term) volume-weighted moving averages (VWMAs).
Compute the volume multiple (VM) as the square of the ratio of the fast VWMA to the slow VWMA.
Adjust these averages by multiplying the fast VWMA by the VM and dividing the slow VWMA by the VM.
Calculate the difference between the adjusted VWMAs to determine the TTI value, and take the average of that series to determine the signal line value.
The VPCI utilizes differences and ratios between VWMAs and corresponding simple moving averages (SMAs) to provide an alternative volume-price confirmation tool. Its calculation is as follows:
Subtract the slow SMA from the VWMA of the same length to calculate the volume-price confirmation/contradiction (VPC) value.
Divide the fast VWMA by the corresponding fast SMA to determine the volume-price ratio (VPR).
Divide the short-term VWMA by the long-term VWMA to calculate the VM.
Compute the VPCI as the product of the VPC, VPR, and VM values.
The long entry criteria of the ADX+TTI+VPCI system are as follows:
The ADX is above 30.
The TTI crosses above its signal line.
The VPCI is above 0, confirming the trend.
Signals to close positions occur when the VPCI is below 0, indicating a contradiction .
NOTE: Unlike in the article, this script applies the ADX+TTI+VPCI system to one stock at a time , not a portfolio of S&P 500 constituents.
█ DISCLAIMER
This strategy script educates users on the trading system outlined by the TASC article. By default, it uses 10% of equity as the order size and a slippage amount of 5 ticks. Traders should adjust these settings and the commission amount when using this script.

Bitcoin 30m Swing Trader Long/Short StrategyIntro
I want to share the results of my passionate hobby and the unstoppable chase for a profitable automated trading strategy. It has been created with the intention of trading only Bitcoin. Altcoins are not interesting for me, as I have discovered lots of issues with finding the right parameter values for experiencing a good performance. As altcoins typically follow the trend of bitcoin and characteristically have a high volatility that may cause stop-hunts, I decided to not over complicate this project. I was just aiming for a profitable trading strategy with an acceptable drawdown and enough confidence by a statistically significant number of trades beside a wide backtesting timespan (credits going out to TradingView: Deep Backtesting).
Total time spent on this is approximately 2 years.
Indicators used
RSI: Used for entries and trend reversal spots
MACD: Used for entry and exit optimiziation
ATR: Used for dynamic offsets in trend definition indicator
Custom trend indicator: Self-made indicator, based on simple price action of higher timeframes using pivot points to find support and resistance zones that have formerly been created
Strategy parameters
I have reduced the total parameters used to just a few. It took lots of working hours to find appropriate values along the trading algorithm and I don’t want to overcomplicate it to you.
This strategy is for those, who have been looking for a working strategy. No DIY kit.
Feel free to adapt Take profit or stop loss targets. But it’s not recommended to do so.
How it works
Entries:
I started with a kind of template that I have been using for strategies for a long time. This includes how to find the right Entries during a trend as well as spotting trend reverse opportunities. Here I combine simple indicators like RSI and MACD beside necessary trend conditions. If a target RSI Value is hit, it will enter a trade, after MACD histogram has stopped to fall/rise. Depends on long/short. While we are in a trade and trend reversed, it waits for a specific RSI target level to be hit, to reverse the trade. As simple as it is, it closes the open one and starts a trade in other direction.
Micro trend:
It starts to get more interesting when it comes to trend recognition, as it forms the core of the strategy and discovering appropriate values for it has been very hard. The final trend variable is defined by the responses over higher timeframes of my self-made trend indicator. Executed on the current timeframe, the trend indicator is quite interesting. But for a automated trading strategy it is necessary to deviate trading instructions from higher timeframes trends.
Macro trend:
The same process that happens for micro trend is also applied with much higher timeframes, like 3D or weekly. The basic assumption is, that if we are in a bull or bear run, where retail investors are flooding the markets, we are increasing our take profit targets respectively. This way we can catch bigger moves in bigger trends.
Exits:
Closing a trade generally happens when a TP target (in %) is hit, or the SL (in %) is hit. The strategy has a special treatment with SL’s. After it happens, the strategy is more careful about market conditions and typically waits for a countertrade. The third way of closing a trade has already been mentioned: the reverse trades. They happen during choppy market conditions. The strategy has also special awareness here and tracks, if reverse trades start to happen more often. After a while, it starts to be more restrictive in opening new reverse trades.
Performance
Capabilities and limitations:
As I have already mentioned the strategy is only optimized for bitcoin (Perpetual Futures). This does not mean, it can not be used on other markets, because the algorithm itself is universal appliable. A very hard task was about finding the right parameter values for the strategy performing like this. If you have a special wish to configure this strategy for a specific market, DM me. The strategy has been tested with different configurations on the following timeframes: 30, 15, 10, 5, 1. I have decided to publish the one for 30m TF, because its performance simply convinced me.
Repainting:
It has been tested lots of times against repainting.
Confidence:
The total backtesting performance reaches out to 2019-09-08. So the strategy has been managing to be successful since then, but this does not guarantee that the logic, this strategy follows, is going to continue this level in future.
Commission:
The algorithm is configured with 0.04% commission per trade, as it is on Binance (for Future Market orders).
Ordersize:
Its totally up to you, how much of your total equity should be traded. Nevertheless, I would personally recommend to not exceed 50% ordersize of your equity with this strategy. In the past, you would have had great performance beside a drawdown, that was from psychological point of view good to handle with. This strategy additionally uses STOP LOSSES, so you can never loose you whole ordersize at one trade.
Slippage:
You also must consider about getting slipped when trading this strategy on live markets. Statistically one could assume, that the slippage could be neutral, as it can be both positive or negative. It depends on your execution time, the exchange, on which you are executing trades and market conditions. But keep it in mind, as if you have too much slippage, this strategy would be unprofitable.
