Trend Signals with TP & SL [UAlgo] StrategyThe "Trend Signals with TP & SL Strategy" is a trading strategy designed to capture trend continuation signals while incorporating sophisticated risk management techniques. This strategy is tailored for traders who wish to capitalize on trending market conditions with precise entry and exit points, automatically calculating Take Profit (TP) and Stop Loss (SL) levels based on either Average True Range (ATR) or percentage values. The strategy aims to enhance trade management by preventing multiple simultaneous positions and dynamically adapting to changing market conditions.
This strategy is highly configurable, allowing traders to adjust sensitivity, the ATR calculation method, and the cloud moving average length. Additionally, the strategy can display buy and sell signals directly on the chart, along with visual representation of entry points, stop losses, and take profits. It also features a cloud-based trend analysis using a MACD-driven color fill that indicates the strength and direction of the trend.
🔶 Key Features
Configurable Trend Continuation Signals:
Source Selection: The strategy uses the midpoint of the high-low range as the default source, but it is adjustable.
Sensitivity: The sensitivity of the trend signals can be adjusted using a multiplier, ranging from 0.5 to 5.
ATR Calculation: The strategy allows users to choose between two ATR calculation methods for better adaptability to different market conditions.
Cloud Moving Average: Traders can adjust the cloud moving average length, which is used in conjunction with MACD to provide a visual trend indication.
Take Profit & Stop Loss Management:
ATR-Based or Percent-Based: The strategy offers flexibility in setting TP and SL levels, allowing traders to choose between ATR-based multipliers or fixed percentage values.
Dynamic Adjustment: TP and SL levels are dynamically adjusted according to the selected method, ensuring trades are managed based on real-time market conditions.
Prevention of Multiple Positions:
Single Position Control: To reduce risk and enhance strategy reliability, the strategy includes an option to prevent multiple positions from being opened simultaneously.
Visual Trade Indicators:
Buy/Sell Signals: Clearly displays buy and sell signals on the chart for easy interpretation.
Entry, SL, and TP Lines: Draws lines for entry price, stop loss, and take profit directly on the chart, helping traders to monitor trades visually.
Trend Cloud: A color-filled cloud based on MACD and the cloud moving average provides a visual cue of the trend’s direction and strength.
Performance Summary Table:
In-Chart Statistics: A table in the top right of the chart displays key performance metrics, including total trades, wins, losses, and win rate percentage, offering a quick overview of the strategy’s effectiveness.
🔶 Interpreting the Indicator
Trend Signals: The strategy identifies trend continuation signals based on price action relative to an ATR-based threshold. A buy signal is generated when the price crosses above a key level, indicating an uptrend. Conversely, a sell signal occurs when the price crosses below a level, signaling a downtrend.
Cloud Visualization: The cloud, derived from MACD and moving averages, changes color to reflect the current trend. A positive cloud in aqua suggests an uptrend, while a red cloud indicates a downtrend. The transparency of the cloud offers further nuance, with more solid colors denoting stronger trends.
Entry and Exit Management: Once a trend signal is generated, the strategy automatically sets TP and SL levels based on your chosen method (ATR or percentage). The stop loss and take profit lines will appear on the chart, showing where the strategy will exit the trade. If the price reaches either the SL or TP, the trade is closed, and the respective line is deleted from the chart.
Performance Metrics: The strategy’s performance is tracked in real-time with an in-chart table. This table provides essential information about the number of trades executed, the win/loss ratio, and the overall win rate. This information helps traders assess the strategy's effectiveness and make necessary adjustments.
This strategy is designed for those who seek to engage with trending markets, offering robust tools for entry, exit, and overall trade management. By understanding and leveraging these features, traders can potentially improve their trading outcomes and risk management.
🔷 Related Script
🔶 Disclaimer
Use with Caution: This indicator is provided for educational and informational purposes only and should not be considered as financial advice. Users should exercise caution and perform their own analysis before making trading decisions based on the indicator's signals.
Not Financial Advice: The information provided by this indicator does not constitute financial advice, and the creator (UAlgo) shall not be held responsible for any trading losses incurred as a result of using this indicator.
Backtesting Recommended: Traders are encouraged to backtest the indicator thoroughly on historical data before using it in live trading to assess its performance and suitability for their trading strategies.
Risk Management: Trading involves inherent risks, and users should implement proper risk management strategies, including but not limited to stop-loss orders and position sizing, to mitigate potential losses.
No Guarantees: The accuracy and reliability of the indicator's signals cannot be guaranteed, as they are based on historical price data and past performance may not be indicative of future results.
Recherche dans les scripts pour "macd"

Brilliance Academy Secret StrategyThe Brilliance Academy Secret Strategy is a powerful trading strategy designed to identify potential trend reversals and optimize entry and exit points in the market. This strategy incorporates a combination of technical indicators, including Moving Average Convergence Divergence (MACD), Relative Strength Index (RSI), Pivot Points, and Bollinger Bands.
Key Features:
MACD Indicator: A momentum oscillator that helps identify changes in trend strength and direction.
RSI Indicator: A momentum oscillator that measures the speed and change of price movements, indicating potential overbought or oversold conditions.
Pivot Points: Key levels used by traders to identify potential support and resistance levels in the market, aiding in trend reversal identification.
Bollinger Bands: Volatility bands placed above and below a moving average, indicating potential market volatility and overbought or oversold conditions.
How to Use:
Long Signals: Look for long signals when the market price is above the 200-period moving average, MACD line crosses below the signal line, RSI is above 30, and price is above the lower Bollinger Band or at a pivot low.
Short Signals: Look for short signals when the market price is below the 200-period moving average, MACD line crosses above the signal line, RSI is below 70, and price is below the upper Bollinger Band or at a pivot high.
Exit Strategy: Long trades are closed when the next short signal occurs or when the profit reaches a fixed take profit percentage (3% above entry price). Short trades are closed when the next long signal occurs or when the profit reaches a fixed take profit percentage (3% below entry price).

TrippleMACDCryptocurrency Scalping Strategy for 1m Timeframe
Introduction:
Welcome to our cutting-edge cryptocurrency scalping strategy tailored specifically for the 1-minute timeframe. By combining three MACD indicators with different parameters and averaging them, along with applying RSI, we've developed a highly effective strategy for maximizing profits in the cryptocurrency market. This strategy is designed for automated trading through our bot, which executes trades using hooks. All trades are calculated for long positions only, ensuring optimal performance in a fast-paced market.
Key Components:
MACD (Moving Average Convergence Divergence):
We've utilized three MACD indicators with varying parameters to capture different aspects of market momentum.
Averaging these MACD indicators helps smooth out noise and provides a more reliable signal for trading decisions.
RSI (Relative Strength Index):
RSI serves as a complementary indicator, providing insights into the strength of bullish trends.
By incorporating RSI, we enhance the accuracy of our entry and exit points, ensuring timely execution of trades.
Strategy Overview:
Long Position Entries:
Initiate long positions when all three MACD indicators signal bullish momentum and the RSI confirms bullish strength.
This combination of indicators increases the probability of successful trades, allowing us to capitalize on uptrends effectively.
Utilizing Linear Regression:
Linear regression is employed to identify consolidation phases in the market.
Recognizing consolidation periods helps us avoid trading during choppy price action, ensuring optimal performance.
Suitability for Grid Trading Bots:
Our strategy is well-suited for grid trading bots due to frequent price fluctuations and opportunities for grid activation.
The strategy's design accounts for price breakthroughs, which are advantageous for grid trading strategies.
Benefits of the Strategy:
Consistent Performance Across Cryptocurrencies:
Through rigorous testing on various cryptocurrency futures contracts, our strategy has demonstrated favorable results across different coins.
Its adaptability makes it a versatile tool for traders seeking consistent profits in the cryptocurrency market.
Integration of Advanced Techniques:
By integrating multiple indicators and employing linear regression, our strategy leverages advanced techniques to enhance trading performance.
This strategic approach ensures a comprehensive analysis of market conditions, leading to well-informed trading decisions.
Conclusion:
Our cryptocurrency scalping strategy offers a sophisticated yet user-friendly approach to trading in the fast-paced environment of the 1-minute timeframe. With its emphasis on automation, accuracy, and adaptability, our strategy empowers traders to navigate the complexities of the cryptocurrency market with confidence. Whether you're a seasoned trader or a novice investor, our strategy provides a reliable framework for achieving consistent profits and maximizing returns on your investment.

[Round Numbers] Signal Clean Up Analysis with Backtest (TSO)Round Numbers NEW GEN indicator!
===========================================================================
===========================================================================
This is a full-cycle trading system indicator - it will show and alert each step of the trade from open to close. The algorithm here uses Round Numbers for generating signals, TP (Take Profit) and SL (Stop Loss) levels. Round numbers play big role in trading and can easily become strong support and resistance levels where price can bounce and go the opposite way or go through with a very nice run afterwards.
In addition there is a chained (NOTE: You can select several or ALL of the features, this is not limited to either one) signal cleanup and analysis approach with scheduling and alerting capabilities. Works with most popular timeframes: 1M, 3M, 5M, 15M, 30M, 1H, 4H, D.
NOTE: Every action of the trade is calculated on a confirmed closed candle bar state (barstate.isconfirmed), so the indicator will never repaint!
NOTE: At position open - there will be calculated Take-Profit and Stop-Loss targets, however each target is considered hit, when candle bar closes breaking that target, so Take-Profit and Stop-Loss when hit will slightly differ then what you see at trade/position open.
===========================================================================
===========================================================================
Round Numbers up|down unit setting and overall explanation
---------------------------------------------------------------------------
Round Number up|down unit: is the distance between round numbers on the chart. Since these round number levels are also used by the algorithm to open/close trades, it is important to set this setting to a logical number, which will correspond to an average price movement of the instrument.
Here are some examples for a few popular instruments on what will the default 1 round number unit correspond to and what would be suggested:
BTCUSD > $1 (this won't work for Bitcoin, try at least $100 - 100units)
SPY: > $1 (one of the best settings for SPY or QQQ, 50cents shows good results as well - 0.5units)
FOREX (all major pairs): > 10PIPs (that may be a bit small, unless scalping, try 50PIPs - 5units)
===========================================================================
===========================================================================
Explanation of all the Features | Strategy Configuration Guide | Indicator Settings | Signal Cleanup Analysis
---------------------------------------------------------------------------
>>> Customizable Backtesting for a specific date range, results via TradingView strategy, which includes “Deep Backtesting” for largest amounts of data on trading results.
>>> Trading Schedule with customizable trading daily time range, automatic closing/alert trades before Power Hour or right before market closes or leave it open until next day.
>>> 3 Trading Systems.
>>> Static/Dynamic/Trailing Take-Profit and Stop-Loss setups (HIGHLIGHT: Stop-Loss will be moved to Entry after TP1 is taken or a smart trailing Stop-Loss can be used with Stop-Loss dynamically following the trade to minimize risk).
>>> Single or Multiple profit targets (up to 5).
>>> Take-Profit customizable offset feature (set your Take-Profit targets slightly before everyone is expecting it!).
>>> Candle bar signal analysis (matching candle color, skip opposite structured and/or doji candle uncertain signals).
>>> Additional analysis of VWAP/EMA/ATR/EWO (Elliot Wave Oscillator)/Divergence MACD+RSI/Volume signal confirmation (clean up your chart with indicator showing only the best potential signals!).
>>> Advanced Alerts setup, which can be potentially setup with a trading bot over TradingView Webhook (NOTE: This will require advanced programming knowledge).
===========================================================================
Labels, plots, colors explanations:
---------------------------------------------------------------------------
>>>>> LONG open: green "house" looking arrow below candle bar.
>>>>> SHORT open: red "house" looking arrow above candle bar.
>>>>> LONG/SHORT take-profit target: green/red circles (multi-profit > TP2/3/4/5 smaller circles).
>>>>> LONG/SHORT stop-loss target: green/red + crosses.
>>>>> LONG/SHORT take-profit hits: green/red diamonds.
>>>>> LONG/SHORT stop-loss hits: green/red X-crosses.
>>>>> LONG/SHORT EOD (End of Day | Intraday style) close (profitable trade): green/red squares.
>>>>> LONG/SHORT EOD (End of Day | Intraday style) close (loss trade): green/red PLUS(+)-crosses.
===========================================================================
Date Range and Trading Schedule Settings
---------------------------------------------------------------------------
>>>>> Date Range: Select your start and/or end dates (uncheck “End” for indicator to show results up to the very moment and to use for LIVE trading) for backtesting results, if not using backtesting – uncheck “Start”/“End” to turn it off.
>>>>> Use TradingView “Strategy Tester” to see backtesting results
NOTE: If Strategy Tester does not show any results with Date Ranged fully unchecked, there may be an issue where a script opens a trade, but there is not enough TradingView power to set the Take-Profit and Stop-Loss and somehow an open trade gets stuck and never closes, so there are “no trades present”. In such case you will need to manually check “Start”/“End” dates or use “Depp Backtesting” feature!
>>>>> Trading Schedule: This is where you can setup Intraday Session or any custom session schedule you wish. Turn it ON. Select trading hours. Select EOD (End of Day) setting (NOTE: If it will be OFF, the indicator will assume you are holding your position open until next day!). Please note the EOD trade closure times with the 2 different Intraday close settings when turned on:
At Market Close:
1/3/5min > will close at 15:55pm ET
15min > will close at 15:45pm ET
30min > will close at 15:30pm ET
45min > will close at 15:45pm ET
60min > will close at 15:00pm ET
Before Power Hour:
1/3/5min > will close at 15:00pm ET
15min > will close at 15:00pm ET
30min > will close at 15:00pm ET
45min > will close at 15:00pm ET
60min > will close at 15:00pm ET
>>> Trading Systems: 1) "Open Until Closed by TP or SL": the signal will only open a trade if no trades are currently open/trunning, a trade can only be closed by Take Profit, Stop Loss or End of Day close (if turned on) | 2) "Open Until Closed by TP or SL + OCA": Same as 1), but if there is an opposite signal to the trade which is currently open > it will immediately be closed with new trade open or End of Day close (if turned on) | 3) "OCA (no TP or SL)": There are is Take Profit or Stop Loss, only an opposite signal will close current trade and open an opposite one or End of Day close (if turned on).
>>> Turn On/Off: Current Position SL + Opposite Position Open Signal on the same closing candle bar (If current trade hits Stop-Loss and at that same closing candle bar there is a signal for an opposite direction trade > indicator will close current position as Stop-Loss and immediately open an opposite position). NOTE: With this option turned on, there will be more trades, but not necessarily better results, since after Stop-Loss is hit, it may make sense to wait a little before opening an opposite trade, even if it matches the condition at the same time when Stop-Loss is hit, but sometimes it shows great results, so this setting/feature is included. NOTE: This setting only will work/make sense with TP and SL style/behavior both be set to "Fully Closed Candle"!
>>> Turn On/Off: Turn On/Off: Current Position REGULAR SL | Only the SL + Opposite Position Open will trigger if turned on, IF NOT - THERE WILL BE NO STOP-LOSS AT ALL!!! NOTE: It is very dangerous to trade without Stop-Loss!
>>>>> Signal Candle Bar consuming Take-Profits - position/trade signal candle bar is big enough to "consume"/close ahead the first TP setting > the signal can either be skipped, or all Take-Profit areas pushed ahead using smart formula)
>>>>> MULTIPROFIT | TP (Take-Profit) System: 1) Static – Once the trade is open, all Take-Profit target(s) are immediately calculated and set for the trade > once the target(s) is hit > trade will be partially closed (if candle bar closes beyond several Take-Profit targets > trade will be reduced accordingly to the amount of how many Take-Profit targets were hit) ||| 2) Dynamic – Once the trade is open, only the 1st Take-Profit target is calculated, once the 1st Take-Profit is hit > next Take-Profit distance is calculated based on the distance from trade Entry to where 1st Take-Profit was taken, once 2nd Take-Profit is taken > 3rd Take-Profit is calculated per same logic, these are good for price momentum as with price speeding up – profits increase as well!
>>>>> MULTIPROFIT: SL (stop loss) System | Static: SL is set at position open and remains such; Dynamic: Once ANY TP is taken > SL will be moved to Entry; Trailing: SL will be moved along the position (smart trailing stop-loss), at TP1 taken > SL moves to Entry, at TP2 taken > SL moves to TP1, at TP3 taken > SL moves to TP2 and so on.
>>>>> # of TPs (number of take profit targets): Just like it is named, this is where you select the number of Take-Profit targets for your trading system (NOTE: If "OCA (no TP or SL)" Trading System is selected, this setting won’t do anything, since there are no TP or SLs for that system).
>>>>> TP(s) offset: This is a special feature for all Take-Profit targets, where you can turn on a customizable offset, so that if the price is almost hitting the Take-Profit target, but never actually touches it > you will capture it. This is good to use with HHLL (Highest High Lowest Low), which is pretty much a Support/Resistance as often the price will nearly touch these strong areas and turn around…
===========================================================================
Dynamic/Static/Trailing Take-Profit and Stop-Loss visual examples:
---------------------------------------------------------------------------
1) Fully Static Take-Profit and Stop-Loss
This one is a fully static setup for both Take-Profit and Stop-Loss, you can also observe how trade is closed right before the Power Hour (trade can be closed right before Power Hour or right before Market Closes or left overnight as desired).
2) Static/Dynamic, Static Take-Profit and Dynamic Stop-Loss
You can see a static Take-Profit set at position open, while Stop-Loss moves to Entry once TP1 target is taken.
3) Static/Trailing, Static Take-Profit and Trailing Stop-Loss
In here with each Take-Profit taken, Stop-Loss moves along the trade to previous Take-Profit level, you can notice how stop-loss literally follows the trade and reduces the potential loss.
4) Dynamic/Trailing, Dynamic Take-Profit and Trailing Stop-Loss
See how Take-Profit distances increase with price momentum. Just like in previous example - Trailing Stop-Loss is following the trade and reducing the riks.
===========================================================================
Signal Analysis and Cleanup Settings
---------------------------------------------------------------------------
>>>>> Candle Analysis | Candle Color signal confirmation: If closed candle bar color does not match the signal direction > no trade will be open.
>>>>> Candle Analysis | Skip opposite candle signals: If closed candle bar color will match the signal direction, but candle structure will be opposite (for example: bearish green hammer, long high stick on top of a small green square) > no trade will be open.
>>>>> Candle Analysis | Skip doji candle signals: If closed candle bar will be the uncertain doji > no trade will be open.
>>>>> Divergence/Oscillator Analysis | EWO (Elliot Wave Oscillator) signal confirmation: LONG will only be open if at signal, EWO is green or will be at bullish slope (you can select which setting you desire), SHORT if EWO is red or will be at bearish slope.
>>>>> Divergence/Oscillator Analysis | VWAP signal confirmation: LONG will only be open if at signal, the price will be above VWAP, SHORT if below.
>>>>> Divergence/Oscillator Analysis | Moving Average signal confirmation: LONG will only be open if at signal, the price will be above selected Moving Average, SHORT if below.
>>>>> Divergence/Oscillator Analysis | ATR signal confirmation: LONG will only be open if at signal, the price will be above ATR, SHORT if below.
>>>>> Divergence/Oscillator Analysis | RSI + MACD signal confirmation: LONG will only be open if at signal, RSI + MACD will be bullish, SHORT if RSI + MACD will be bearish.
>>>>> Volume signal confirmation: LONG/SHORT will only be opened with strong Volume matching the signal direction, by default, strong Volume percentage is set to 150% and weak to 50%, but you can change it as you desire.
===========================================================================
||||||||||||||||||||||||||||||||||| *** ||||||||||||||||||||||||||||||||||| *** |||||||||||||||||||||||||||||||||||
||||||||||||||||||||||||||||||||||| *** ||||||||||||||||||||||||||||||||||| *** |||||||||||||||||||||||||||||||||||
TP System - VERY IMPORTANT INFO!
-------------------------------------------------------------------------------------------------------------------
"TP PERCENTAGE" - amount by which current trade/position needs to be reduced/partially closed/sold.
-------------------------------------------------------------------------------------------------------------------
TP System: Dynamic
"TP PERCENTAGE" - will always be the same amount (trade/position size divided by the # of take-profit(TP) targets) and percentage to be closed will always be of the ORIGINAL trade/position.
-------------------------------------------------------------------------------------------------------------------
TP System: Static
"TP PERCENTAGE" - will always be the same amount IF take-profit(TP) targets are hit 1-by-1 (TP1 > TP2 > TP3 > TP4 > TP5), otherwise it will vary and unless it is a 1st take-profit(TP1), the REMAINING trade/position size will always be smaller than original and therefore the percentage to be closed will always be of the REMAINING trade/position and NOT the original one!
-------------------------------------------------------------------------------------------------------------------
"TP PERCENTAGE" CheatSheet (these are the only percentages you may see)
-----------------------------------------------------------------------
TP PERCENTAGE---Close/Sell Amount-------------Example (trade size: 50 stocks)
20%-------------trade size * 0.2--------------50 * 0.2 = 10 stocks
25%-------------trade size * 0.25-------------50 * 0.25 = 12.5(~13) stocks
34%-------------trade size * 0.34-------------50 * 0.34 = 17 stocks
40%-------------trade size * 0.4--------------50 * 0.4 = 20 stocks
50%-------------trade size * 0.5--------------50 * 0.5 = 25 stocks
60%-------------trade size * 0.6--------------50 * 0.6 = 30 stocks
66%-------------trade size * 0.66-------------50 * 0.66 = 33 stocks
75%-------------trade size * 0.75-------------50 * 0.75 = 37.5(~38) stocks
80%-------------trade size * 0.8--------------50 * 0.8 = 40 stocks
100%------------trade size--------------------50 = 50 stocks
-----------------------------------------------------------------------
If for any reason a portion of the current/remaining trade closed at such occurrence was slightly wrong, it is not an issue. Such occurrences are rare and with slight difference in partial TP closed is not significant to overall performance of our algorithms.
||||||||||||||||||||||||||||||||||| *** ||||||||||||||||||||||||||||||||||| *** |||||||||||||||||||||||||||||||||||
||||||||||||||||||||||||||||||||||| *** ||||||||||||||||||||||||||||||||||| *** |||||||||||||||||||||||||||||||||||
Alert Settings (you don’t have to touch this section unless you will be using TradingView alerts through a Webhook to use with trading bot)
---------------------------------------------------------------------------
Here is how a LONG OPEN alert looks like.
NOTE: Each label , , etc. is customizable, you can change the text of it within indicator Input settings.
ALERT >>>>>>>>>>>>>>>>>>>>>>>>>>>>>>>>>>>>>>>>>>>>>>>
COIN: BTCUSD
TIMEFRAME: 15M
LONG: OPEN
ENTRY: 20000
TP1: 20500
TP2: 21000
TP3: 21500
TP4: 22500
TP5: 23500
SL: 19000
Leverage: 0
---------------------------------------------------------------------------
Here is how a TP1 alert will look with 5 TPs breakdown of the trade.
NOTE1: Next to TP1 taken it will show at which price it was triggered.
NOTE2: Next to "TP Percentage" it shows how much of the CURRENT/ACTIVE/REMAINING trade needs to be closed.
NOTE2: If TP2/3/4/5 comes before TP1 - the alert will tell you exactly how many percent of the trade needs to be closed!
ALERT >>>>>>>>>>>>>>>>>>>>>>>>>>>>>>>>>>>>>>>>>>>>>>>
COIN: BTCUSD
TIMEFRAME: 15M
LONG: TP1
TP1: 20500
TP Percentage: 20%
---------------------------------------------------------------------------
Here is how an alert will look for LONG - STOP-LOSS.
ALERT >>>>>>>>>>>>>>>>>>>>>>>>>>>>>>>>>>>>>>>>>>>>>>>
COIN: BTCUSD
TIMEFRAME: 15M
ENTRY: 20000
LONG: SL
SL: 19000
---------------------------------------------------------------------------
Here is how an alert will look for LONG - EOD (End of Day) In Profit close.
ALERT >>>>>>>>>>>>>>>>>>>>>>>>>>>>>>>>>>>>>>>>>>>>>>>
COIN: BTCUSD
TIMEFRAME: 15M
LONG: EOD-Close (profit)
ENTRY: 20000
EOD-Close: 21900
===========================================================================
Adding Alerts in TradngView
---------------------------------------------------------------------------
-Add indicator to chart and make sure the correct strategy is configured (check Backtesting results)
-Right-click anywhere on the TradingView chart
-Click on Add alert
-Condition: Select this indicator by it’s name
-Immediately below, change it to "alert() function calls only", as other wise there will be 2 alerts for every alert!
-Expiration: Open-ended (that may require higher tier TradingView account, otherwise the alert will need to be occasionally re-triggered)
-Alert name: Whatever you desire
-Hit “Create”
-Note: If you change ANY Settings within the indicator – you must DELETE the current alert and create a new one per steps above, otherwise it will continue triggering alerts per old Settings!
===========================================================================
If you have any questions or issues with the indicator, please message me directly via TradingView.
---------------------------------------------------------------------------
Good Luck! (NOTE: Trading is very risky, past performance is not necessarily indicative of future results, so please trade responsibly!)
---------------------------------------------------------------------------
NOTE: There seems to be a strange glitch when strategy is running live, it will show "double-take" take-profits labels on the chart. This is not affecting the script logic and backtesting results, if you simply change the timeframe real quick to something else then back - it will no longer show the duplicate orders... this must be some sort of a glitch as every alert was thoroughly tested to make sure everything is working!

Trend Confirmation StrategyThe profitability and uniqueness of a trading strategy depend on various factors including market conditions, risk management, and the strategy's ability to capitalize on price movements. I'll describe the strategy provided and highlight its potential benefits and differences compared to other strategies:
Strategy Overview:
The provided strategy combines three technical indicators: Supertrend, MACD, and VWAP. It aims to identify potential entry and exit points by confirming trend direction and considering the proximity to the VWAP level. The strategy also incorporates stop-loss and take-profit mechanisms, as well as a trailing stop.
Unique Aspects and Potential Benefits:
Trend Confirmation: The strategy uses both Supertrend and MACD to confirm the trend direction. This dual confirmation can increase the likelihood of accurate trend identification and filter out false signals.
VWAP Confirmation: The strategy considers the proximity of the price to the VWAP level. This dynamic level can act as a support or resistance and provide additional context for entry decisions.
Adaptive Stop Loss: The strategy sets a stop-loss range, which helps provide some tolerance for minor price fluctuations. This adaptive approach considers market volatility and helps prevent premature stop-loss triggers.
Trailing Stop: The strategy incorporates a trailing stop mechanism to lock in profits as the trade moves in the desired direction. This can potentially enhance profitability during strong trends.
Partial Profit Booking: While not explicitly implemented in the provided code, you could consider booking partial profits when the MACD shows a crossover in the opposite direction. This aspect could help secure gains while still keeping exposure to potential further price movements.
Key Differences from Other Strategies:
Dual Indicator Confirmation: The combination of Supertrend and MACD for trend confirmation is a unique aspect of this strategy. It adds an extra layer of filtering to enhance the accuracy of entry signals.
Dynamic VWAP: Incorporating the VWAP level into the decision-making process adds a dynamic element to the strategy. VWAP is often used by institutional traders, and its inclusion can provide insights into the market sentiment.
Adaptive Stop Loss and Trailing: The strategy's use of an adaptive stop-loss range and a trailing stop can help manage risk and protect profits more effectively during changing market conditions.
Partial Profit Booking: The suggestion to consider partial profit booking upon MACD crossovers in the opposite direction is a practical approach to secure gains while staying in the trade.
Caution and Considerations:
Backtesting: Before deploying any strategy in real trading, it's crucial to thoroughly backtest it on historical data to understand its performance under various market conditions.
Risk Management: While the strategy has built-in risk management mechanisms, it's essential to carefully manage position sizes and overall portfolio risk.
Market Conditions: No strategy works well in all market conditions. It's important to be flexible and adjust the strategy or refrain from trading during particularly volatile or unpredictable periods.
Continuous Monitoring: Even though the strategy includes automated components, continuous monitoring of the trades and market conditions is necessary.
Adaptability: Markets can change over time. Traders need to be prepared to adapt the strategy as necessary to stay aligned with evolving market dynamics.

[Camarilla Pivots] Signal Clean Up Analysis with Backtest (TSO)Camarilla Pivots NEW GEN Indicator!
This is a full-cycle trading system indicator, which uses Camarilla Pivots for generating signals using a custom developed algorithm, TP (Take Profit) and SL (Stop Loss) levels. There are 3 SOURCES for signals (each can be used separately or in combination or all 3 can be used at the same time, each signal SOURCE is using Camarilla Pivots levels to open optimal trade direction) with chained (NOTE: There are many potential profitable setups available, by combining clean up features availabe in the indicator settings!) signal cleanup and analysis approach with scheduling and alerting capabilities. Works best with shorter timeframes: 1M, 5M, 15M, 1H.
NOTE: Every calculation is done on a confirmed closed candle bar state, so the indicator will never repaint!
NOTE: At position open - there will be calculated Take-Profit and Stop-Loss targets, however each target is considered hit, when candle bar closes breaking that target, so Take-Profit and Stop-Loss when hit will slightly differ then what you see at position open!
===========================================================================
Explanation of all the Features | Configuration Guide | Indicator Settings | Signal Cleanup Analysis
---------------------------------------------------------------------------
>>> Customizable Backtesting for a specific date range, results via TradingView strategy, which includes “Deep Backtesting” for largest amounts of data on trading results.
>>> Trading Schedule with customizable trading daily time range, automatic closing/alert trades before Power Hour or right before market closes or leave it open until next day.
>>> 3 Trading Systems.
>>> Multiple Signal SOURCEs for opening trades, either SOURCE can be used or both at the same time!
>>> Static/Dynamic Stop-Loss setups (HIGHLIGHT: Stop-Loss will be moved to Entry after TP1 is taken, which minimizes risk).
>>> Single or Multiple profit targets (up to 5).
>>> Take-Profit customizable offset feature (set your Take-Profit targets slightly before everyone is expecting it!).
>>> Candle bar signal analysis (matching candle color, skip opposite structured and/or doji candle uncertain signals).
>>> Additional analysis of VWAP/EMA/ATR/EWO (Elliot Wave Oscillator)/Divergence MACD+RSI/Volume signal confirmation (clean up your chart with indicator showing only the best potential signals!).
>>> Advanced Alerts setup, which can be potentially setup with a trading bot over TradingView Webhook (NOTE: This will require advanced programming knowledge).
===========================================================================
Labels, plots, colors explanations:
---------------------------------------------------------------------------
>>>>> LONG open: green "house" looking arrow below candle bar.
>>>>> SHORT open: red "house" looking arrow above candle bar.
>>>>> LONG/SHORT take-profit target: green/red circles (multi-profit > TP2/3/4/5 smaller circles).
>>>>> LONG/SHORT stop-loss target: green/red + crosses.
>>>>> LONG/SHORT take-profit hits: green/red diamonds.
>>>>> LONG/SHORT stop-loss hits: green/red X-crosses.
>>>>> LONG/SHORT EOD (End of Day | Intraday style) close (profitable trade): green/red squares.
>>>>> LONG/SHORT EOD (End of Day | Intraday style) close (loss trade): green/red PLUS(+)-crosses.
===========================================================================
Date Range and Trading Schedule Settings
---------------------------------------------------------------------------
>>>>> Date Range: Select your start and/or end dates (uncheck “End” for indicator to show results up to the very moment and to use for LIVE trading) for backtesting results, if not using backtesting – uncheck “Start”/“End” to turn it off.
>>>>> Use TradingView “Strategy Tester” to see backtesting results
NOTE: If Strategy Tester does not show any results with Date Ranged fully unchecked, there may be an issue where a script opens a trade, but there is not enough TradingView power to set the Take-Profit and Stop-Loss and somehow an open trade gets stuck and never closes, so there are “no trades present”. In such case you will need to manually check “Start”/“End” dates or use “Depp Backtesting” feature!
>>>>> Trading Schedule: This is where you can setup Intraday Session or any custom session schedule you wish. Turn it ON. Select trading hours. Select EOD (End of Day) setting (NOTE: If it will be OFF, the indicator will assume you are holding your position open until next day!). Please note the EOD trade closure times with the 2 different Intraday close settings when turned on:
At Market Close:
1/3/5min > will close at 15:55pm ET
15min > will close at 15:45pm ET
30min > will close at 15:30pm ET
45min > will close at 15:45pm ET
60min > will close at 15:00pm ET
Before Power Hour:
1/3/5min > will close at 15:00pm ET
15min > will close at 15:00pm ET
30min > will close at 15:00pm ET
45min > will close at 15:00pm ET
60min > will close at 15:00pm ET
>>> Trading Systems: 1) "Open Until Closed by TP or SL": the signal will only open a trade if no trades are currently open/trunning, a trade can only be closed by Take Profit, Stop Loss or End of Day close (if turned on) | 2) "Open Until Closed by TP or SL + OCA": Same as 1), but if there is an opposite signal to the trade which is currently open > it will immediately be closed with new trade open or End of Day close (if turned on) | 3) "OCA (no TP or SL)": There are is Take Profit or Stop Loss, only an opposite signal will close current trade and open an opposite one or End of Day close (if turned on).
>>> Position Open sources:
>>>>> Position Open - SOURCE1 | LONG: S3, SL: S4, TP1: R3, TP2: R4, TP3: R5, TP4/5: Smart Formula | SHORT: R3, SL: R4, TP1: S3, TP2: S4, TP3: S5, TP4/5: Smart Formula
>>>>> Position Open - SOURCE2 | LONG: R4, SL: R3, TP1: R5, TP2/3/4/5: Smart Formula | SHORT: S4, SL: S3, TP1: S5, TP2/3/4/5: Smart Formula
>>>>> Position Open - SOURCE3 | LONG: R5, SL: R4, TP1/2/3/4/5: Smart Formula | SHORT: S5, SL: S4, TP1/2/3/4/5: Smart Formula
>>> Turn On/Off: Current Position SL + Opposite Position Open Signal on the same closing candle bar (If current trade hits Stop-Loss and at that same closing candle bar there is a signal for an opposite direction trade > indicator will close current position as Stop-Loss and immediately open an opposite position). NOTE: With this option turned on, there will be more trades, but not necessarily better results, since after Stop-Loss is hit, it may make sense to wait a little before opening an opposite trade, even if it matches the condition at the same time when Stop-Loss is hit, but sometimes it shows great results, so this setting/feature is included.
>>> Turn On/Off: Turn On/Off: Current Position REGULAR SL | Only the SL + Opposite Position Open will trigger if turned on, IF NOT - THERE WILL BE NO STOP-LOSS AT ALL!!! NOTE: It is very dangerous to trade without Stop-Loss!
>>>>> Signal Candle Bar consuming Take-Profits - position/trade signal candle bar is big enought to "consume"/close ahead the first TP setting > the signal can either be skipped, or all Take-Profit areas pushed ahead using smart formula)
>>>>> MULTIPROFIT | TP (Take-Profit) System: Once the trade is open, all Take-Profit target(s) are immediately calculated and set for the trade > once the target(s) is hit > trade will be partially closed (if candle bar closes beyond several Take-Profit targets > trade will be reduced accordingly to the amount of how many Take-Profit targets were hit)
>>>>> MULTIPROFIT | SL (Stop-Loss) System: 1) Static – Once the trade is open, Stop-Loss is calculated and set for the remaining of the trade ||| 2) Dynamic – At trade open, Stop-Loss is calculated and set the same way, however once 1st Take-Profit is taken > Stop-Loss is moved to Entry, reducing the risk.
>>>>> # of TPs (number of take profit targets): Just like it is named, this is where you select the number of Take-Profit targets for your trading system (NOTE: If "OCA (no TP or SL)" Trading System is selected, this setting won’t do anything, since there are no TP or SLs for that system).
>>>>> TP(s) offset: This is a special feature for all Take-Profit targets, where you can turn on a customizable offset, so that if the price is almost hitting the Take-Profit target, but never actually touches it > you will capture it. This is good to use with HHLL (Highest High Lowest Low), which is pretty much a Support/Resistance as often the price will nearly touch these strong areas and turn around…
===========================================================================
Signal Analysis and Cleanup Settings
---------------------------------------------------------------------------
>>>>> Candle Analysis | Candle Color signal confirmation: If closed candle bar color does not match the signal direction > no trade will be open.
>>>>> Candle Analysis | Skip opposite candle signals: If closed candle bar color will match the signal direction, but candle structure will be opposite (for example: bearish green hammer, long high stick on top of a small green square) > no trade will be open.
>>>>> Candle Analysis | Skip doji candle signals: If closed candle bar will be the uncertain doji > no trade will be open.
>>>>> Divergence/Oscillator Analysis | EWO (Elliot Wave Oscillator) signal confirmation: LONG will only be open if at signal, EWO is green or will be at bullish slope (you can select which setting you desire), SHORT if EWO is red or will be at bearish slope.
>>>>> Divergence/Oscillator Analysis | VWAP signal confirmation: LONG will only be open if at signal, the price will be above VWAP, SHORT if below.
>>>>> Divergence/Oscillator Analysis | Moving Average signal confirmation: LONG will only be open if at signal, the price will be above selected Moving Average, SHORT if below.
>>>>> Divergence/Oscillator Analysis | ATR signal confirmation: LONG will only be open if at signal, the price will be above ATR, SHORT if below.
>>>>> Divergence/Oscillator Analysis | RSI + MACD signal confirmation: LONG will only be open if at signal, RSI + MACD will be bullish, SHORT if RSI + MACD will be bearish.
>>>>> Volume signal confirmation: LONG/SHORT will only be opened with strong Volume matching the signal direction, by default, strong Volume percentage is set to 150% and weak to 50%, but you can change it as you desire.
===========================================================================
||||||||||||||||||||||||||||||||||| *** ||||||||||||||||||||||||||||||||||| *** |||||||||||||||||||||||||||||||||||
||||||||||||||||||||||||||||||||||| *** ||||||||||||||||||||||||||||||||||| *** |||||||||||||||||||||||||||||||||||
TP System - VERY IMPORTANT INFO!
-------------------------------------------------------------------------------------------------------------------
"TP PERCENTAGE" - amount by which current trade/position needs to be reduced/partially closed/sold.
-------------------------------------------------------------------------------------------------------------------
TP System: Dynamic
"TP PERCENTAGE" - will always be the same amount (trade/position size divided by the # of take-profit(TP) targets) and percentage to be closed will always be of the ORIGINAL trade/position.
-------------------------------------------------------------------------------------------------------------------
TP System: Static
"TP PERCENTAGE" - will always be the same amount IF take-profit(TP) targets are hit 1-by-1 (TP1 > TP2 > TP3 > TP4 > TP5), otherwise it will vary and unless it is a 1st take-profit(TP1), the REMAINING trade/position size will always be smaller than original and therefore the percentage to be closed will always be of the REMAINING trade/position and NOT the original one!
-------------------------------------------------------------------------------------------------------------------
"TP PERCENTAGE" CheatSheet (these are the only percentages you may see)
-----------------------------------------------------------------------
TP PERCENTAGE---Close/Sell Amount-------------Example (trade size: 50 stocks)
20%-------------trade size * 0.2--------------50 * 0.2 = 10 stocks
25%-------------trade size * 0.25-------------50 * 0.25 = 12.5(~13) stocks
34%-------------trade size * 0.34-------------50 * 0.34 = 17 stocks
40%-------------trade size * 0.4--------------50 * 0.4 = 20 stocks
50%-------------trade size * 0.5--------------50 * 0.5 = 25 stocks
60%-------------trade size * 0.6--------------50 * 0.6 = 30 stocks
66%-------------trade size * 0.66-------------50 * 0.66 = 33 stocks
75%-------------trade size * 0.75-------------50 * 0.75 = 37.5(~38) stocks
80%-------------trade size * 0.8--------------50 * 0.8 = 40 stocks
100%------------trade size--------------------50 = 50 stocks
-----------------------------------------------------------------------
If for any reason a portion of the current/remaining trade closed at such occurrence was slightly wrong, it is not an issue. Such occurrences are rare and with slight difference in partial TP closed is not significant to overall performance of our algorithms.
||||||||||||||||||||||||||||||||||| *** ||||||||||||||||||||||||||||||||||| *** |||||||||||||||||||||||||||||||||||
||||||||||||||||||||||||||||||||||| *** ||||||||||||||||||||||||||||||||||| *** |||||||||||||||||||||||||||||||||||
Alert Settings (you don’t have to touch this section unless you will be using TradingView alerts through a Webhook to use with trading bot)
---------------------------------------------------------------------------
Here is how a LONG OPEN alert looks like.
NOTE: Each label , , etc. is customizable, you can change the text of it within indicator Input settings.
ALERT >>>>>>>>>>>>>>>>>>>>>>>>>>>>>>>>>>>>>>>>>>>>>>>
COIN: BTCUSD
TIMEFRAME: 15M
LONG: OPEN
ENTRY: 20000
TP1: 20500
TP2: 21000
TP3: 21500
TP4: 22500
TP5: 23500
SL: 19000
Leverage: 0
---------------------------------------------------------------------------
Here is how a TP1 alert will look with 5 TPs breakdown of the trade.
NOTE1: Next to TP1 taken it will show at which price it was triggered.
NOTE2: Next to "TP Percentage" it shows how much of the CURRENT/ACTIVE/REMAINING trade needs to be closed.
NOTE2: If TP2/3/4/5 comes before TP1 - the alert will tell you exactly how many percent of the trade needs to be closed!
ALERT >>>>>>>>>>>>>>>>>>>>>>>>>>>>>>>>>>>>>>>>>>>>>>>
COIN: BTCUSD
TIMEFRAME: 15M
LONG: TP1
TP1: 20500
TP Percentage: 20%
---------------------------------------------------------------------------
Here is how an alert will look for LONG - STOP-LOSS.
ALERT >>>>>>>>>>>>>>>>>>>>>>>>>>>>>>>>>>>>>>>>>>>>>>>
COIN: BTCUSD
TIMEFRAME: 15M
ENTRY: 20000
LONG: SL
SL: 19000
---------------------------------------------------------------------------
Here is how an alert will look for LONG - EOD (End of Day) In Profit close.
ALERT >>>>>>>>>>>>>>>>>>>>>>>>>>>>>>>>>>>>>>>>>>>>>>>
COIN: BTCUSD
TIMEFRAME: 15M
LONG: EOD-Close (profit)
ENTRY: 20000
EOD-Close: 21900
===========================================================================
Adding Alerts in TradngView
---------------------------------------------------------------------------
-Add indicator to chart and make sure it is configured (check back-testing results)
-Right-click anywhere on the TradingView chart
-Click on Add alert
-Condition: Select this indicator by it’s name
-Alert name: Whatever you want
-Hit “Create”
-Note: If you change ANY Settings within the indicator – you must DELETE the current alert and create a new one per steps above, otherwise it will continue triggering alerts per old Settings!
===========================================================================
If you have any questions or issues with the indicator, please message me directly via TradingView.
---------------------------------------------------------------------------
Good Luck! (NOTE: Trading is very risky, past performance is not necessarily indicative of future results, so please trade responsibly!)
---------------------------------------------------------------------------
NOTE: There seems to be a strange glitch when strategy is running live, it will show "double-take" take-profits labels on the chart. This is not affecting the script logic and backtesting results, if you will remove/re-add the script afterwards, it will no longer show the duplicate orders... this must be some sort of a glitch as every alert was thoroughly tested to make sure everything is working!

[Volume Profile] Signal Clean Up Analysis with Backtest (TSO) This is a full-cycle trading system indicator, which uses Volume Profile for generating signals using a custom developed algorithm, TP (Take Profit) and SL (Stop Loss) levels. There are 2 SOURCES for signals (each can be used separately or both can be used at the same time, each signal SOURCE is using Volume Profile levels to open optimal trade direction) with chained (NOTE: You can select several or ALL of the features, this is not limited to either one) signal cleanup and analysis approach with scheduling and alerting capabilities. Works with most popular timeframes: 1M, 5M, 15M, 1H, 4H, D, great for intraday trading!
NOTE: Every calculation is done on a confirmed closed candle bar state, so the indicator will never repaint!
===========================================================================
Explanation of all the Features | Configuration Guide | Indicator Settings | Signal Cleanup Analysis
---------------------------------------------------------------------------
>>> Customizable Backtesting for a specific date range, results via TradingView strategy, which includes “Deep Backtesting” for largest amounts of data on trading results.
>>> Trading Schedule with customizable trading daily time range, automatic closing/alert trades before Power Hour or right before market closes or leave it open until next day.
>>> 3 Trading Systems.
>>> Multiple Signal SOURCEs for opening trades, either SOURCE can be used or both at the same time!
>>> Static/Dynamic Stop-Loss setups (HIGHLIGHT: Stop-Loss will be moved to Entry after TP1 is taken, which minimizes risk).
>>> Single or Multiple profit targets (up to 3).
>>> Take-Profit customizable offset feature (set your Take-Profit targets slightly before everyone is expecting it!).
>>> Candle bar signal analysis (matching candle color, skip opposite structured and/or doji candle uncertain signals).
>>> Additional analysis of VWAP/EMA/ATR/EWO (Elliot Wave Oscillator)/Divergence MACD+RSI/Volume signal confirmation (clean up your chart with indicator showing only the best potential signals!).
>>> Advanced Alerts setup, which can be potentially setup with a trading bot over TradingView Webhook (NOTE: This will require advanced programming knowledge).
===========================================================================
Labels, plots, colors explanations:
---------------------------------------------------------------------------
>>>>> Signal SOURCE(s): Green/Red arrows, which will be shown unconditionally, outside of trade engine and can be hidden if desired.
>>>>> LONG open: green "house" looking arrow below candle bar.
>>>>> SHORT open: red "house" looking arrow above candle bar.
>>>>> LONG/SHORT take-profit target: green/red circles (multi-profit > TP2/3/4/5 smaller circles).
>>>>> LONG/SHORT take-profit hits: green/red diamonds.
>>>>> LONG/SHORT stop-loss target: green/red + crosses.
>>>>> LONG/SHORT stop-loss hits: green/red X-crosses.
>>>>> LONG/SHORT EOD close (profitable trade): green/red squares.
>>>>> LONG/SHORT EOD close (loss trade): green/red PLUS(+)-crosses.
===========================================================================
Date Range and Trading Schedule Settings
---------------------------------------------------------------------------
>>>>> Date Range: Select your start and/or end dates (uncheck “End” for indicator to show results up to the very moment and to use for LIVE trading) for backtesting results, if not using backtesting – uncheck “Start”/“End” to turn it off.
>>>>> Use TradingView “Strategy Tester” to see backtesting results
NOTE: If Strategy Tester does not show any results with Date Ranged fully unchecked, there may be an issue where a script opens a trade, but there is not enough TradingView power to set the Take-Profit and Stop-Loss and somehow an open trade gets stuck and never closes, so there are “no trades present”. In such case you will need to manually check “Start”/“End” dates or use “Depp Backtesting” feature!
>>>>> Trading Schedule: This is where you can setup Intraday Session or any custom session schedule you wish. Turn it ON. Select trading hours. Select EOD (End of Day) setting (NOTE: If it will be OFF, the indicator will assume you are holding your position open until next day!).
>>> Trading Systems: 1) "Open Until Closed by TP or SL": the signal will only open a trade if no trades are currently open/trunning, a trade can only be closed by Take Profit, Stop Loss or End of Day close (if turned on) | 2) "Open Until Closed by TP or SL + OCA": Same as 1), but if there is an opposite signal to the trade which is currently open > it will immediately be closed with new trade open or End of Day close (if turned on) | 3) "OCA (no TP or SL)": There are is Take Profit or Stop Loss, only an opposite signal will close current trade and open an opposite one or End of Day close (if turned on)
>>>>> MULTIPROFIT | TP (Take-Profit) System: Once the trade is open, all Take-Profit target(s) are immediately calculated and set for the trade > once the target(s) is hit > trade will be partially closed (if candle bar closes beyond several Take-Profit targets > trade will be reduced accordingly to the amount of how many Take-Profit targets were hit)
>>>>> MULTIPROFIT | SL (Stop-Loss) System: 1) Static – Once the trade is open, Stop-Loss is calculated and set for the remaining of the trade ||| 2) Dynamic – At trade open, Stop-Loss is calculated and set the same way, however once 1st Take-Profit is taken > Stop-Loss is moved to Entry, reducing the risk.
>>>>> # of TPs (number of take profit targets): Just like it is named, this is where you select the number of Take-Profit targets for your trading system (NOTE: If "OCA (no TP or SL)" Trading System is selected, this setting won’t do anything, since there are no TP or SLs for that system).
>>>>> TP(s) offset: This is a special feature for all Take-Profit targets, where you can turn on a customizable offset, so that if the price is almost hitting the Take-Profit target, but never actually touches it > you will capture it. This is good to use with HHLL (Highest High Lowest Low), which is pretty much a Support/Resistance as often the price will nearly touch these strong areas and turn around…
===========================================================================
Take-Profit and Stop-Loss visual example:
---------------------------------------------------------------------------
1) A simply nice intraday trading day for SPY (S&P500 ETF TRUST) with a single Take-Profit target on each trade.
See how Take-Profit distances increase with price momentum and how Stop-Loss is following the trade reducing the risk!
2) Same intraday trading day for SPY (S&P500 ETF TRUST) with 3 Take-Profit targets with static Stop-Loss.
3) Same intraday trading day for SPY (S&P500 ETF TRUST) with 3 Take-Profit targets with dynamic Stop-Loss.
You can see how Stop-Loss was moved once TP1 is taken!
===========================================================================
Trade Analysis and Cleanup Settings
---------------------------------------------------------------------------
>>>>> Candle Analysis | Candle Color signal confirmation: If closed candle bar color does not match the signal direction > no trade will be open.
>>>>> Candle Analysis | Skip opposite candle signals: If closed candle bar color will match the signal direction, but candle structure will be opposite (for example: bearish green hammer, long high stick on top of a small green square) > no trade will be open.
>>>>> Candle Analysis | Skip doji candle signals: If closed candle bar will be the uncertain doji > no trade will be open.
>>>>> Divergence/Oscillator Analysis | EWO (Elliot Wave Oscillator) signal confirmation: LONG will only be open if at signal, EWO is green or will be at bullish slope (you can select which setting you desire), SHORT if EWO is red or will be at bearish slope.
>>>>> Divergence/Oscillator Analysis | VWAP signal confirmation: LONG will only be open if at signal, the price will be above VWAP, SHORT if below.
>>>>> Divergence/Oscillator Analysis | Moving Average signal confirmation: LONG will only be open if at signal, the price will be above selected Moving Average, SHORT if below.
>>>>> Divergence/Oscillator Analysis | ATR signal confirmation: LONG will only be open if at signal, the price will be above ATR, SHORT if below.
>>>>> Divergence/Oscillator Analysis | RSI + MACD signal confirmation: LONG will only be open if at signal, RSI + MACD will be bullish, SHORT if RSI + MACD will be bearish.
>>>>> Volume signal confirmation: LONG/SHORT will only be open if closing candle volume is 150% above average Volume based on the Volume Length.
===========================================================================
Alert Settings (you don’t have to touch this section unless you will be using TradingView alerts through a Webhook to use with trading bot)
---------------------------------------------------------------------------
Here is how a LONG OPEN alert looks like (each label is customizable + I can add up more items/labels if needed):
COIN: BTCUSD
TIMEFRAME: 15M
LONG: OPEN
ENTRY: 20000
TP1: 20500
TP2: 21000
TP3: 21500
SL: 19000
Leverage: 0
===========================================================================
Adding Alerts in TradngView
---------------------------------------------------------------------------
-Right-click anywhere on the TradingView chart
-Click on Add alert
-Condition: Select this indicator by it’s name
-Alert name: Whatever you want
-Hit “Create”
-Note: If you change ANY Settings within the indicator – you must DELETE the current alert and create a new one per steps above, otherwise it will continue triggering alerts per old Settings!
===========================================================================
If you have any questions or issues with the indicator, please message me directly via TradingView.
---------------------------------------------------------------------------
Good Luck! (NOTE: Trading is very risky, past performance is not necessarily indicative of future results, so please trade responsibly!)

[SMA Cross + HHLL] Signal Clean Up Analysis with Backtest (TSO) This is a DEMO indicator with a simple 2 SMAs cross for signals + HHLL for TP/SL. It mainly demonstrates chained (NOTE: You can select several or ALL of the features, this is not limited to either one) signal cleanup and analysis approach with scheduling and alerting capabilities. Works with most popular timeframes: 1M, 5M, 15M, 1H, 4H, D.
===========================================================================
Here are some pre-set examples with nice Backtesting results (try em out!):
---------------------------------------------------------------------------
>>> Indexes – SPY (INTRADAY SETUP ): Timeframe: 5M | Trading Schedule: ON, 10:00-15:45 ET, EOD: At Market Close | Trading System: Open Until Closed by TP or SL | MULTIPROFIT: TP (take profit) System: Dynamic | MULTIPROFIT: SL (stop loss) System (This is only for “Dynamic” TP System ONLY!!!): Dynamic | # of TPs: 5 | Skip opposite candle types in signals, which are opposite to direction of candle color (for example: bearish green hammer) | Everything else: Default
>>> Bitcoin – BTCUSD (24/7 SETUP): Timeframe: 1H | Trading Schedule: OFF, End of Day (EOD): OFF | Trading System: Open Until Closed by TP or SL | MULTIPROFIT: TP (take profit) System: Dynamic | MULTIPROFIT: SL (stop loss) System (This is only for “Dynamic” TP System ONLY!!!): Dynamic | # of TPs: 3 | TP(s) Offset: on, TP(s) offset amount: 50 | ATR confirmation | Everything else: Default
===========================================================================
Explanation of all the Features | Configuration Guide | Indicator Settings
---------------------------------------------------------------------------
---------------------------------------------------------------------------
Signal cleanup analysis:
---------------------------------------------------------------------------
>>> Customizable Backtesting for a specific date range, results via TradingView strategy, which includes “Deep Backtesting” for largest amounts of data on trading results.
>>> Trading Schedule with customizable trading daily time range, automatic closing/alert trades before Power Hour or right before market closes or leave it open until next day.
>>> 3 Trading Systems.
>>> Static/Dynamic Take-Profit setups (HILIGHT: momentum catch dynamic Take-Profit approach).
>>> Static/Dynamic Stop-Loss setups (HIGHLIGHT: smart trailing Stop-Loss which minimizes risk).
>>> Single or Multiple profit targets (up to 5).
>>> Take-Profit customizable offset feature (set your Take-Profit targets slightly before everyone is expecting it!).
>>> Candle bar signal analysis (skip opposite structured and/or doji candle uncertain signals).
>>> Additional analysis of VWAP/EMA/ATR/EWO (Elliot Wave Oscillator)/Divergence MACD+RSI signal confirmation (clean up your chart with indicator showing only the best potential signals!).
>>> Advanced Alerts setup, which can be potentially setup with a trading bot over TradingView Webhook (NOTE: This will require advanced programming knowledge).
>>> Customize your signal SOURCE and your Take-Profit/Stop-Loss SOURCES as you desire.
===========================================================================
Labels, plots, colors explanations:
---------------------------------------------------------------------------
>>>>> Signal SOURCE: SMA crossings (green and red BIG circles) .
>>>>> Take-profit/Stop-loss SOURCE: HHLL (Highest High Lowest Low) .
>>>>> LONG open: green arrow below candle bar.
>>>>> SHORT open: red arrow above candle bar.
>>>>> LONG/SHORT take-profit target: green/red circles (multi-profit > TP2/3/4/5 smaller circles).
>>>>> LONG/SHORT take-profit hits: green/red diamonds.
>>>>> LONG/SHORT stop-loss target: green/red + crosses.
>>>>> LONG/SHORT stop-loss hits: green/red X-crosses.
>>>>> LONG/SHORT EOD close (profitable trade): green/red squares.
>>>>> LONG/SHORT EOD close (loss trade): green/red PLUS(+)-crosses.
===========================================================================
Date Range and Trading Schedule Settings
---------------------------------------------------------------------------
>>>>> Date Range: Select your start and/or end dates (uncheck “End” for indicator to show results up to the very moment and to use for LIVE trading) for backtesting results, if not using backtesting – uncheck “Start”/“End” to turn it off.
---------------------------------------------------------------------------
>>>>> Use TradingView “Strategy Tester” to see backtesting results
---------------------------------------------------------------------------
NOTE: If Strategy Tester does not show any results with Date Ranged fully unchecked, there may be an issue where a script opens a trade, but there is not enough TradingView power to set the Take-Profit and Stop-Loss and somehow an open trade gets stuck and never closes, so there are “no trades present”. In such case you will need to manually check “Start”/“End” dates or use “Depp Backtesting” feature!
---------------------------------------------------------------------------
>>>>> Trading Schedule: This is where you can setup Intraday Session or any custom session schedule you wish. Turn it ON. Select trading hours. Select EOD (End of Day) setting (NOTE: If it will be OFF, the indicator will assume you are holding your position open until next day!).
>>>>> Trading System: 1) Open Until Closed by TP or SL – once the trade is open, it can only be closed by Take-Profit, Stop-Loss or at EOD (if turned on) ||| 2) OCA – Opposite Trade will Open Closing Current Trade – Same as 1), except that when and if an OPPOSITE signal is received > indicator will close current trade immediately (profit or loss) and open a new one(NOTE: This will only happen with an OPPOSITE direction trade!) ||| 3) Open Until Opposite Signal or EOD (if turned on) – This approach is the simplest one, there are no Take-Profits or Stop-Losses, the trade is open until an OPPOSITE signal is received or until EOD (if turned on).
Take-Profit, Stop-Loss and Multi-Profit Settings
>>>>> MULTIPROFIT | TP (Take-Profit) System: 1) Static – Once the trade is open, all Take-Profit target(s) are immediately calculated and set for the trade > once the target(s) is hit > trade will be partially closed (if candle bar closes beyond several Take-Profit targets > trade will be reduced accordingly to the amount of how many Take-Profit targets were hit) ||| 2) Dynamic – Once the trade is open, only the 1st Take-Profit target is calculated, once the 1st Take-Profit is hit > next Take-Profit distance is calculated based on the distance from trade Entry to where 1st Take-Profit was taken, once 2nd Take-Profit is taken > 3rd Take-Profit is calculated per same logic, these are good for price momentum as with price speeding up – profits increase as well!
NOTE: Below 2 settings, each correspond to only 1 setting of the TP (Take-Profit) System, please pay attention to the above TP system setting before changing SL settings!
>>>>> MULTIPROFIT | SL (Stop-Loss) System : 1) Static – Once the trade is open, Stop-Loss is calculated and set for the remaining of the trade ||| 2) Dynamic – At trade open, Stop-Loss is calculated and set the same way, however once 1st Take-Profit is taken > Stop-Loss is moved to Entry, reducing the risk.
>>>>> MULTIPROFIT | SL (Stop-Loss) System : 1) Static - Once the trade is open, Stop-Loss is calculated and set for the remaining of the trade ||| 2) Dynamic – At trade open, Stop-Loss is calculated and set the same way, however with each Take-Profit taken, Stop-Loss will be moved to previous Take-Profit (TP1 taken > SL:Entry | TP2 taken > SL:TP1 | TP3 taken > SL:TP2 | TP4 taken > SL:TP3 | TP5 taken > trade closed), this is basically a smart Stop-Loss trailing system!
>>>>> # of TPs (number of take profit targets): Just like it is named, this is where you select the number of Take-Profit targets for your trading system (NOTE: If “3) Open Until Opposite Signal or EOD (if turned on)” Trading System is selected, this setting won’t do anything, since there are no TP or SLs for that system).
>>>>> TP(s) offset: This is a special feature for all Take-Profit targets, where you can turn on a customizable offset, so that if the price is almost hitting the Take-Profit target, but never actually touches it > you will capture it. This is good to use with HHLL (Highest High Lowest Low), which is pretty much a Support/Resistance as often the price will nearly touch these strong areas and turn around…
---------------------------------------------------------------------------
Dynamic/Static Take-Profit and Stop-Loss visual examples:
1) Fully Dynamic Take-Profit and Stop-Loss setup for BTCUSD
See how Take-Profit distances increase with price momentum and how Stop-Loss is following the trade reducing the risk!
2) Static/Dynamic, Static Take-Profit and Dynamic Stop-Loss setup for SPY (S&P500 ETF TRUST)
You can see a static Take-Profit set at position open, while Stop-Loss is semi-dynamic adjusting to Entry once TP1 target is taken!
3) Fully Static Take-Profit and Stop-Loss setup for SPY (S&P500 ETF TRUST)
This one is a fully static setup for both Take-Profit and Stop-Loss, you can also observe how trade is closed right before the Power Hour (trade can be closed right before Power Hour or right before Market Closes or left overnight as you desire).
---------------------------------------------------------------------------
Trade Analysis and Cleanup Settings
>>>>> Candle Analysis | Candle Color signal confirmation: If closed candle bar color does not match the signal direction > no trade will be open.
>>>>> Candle Analysis | Skip opposite candle signals: If closed candle bar color will match the signal direction, but candle structure will be opposite (for example: bearish green hammer, long high stick on top of a small green square) > no trade will be open.
>>>>> Candle Analysis | Skip doji candle signals: If closed candle bar will be the uncertain doji > no trade will be open.
>>>>> Divergence/Oscillator Analysis | EWO (Elliot Wave Oscillator) signal confirmation: LONG will only be open if at signal, EWO is green or will be at bullish slope (you can select which setting you desire), SHORT if EWO is red or will be at bearish slope.
>>>>> Divergence/Oscillator Analysis | VWAP signal confirmation: LONG will only be open if at signal, the price will be above VWAP, SHORT if below.
>>>>> Divergence/Oscillator Analysis | Moving Average signal confirmation: LONG will only be open if at signal, the price will be above selected Moving Average, SHORT if below.
>>>>> Divergence/Oscillator Analysis | ATR signal confirmation: LONG will only be open if at signal, the price will be above ATR, SHORT if below.
>>>>> Divergence/Oscillator Analysis | RSI + MACD signal confirmation: LONG will only be open if at signal, RSI + MACD will be bullish, SHORT if RSI + MACD will be bearish.
===========================================================================
Alert Settings (you don’t have to touch this section unless you will be using TradingView alerts through a Webhook to use with trading bot)
---------------------------------------------------------------------------
Here is how a LONG OPEN alert looks like (each label is customizable + I can add up more items/labels if needed):
COIN: BTCUSD
TIMEFRAME: 15M
LONG: OPEN
ENTRY: 20000
TP1: 20500
TP2: 21000
TP3: 21500
SL: 19000
Leverage: 0
===========================================================================
Trade Open Signal SOURCE + Take-Profit/Stop-Loss SOURCE
---------------------------------------------------------------------------
>>> Customize your signal SOURCE, Take-Profit and Stop-Loss SOURCE as desired (NOTE: These are pre-configured and should be usable on majority of markets, however feel free to play around with these settings as there is nearly an infinite amount of setups out there!
===========================================================================
Adding Alerts in TradngView
---------------------------------------------------------------------------
-Right-click anywhere on the TradingView chart
-Click on Add alert
-Condition: Select this indicator by it’s name
-Alert name: Whatever you want
-Hit “Create”
-Note: If you change ANY Settings within the indicator – you must DELETE the current alert and create a new one per steps above, otherwise it will continue triggering alerts per old Settings!
===========================================================================
If you have any questions or issues with the indicator, please message me directly via TradingView.
---------------------------------------------------------------------------
Good Luck! (NOTE: Trading is very risky, so please trade responsibly!)

X48 - Strategy | BreakOut & Consecutive (11in1) + Alert | V.1.2================== Read This First Before Use This Strategy ==============
*********** Please be aware that this strategy is not a guarantee of success and may lead to losses.
*********** Trading involves risk and you should always do your own research before making any decisions.
================= Thanks Source Script and Explain This Strategy ===================
► Description
Write a detailed and meaningful description that allows users to understand how your script is original, what it does, how it does it and how to use it
This Strategy Are Combine Strategy and Indicators Alert Function For Systematic Trading User.
Strategy List, Thanks For Original Source Script , From Tradingview Build-in Script From fmzquant Github
// Channel BreakOut Strategy : Calculate BreakOut Zone For Buy and Sell.
// Consecutive Bars UP/Down Strategy : The consecutive bars up/down strategy is a trading strategy used to identify potential buy and sell signals in the stock market. This strategy involves looking for a series of bars (or candles) that are either all increasing or all decreasing in price. If the bars are all increasing, it can be a signal to buy, and if the bars are all decreasing, it can be a signal to sell. This strategy can be used on any timeframe, from a daily chart to an intraday chart.
// 15m Range Length SD : Range Of High and Low Candle Price and Lookback For Calculate Buy and Sell.
Indicators Are Simple Source Script (Almost I'm Chating With CHAT-GPT and Convert pinescript V4 to V5 again for complete almost script and combine after)
// SwingHigh and SwingLow Plot For SL (StopLoss by Last Swing).
// Engulfing and 3 Candle Engulfing Plot.
// Stochastic RSI for Plot and Fill Background Paint and Plot TEXT For BULL and BEAR TREND.
// MA TYPE MODE are plot 2 line of MA Type (EMA, SMA, HMA, WMA, VWMA) for Crossover and Crossunder.
// Donchian Fans MODE are Plot Dot Line With Triangle Degree Bull Trend is Green Plot and Bear Trend is Red Plot.
// Ichimoku Cloud Are Plot Cloud A-B For Bull and Bear Trend.
// RSI OB and OS for TEXT PLOT 'OB' , 'OS' you will know after OB and OS, you can combo with other indicators that's make you know what's the similar trend look like?
// MACD for Plot Diamond when MACD > 0 and MACD < 0, you can combo with other indicators that's make you know what's the similar trend look like?
Alert Can Alert Sent When Buy and Sell or TP and SL, you can adjust text to alert sent by your self or use default setting.
========== Let'e Me Explain How To Use This Strategy =============
========== Properties Setting ==========
// Capital : Default : 1,000 USDT For Alot Of People Are Beginner Investor = It's Capital Your Cash For Investment
// Ordersize : Default Are Setting 5% / Order We Call Compounded
========== INPUT Setting ==========
// First Part Use Must Choose Checkbox For Use of Strategy and Choose TP/SL by Swing or % (can choose both)
// In Detail Of Setting Are Not Too Much, Please Read The Header Of Setting Before Change The Value
// For The Indicator In List You Want To Add Just Check ✅ From MODE Setting, It's Show On Your Chart
// You Can Custom TP/SL % You Want
========== ##### No trading strategy is guaranteed to be 100% successful. ###### =========
For Example In My Systematic Trading
Select 1/3 Strategy Setting TP/SL % Match With Timeframe TP Long Are Not Set It's Can 161.8 - 423.6% but Short Position Are Not Than 100% Just Fine From Your Aset
Choose Indicators For Make Sure Trend and Strategy are the same way like Strategy are Long Position but MACD and Sto background is bear. that's mean this time not open position.
Donchian Fans is Simple Support and Ressistant If You Don't Know How To Plot That's, This indicator plot a simple for you ><.
Make Sure With Engulfing and 3 Candle Engulfing If You Don't Know, What's The Engulfing, This Indicator are plot for you too ><.
For a Big Trend You can use Ichimoku Cloud For Check Trend, Candle Upper Than Cloud or Lower Than Cloud for Bull and Bear Trend.

[B_1] 15min Future Based on Pullback Condition
GENERAL INTRODUCTION:
This scripts is a trend catcher strategy, looking for entry points based on pullback condition.
HOW IT WORKS:
Entry Long: when price close above 15m Supertrend and an EMA line trend, MACD (12,26,9) below MACD signal (12,26,9), RSI(14) >50 & <80 and SAR is positive.
Exit Long: when price hit TPs or touch Stoploss.
Entry Short: when price close below 15m Supertrend and an EMA line trend, MACD (12,26,9) above MACD signal (12,26,9), RSI(14) <50 & >25 and SAR is negative.
Exit Short: when price hit TPs or touch Stoploss.
HOW TO USE IT:
1. Setup comment Long/Short: this setting used for auto trading. You can fill text to alert then in alert box of Tradingview, using {{strategy.order.comment}}.
2. Setup Entry
+ EMA Length: the EMA period to filter the trend (default is 30).
+ Buy/Sell ETH follow BTC: open long/short ETHUSDTPERP when BTCUSDT touch and reject SuperTrend 1H/2H/4H.
+ Long/Short again: Allow re-entry when price hit all TP or SL.
3. Setup Exit
+ Multi profit: Take profit levels are set according to the fibonacci levels.
+ Auto find TP: If having resistants in higher timeframe near TP1, TP1 will auto set at that resistant.
+ Stoploss: you have two options: Stoploss based on percentage or ATR.
+ When price hit TP1, you have two options: only move Stoploss to entry or active trailing.
4. Custom tools
+ SuperTrend MTF: they used for take multiprofit (you can show or hide them).
+ Table result.
BACKTEST:
Currently, the strategy is optimized for: BINANCE:ETHUSDTPERP . However it can also run on some other coins like: BINANCE:RUNEUSDTPERP , BINANCE:FILUSDTPERP , ...
Parameters for BINANCE:ETHUSDTPERP:
+ 01/01/2022 to present.
+ Order size starting: 01 contract.
+ commission fee: 0.02%
+ No leverage.
=> 475 trades, ratio profit: loss is 5800: 400.
If you want access to this scripts, please inbox to me, you are always welcome.
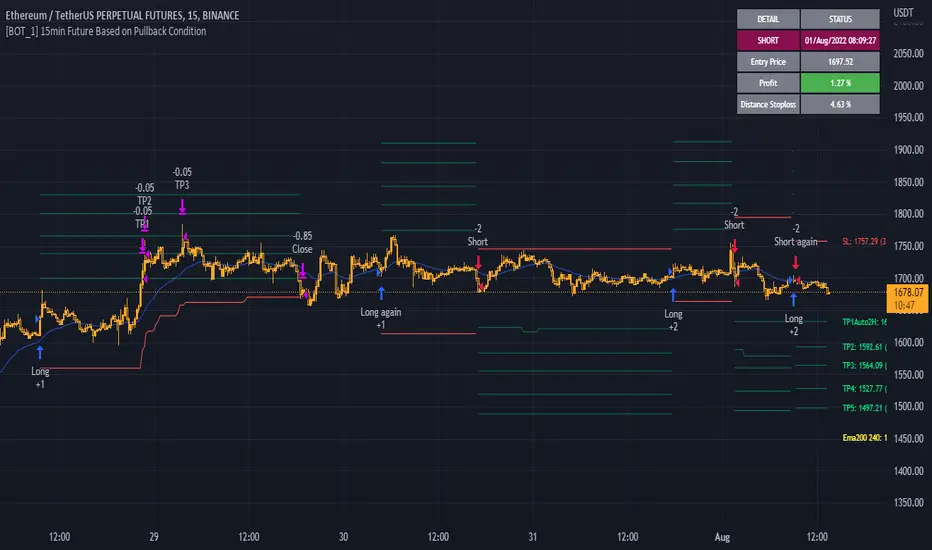
The Ultimate Backtest - Fontiramisu█ OVERVIEW
The Ultimate Backtest allows you to create an infinite number of trading strategies and backtest them easily and quickly.
You can leverage the trading setup you created with the tradingview's real-time alert system.
The tool is constantly being improved to accommodate more in-house indicators in order to imagine more trading strategies.
█ HOW IT WORKS.
The tool is divided into 3 main parts:
1. The indicators:
These are the indicators that you will be able to set up to create your setups.
Example: rsi, exponential moving average, home made resistance/support indicator etc.
We are working to add more and more in-house indicators to multiply the trading strategies.
2. The entry/exit strategy:
The entry/exit trades management is a central point of the strategy.
Here we propose several ways to take profits and in-house optimizations to enter a position.
3. The setup: the combination of indicators
Here it is up to you to create your own recipe.
You combine the different indicators set up above to make a real strategy.
Example: RSI Divergence + Location on a support.
Let's look at this in more detail.
Below is a description of all sections
█ 1. THE INDICATORS
TREND: MA (moving average) -->
Set up a moving average from multiple methods (sma, ema, smma...) of the type and length you want.
> A long is taken if the price is above the MA.
> A short is taken if the price comes below the MA.
You can set up a smoothing MA from the existing moving average and use it in the same way.
ENVELOPE: SUPER TREND -->
The supertrend is a trend following indicator. It clearly describes the distinction between downtrends and uptrends with a red or green direction. It is calculated according to the ATR and a factor.
> A long is taken when the direction is green and the price touches the supertrend support line.
> A short is taken when the direction is red and the price touches the supertrend resistance line.
ENVELOPE: BOLLINGER BAND -->
Bollinger bands are used to evaluate the volatility and probable evolution of prices, here we exploit the envelope
> A long is taken if the price crosses the lower band.
> A short is taken if the price crosses the upper band.
CLOUD: ICHIMOKU -->
The Ichimoku cloud aims to identify the direction and reversal points of dominant market trends. It displays support and resistance levels.
> A long is taken when the price enters the green ichimoku cloud.
> A short is taken when the price enters the red ichimoku cloud.
MOMENTUM: MACD ZERO LAG / MACD / RSI -->
RSI (Relative Strength Index) reflects the relative strength of upward movements, compared to downward movements.
MACD (Moving Average Convergence Divergence) is a momentum indicator that follows the trend and shows the correlation between two moving averages of the asset price.
MACD ZERO LAG is calculated in the same way except that the exponential moving averages that make up the calculation do not lag.
> A long is taken on a potential bullish divergence.
> A short is taken on a potential bearish divergence.
For now, with these indicators, we only take a trade based on divergences but we will add overbuy/oversell etc.
MOMENTUM: MA SLOPE -->
This house indicator allows you to use the slope of a moving average as a measure of momentum.
Define the length of the moving average whose slope we will take.
We then take a fast ma of the slope then a slow ma (You define the lengths with the parameters)
The tool foresees a subtraction between the slow and fast ma to have another interpretation of the slope.
This indicator is available and can be viewed freely on my tradingview profile.
> A long is taken when there is a potential bullish divergence on the fast/slow MA or the difference.
> A short is taken when there is a potential bear divergence on the fast/slow MA or the difference.
RESISTANCE: R/S FONTIRAMISU -->
An in-house indicator that shows resistances and supports according to the chosen parameters.
Indicator available and can be viewed freely on my tradingview profile.
> A long is taken when the price arrives on a support.
> A short is taken when the price arrives on a resistance.
-----
MOMENTUM DIVERGENCE -->
Section used to set the divergence detection.
The first field allows you to select which momentum you want to calculate the divergence on.
PIVOT DETECTION -->
Used to calculate top and dip on the chart, it is used with divergences/resistances/enter-exit optimizations....
Default parameters are: Deviation: 2.5, Depth: 10.
█ 2. STRATEGY FOR ENTERING/EXITING TRADES.
STRATEGY: TP/SL -->
Enter/Exit Trade Mode" field: The first field allows you to choose between two modes:
1. TP/SL Mode:
This mode allows you to take entries with take profits that you define afterwards with the TP1 and TP2 parameters .
> The stop loss is calculated automatically by taking the last dip if it is a long and the last top if it is a short.
> You can add a "Stop Loss % Offset" which will increase the size of the stop loss by the % value you set.
> If you activate TP2, the profit taking is split between TP1 and TP2, you can select the percentage of profit taking split between TP1 and TP2 via the "Percent Exit Profit TP1" field.
> The "TPX Multiplier" fields allow you to define the desired Risk Reward, if = 1 then RR = 1/1.
> A Trailing stop option is available, if active then the profit take will be split between TP1 and Trailing stop.
For the moment you can choose between the two MA's set up above to serve as trailing stop:
> In long, if the price goes below the MA then you take the profit (or the loss)
> In short, if the price goes above the MA then you take the profit (or the loss)
2. ONLY BUY/SELL:
Here the take profits are not taken into account, we only have an alternation between the long and the shorts.
The trailing stop applies to this mode and can be interesting depending on the use.
STRATEGY: SETUP OPTIMIZER (FP) -->
Here we have 3 home made optimization tools to take more relevant trades.
1. FAVORABLE ENTRY FROM PIVOT.
Here the tool will favor entries with interesting locations depending on dips and tops before.
A red cross with "FP" will appear on the chart each time a trade does not meet this condition.
2.STOP LOSS MAX (SL).
Will only take trades where the stop loss is maximum at X%.
A red cross with "%SL" will appear on the chart each time a trade does not meet this condition.
3. MOVE ALREADY TRADED.
Will not take several trades in the same move.
This can avoid cascading losing trades on some setups.
A red cross with "MT" will appear on the chart each time a trade does not meet this condition.
█ 3. THE SETUP: THE COMBINATION OF INDICATORS
Here, let your creativity speak.
You are free to assemble the indicators in the following way:
The conditions defined inside a group (group1/group2/group3) are combined to each other via an OR operator .
Example, if "cond01 = Momentum DIv" and "cond02 = Res/Sup Location", then trades will be triggered if one of the two conditions is met.
The conditions defined between several groups are multiplied via the AND operator .
Example, if "cond01 = Momentum DIv" and "cond12 = Res/Sup Location", then trades are taken if both conditions are met at the same time.
ALL CONDITIONS:
> NONE
No conditions selected.
> Momentum Div
Triggers when a potential divergence occurs on the selected momentum (in the divergence section).
> Momentum Div UT Sup
Triggers when a potential divergence occurs on the selected momentum (in the divergence section) in the upper timeframe.
The upper timeframe of the momentum is calculated directly in the code by multiplying the set parameters by 4 (fastlenght/slowlenght...).
> Multi MA
It is set in the "Trend: MA" section and is triggered by the conditions mentioned in the "INDICATORS" section.
> Smooting MA
Is set in the "Trend: MA" section and is triggered by the conditions mentioned in the "INDICATORS" section.
> Super Trend Env
Is set in the "ENVELOPE: SUPER TREND" section and is triggered by the conditions mentioned in the "INDICATORS" section.
> BB Env
It is set in the "ENVELOPE: BOLLINGER BAND" section and is triggered by the conditions mentioned in the "INDICATORS" section.
> Ichimoku Cloud
Is set in the "CLOUD: ICHIMOKU" section and is triggered by the conditions mentioned in the "INDICATORS" section.
> Res/Sup Location
Is set in the "RESISTANCE: R/S" section and is triggered by the conditions mentioned in the "INDICATORS" section.

The Impossible TraderTHE IMPOSSIBLE TRADER
A simple, but effective High Freq Strategy script based on MACD or RSI trend, with extra customizable Alert Messages for Bots.
WHAT IT DOES
This script (works best at lower TimeFrames) just follow the trend of MACD or RSI on your asset.
Why it should work? Because in an upper trend, there are more chance of green candles than reds. And in dump trend there are more chance of red candles than greens.
While trend is positive, it will try to open Long orders as fast as possible at market price.
While trend is negative, it will try to open Short orders as fast as possible at market price.
HOW TO SETUP YOUR PREFERENCES
Capital : Insert a % of Margin you want to use for your positions (usually 30% is quite good)
Leverage : Choose leverage based on your plans
Trail Tick @ : This value (in Tick) tell the script "when" the "Trail Stop" order must be activated (from the Entry price)
Offset Tick @ : This is the price (in Tick) from the Trail Stop Price activated. Basically it is a Stop Loss that follow the price at a fixed distance.
SL Tick @ : Set a Stop Loss at amount Tick distance from the Entry Price. (Let's call it a Safety Stop Loss for bad decisions...)
TP Tick @ : Set a Take Profit at amount Tick distance from the Entry Price. Sometimes is better to exit in full Gain than keep positions.
Strategy : You can choose a Only Long, Only Short or Long+Short sametime strategy.
with MACD or RSI : You can try the strategy applied on MACD or applied on customizable RSI EMA
EMA : If you choosed RSI EMA, you can set any value for your testing (usually 80-120 works very nice)
Exit order after bars : Some Exchanges / Brokers apply fixed cost, and a strategy too fast could not be productive. This set will let you to delay the Exit Order on already Opened positions.
Keep Stop Loss active : If you are planning a delay for Exit Orders, sometime could be useful to keep activated Stop Loss.
Strategy Preset : Some preset I've found interesting, with good results.
BackTest Days : If there are too many results and script doesn't work, you can choose a closer range to show results.
EXTRA FEATURES
On Screen Display : OSD will show you some realtime stats about your strategy, like Asset Tick, Trading Period Range, Drawdown, Gains and not closed trade.
Alert Message : You can enter custom Long Entry/Exit and Short Entry/Exit message for your Bots (like AutoView, WunderBit, etc...). When alert is triggered, you can send custom message with {{strategy.order.comment}} in the text field
AutoView Alert Message : If you are user of AutoView, you can generate your calls. Those are tested only on Oanda with index like Sp500, US100, Us30.
TIPS ON USE
Some asset on TradingView require an higher initial capital. Go to this Script Settings -> Properties and rise Initial Capital.
Be aware of commissions and spread when evalutating a strategy. Go to this Script Settings -> Properties and set Commission and Slippage
Trail Stop and Ticks could be difficult to understand, but very profitable. Please take your time and study how it works.
Consider Tick like the minimum movement your asset can do. Ticks occurs "intra-bar", so some of your positions could be closed almost instantly.
Consider Trail Stop like a Stop Loss that keep always the same distance from your positions, but never came back . If you are in gain, say of 10 Ticks, and your Trail have 5 Ticks, this means for sure a close at minimum 5 Ticks from Entry Price.
On Screen Display will show you Ticks for your asset. This will help you on strategy settings, because not all asset responds on the same way.
ONLY LONG EXAMPLE
ONLY SHORT EXAMPLE

15min ETH Binance Future Full for auto tradingThe strategy is optimized for ETHBUSDPERP or ETHUSDTPERP pairs on Binance Future. With other altcoins, you need change set up of indicators.
This is a swing strategy to follow the trend on the 15m frame, use the pullback condition in the smaller timeframe to enter the trade.
Entry long: price close above ema10 and ema30, macd(12,26,9) (tf1m) < macd(12,26,9) (tf1m) and rsi < 80 (not overbought) and parabol sar is below price
Exit long: price hit TP1, TP2, ... or touch stoploss or have entry short signal
Entry short: price close below ema10 and ema30, macd(12,26,9) (tf1m) > macd(12,26,9) (tf1m) and rsi > 20 (not oversold) and parabol sar is aboce price
Exit short: price hit TP1, TP2, ... or touch stoploss or have entry long signal
In addition, the strategy also has profit risk management feature: move stoploss to entry and take multiprofit, plot resistant in higher timeframe 1D, 4H for activing take profit.
If you find any helpful for your trading and need scripts, please inbox to me.
You are welcom!
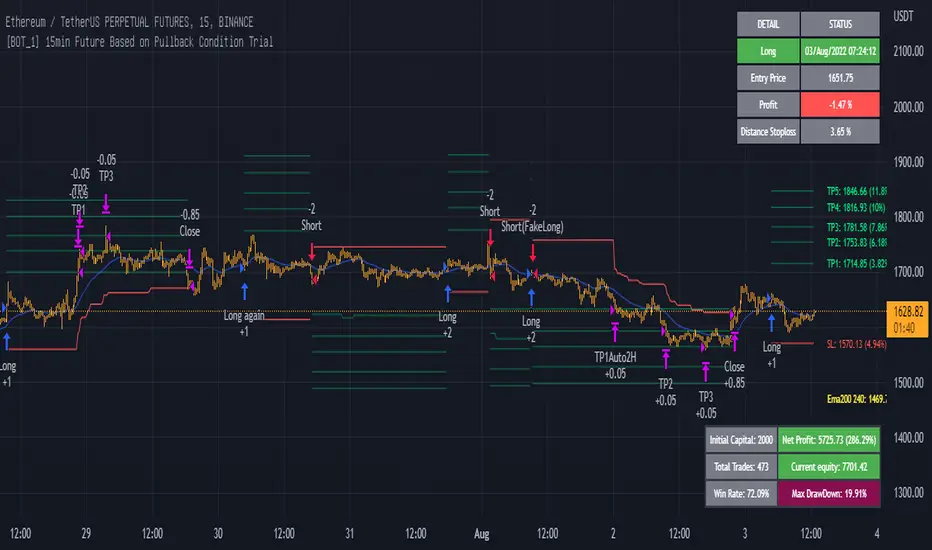
Pumpkin Soup Modified Indicator[Public]This trading strategy is a multi-divergence trading technique using central oscillators such as MACD, SMI, Stochastic, and RSI and MAs (EMA, SMA, WMA) and channels (Bolinger, Caltner, and Doncian).
Only the parts that can be disclosed based on personal sales strategies can be used.
The usage time is at least 1 hour to 1 day. (I recommend the 8 hour stick starting from 3 o'clock)
The MACD ma part is the sensitivity part of the signal, so please use it if necessary.
Background Color: The image of the upward and downward markets is shown in the background.
-Red, green: Downfall, upfall
-Orange, yellow: Short hit section
-Silver, black: Beware of buying and selling.
Middle value (Support Resistance): It represents the sales base of the stock bar where long and short occur, starting from the peak where diversity occurs.
-Red and green lines represent resistance and support, and yellow and blue lines represent short-term sections used for scalping.
MA was used by integrating the MA series in combination.
-The required length of MA is 5 pieces, and I wrote the length I use.
This strategy was used to raise the invitation-only indicator as a strategic indicator before raising it.
(There's no alarm because it's a strategic indicator.)
------------------------------------------------------------------------------------
이 매매 전략은 MACD, SMI, Stochastic, RSI 등 센터드 오실레이터와 MAs(EMA, SMA, WMA)와 채널(볼린저, 캘트너, 돈치안)을 이용한 다중 다이버전스 매매기법입니다.
개인적인 매매전략을 근본으로 공개할 수 있는 부분만 사용할 수 있게 올립니다.
사용시간대는 최소 1시간봉에서 1일봉입니다. (3시봉부터 8시간봉을 추천드립니다)
MACD ma 부분은 시그널상 민감도부분으로 필요시 사용하시길 바랍니다.
Backbround Color : 상승장과 하락장에 대한 이미지를 배경으로 나타내었습니다.
빨간색, 초록색 : 하락장, 상승장
주황색, 노랑색 : 단타 구간
실버색, 검은색 : 매매 주의 구간
Middle value(Support Resistance) : 다이버전스가 생기는 봉을 기점으로 롱과 숏이 발생하는 주가봉의 매물대를 나타냅니다.
빨간선과 초록선은 저항과 지지를 나타내며, 노란선과 파란선은 스캘핑용으로 사용되는 단기 구간을 나타냅니다.
MA는 MA계열을 복합적으로 통합하여 사용하였습니다.
필요한 MA의 길이는 5개정도로 제가 사용하는 길이로 작성하였습니다.
본 전략은 인바이트 온니 지표 올리기전 전략 지표로 올리는 용도로 사용되었습니다.
(전략 지표라 알람이 없습니다.)
※ 전략지표 매매 포인트에서 매매 물타기 불타기 적용

Holyscalp v.3 A MACD 15 min trading strategy,
I set two macd trends that must match in trend direction to be traded,
along with that they must follow the moving average trend set in place
the trades trigger with an atr stop loss indicator "atr+" by zedartoftrading to be exact
It automates fully through autoview/oanda broker
the ma breach settings look back however many bars set in place and see if the bars are closing in opposite trend to the moving average
*TIP get another chart with same forex pair and take and change the candle sticks to heikin candles and set chart to 1D and trade only with that trend for the 15min settings, you can disable short trades by setting the threshold limit to 1 and to disable long trades set threshold to -1
Dec 31, 2021
Release Notes: for my use only
an hour ago
Release Notes: It trades based on these parameters I set in place.
1. The long term macd trend and the short term macd trend must match
2. The atr+ can not be more than 3x the previous atr.
3. It must trade with the trend set in place, I have two moving averages to choose from, to disable the second moving average set it to 1.
4. Don't touch the hammer and star fib level leave at zero, need to code that separately
5. the MA breach looks back a certain amount of bars to try and stop trading while its consolidating. I set at 1:0
an hour ago
Release Notes: Just updated the default settings, Remember they are set for optimization for 15mins but the same rules and parameters still apply to longer time frames, just change the moving averages to your liking if you want to move up timeframes.

DIVI Wunder StrategyAs it is known, divergence is a situation we encounter very often on graphs. Various divergencies may occur according to many indicators. MACD divergence, RSI divergence... In the strategy I use only positive divergence. What is positive divergence I will explain on MACD positive divergence A MACD positive divergence is a situation in which the MACD does not reach a new low, despite the fact that the price of the stock reached a new low. This is seen as a bullish trading signal—hence, the term “positive divergence.” So I thought of these divergencies and came up with a new strategy. Combining the divergencies with the VOLPIN strategy I wrote earlier, a great strategy has emerged. When the divergence signals are came from MACD,RSI,CCI,OBV,Chaikin Money Flow, VWmacd and Money Flow Index all these indicators I sent a buy signal until the 40 times completed. ThenI sent to sell signal when the price come to take profit level. In this strategy, you divide your principal into as many parts as you want. For example, let's say that you have 1000 dollars of money and you make purchases by dividing this money into 40 equal parts in the default settings of the indicator. $25 per purchase. After each purchase is made as 25 dollars, you can adjust your profit rate from the profit taking settings. When you look at the results of the strategy, your profit rate will be very high. I usually use this strategy in one hour periods. Of course you change it whatever you want. Also change all settings from panel to get more profit. Have fun :)
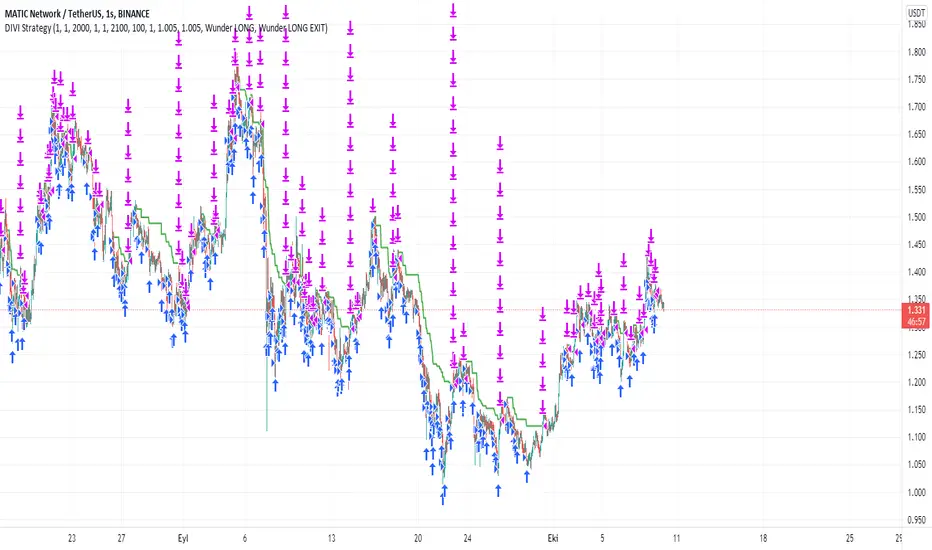
Dankland Playground Moneymaker - V2“version 2” of my playground bot script. Its essentially a powerhouse suite of strategies. Although it is similar to the previous script, it nets different results as sections have been changed. Such as the somewhat reluctant removal of the Chande Momentum... The RSIs have also been updated, this was one of the main changes. RSIS now include a Moving Average cross of RSI to generate signals above and below the given thresholds instead of simply on crossing a threshold. This should give greater functionality overall. Most functions including Moving Averages have been updated to include a wider range of kinds of moving averages. This includes not just the moving average cross, but MACD and RSIs as well. I tried to perform the same upgrade on the %B, Stochastics and SMI, but hit the unpacked code limit of 60,000 lines... So, more “versions” will have to come for future “upgrades”, with the recognition that there will be cases where the old, “downgraded” versions may perform better and that some people (like myself) may continue to use them on some markets until I/we devise superior settings on the new ones for said markets. For instance, instead of replacing my 1 hr BTCUSD bot (where I used the now deleted Chande to pretty pleasing affect...) I made a new one for LINKUSD 10 min so I can have both running for now and work on replacing the BTCUSD later.
How it works basically is this... you have 16 oscillators which can all be used as independently as you wish. They can be split up into different groups or ran all together.
When in separate groups they should not be able to sell eachothers positions without triggering a full stop loss by turning the Independence/Stop All switches on. Every single oscillator has its own entry and exit position sizing which can be stated as either a percent of balance or a flat amount of contracts (or both combined). Each oscillator has a minimum amount of profit you can tell it to sell it, which is calculated from the average cost of your current position, which does include all groups. This works out to help you average out better entry and exit prices, essentially a method of DCAing.
You can set the minimum sale amount, which is to keep it from placing orders below your exchanges minimum dollar trade cost.
All this functionality combined also ensures more accurate back tests by ensuring that the script simply cannot spend money it doesn't see as in the balance, whereas other scripts will use a percentage of equity, and once 100% of your equity is in BTC for instance, it will keep buying more BTC for free and thus spoof up backtest numbers. If you look through the strategies here, many people claim to have amazing scripts and then you look into it and this is happening and skewing their numbers. These people are either very ignorant or what they made or scam artists and trolls in my opinion.
This version also includes On Bar Close switches for each oscillator. When switched on, signals are only allowed to generate on Bar Close. This helps to prevent retriggering from live signals, which when you are running this many oscillators, will become a problem! However, in most cases, you do not need to generate signals intrabar, as backtests will show, ignoring intrabar buys and sells (intrabar stop losses can still be very important though!) won't exactly keep you from high profitability strategies, but rather, allowing elements of chaos from live indicators moving up and down intrabar will, in fact, drift your actual results further and further from the backtest. You want an accurate backtest though. So choose wisely when you turn these off and you will do better.
The included oscillators are as follows:
NO MORE Chande Momentum cross – REMOVED – I was hitting PINE code limits here so I had to make choices and this one simply had to go. Begone!
Moving Average Cross
MACD cross
%B Bollinger cross
Stochastic cross + region filter
Stochastic RSI cross + region filter
SMII cross and region filter
Three RMIs
Know-Sure-Thing line-cross
Coppock Curve line-cross
TRIX line-cross
RSI of MA w/ MA cross
RSI of MA of KST w/ MA cross
RSI of MA of Coppock Curve w/ MA cross
RSI of MA of Trix w/ MA cross
So the idea is that this is essentially multiple strategies combined into one backtestable house. Balance is calculated for all position sizes in order to try to prevent false entries that plague so many scripts (IE, you set pyramiding to 2, each buy $1000, initial balance $1000, and yet it buys two orders off the bat for $2000 total and nets 400% profit because the second was considered free, happens on 90+% of scripts on Tradingview if you aren't very very careful!)
You tune each indicator and position size them so that they work together as well as you can and in doing so you are able to create a single backtest that is capable of running a bot, essentially, between multiple strategies - you can run a slower Moving Average cross, a faster SMI cross or MACD , or Bollinger that grabs big moves only, all the while having MACD trade small bonuses along the way. This way you can weight the Risk to Reward of each against eachother.
I will not try to claim this is something you can open and with no work have the best bot on the planet. This scripts intention is to take a lot of relatively common trading strategies and combine them under on roof with some risk management and the ability to weigh each against eachother.
If you are looking for a super advanced singular algorithm that tries to capture every peak and valley exactly on the dot, this is not for you. If you are looking for a tool with a high level of customizability, with a publisher who intends to update it to the best of his ability in accordance to seeking to make the best product that I personally can make for both myself and the community (because I will be using this myself of course!) that was specifically designed with the intention of performing well in spot markets by averaging low entry costs and high exit costs, this is for you! That is the exact intention here. It can certainly work with margin, but you will have to take extra care in setting your stop losses. I intend to make a version capable of going short which will be included as part of the package. It may take some work to keep all of the risk management working as well for shorts though. There will be more scripts added to the “package” as I hit the limit on this one a few times and have had to keep some ideas out already.
The current backtest shown is hand-optimized by myself for Link /USD 10min market (Binance US – shouldn't need much work to fit to other exchange markets) with multiple stop losses.

inwCoin DCA v2.0 StrategyinwCoin DCA v2.0 is the upgraded version of inwCoin DCA strategy
This strategy will show the "actual" profit/loss on the chart, since it cannot calculate by strategy result.
How to use
--------------
1) Specific "position size per entry" for each of your dca budget.
2) "Buy every N candles" is the trigger for strategy to "buy" the asset, it depend on your timeframe on chart. If you want to let it buy every 7 days, set timeframe to daily and set this value to 7.
3) Entry/Exit filter is the condition for you to continue dca buy or stop when some condition met.
3.1) Restart every N candles = the strategy will sell all of your dca position to realize profit/loss every N candles specific in "Reset at N candles" parameter.
3.2) Price above EMA = IF price above specific "Slow EMA length" value, the strategy will dca buy, else, it will sell to realize profit/loss.
3.3) Price above MA = same as 3.2 but use MA instead.
3.4) Price above WMA = same as 3.2 but use WMA instead.
3.5) MACD Above zero = will buy if MACD > 0 and sell all if MACD < 0. Set MACD value in 3 boxes below.
4) Close position at specific profit % = self explanatory
5) Close remaining position at last bar = self explanatory
6) Date = self explanatory
How to read result
================
Everything in result are self explanatory.
Have fun!

EVWMA VWAP Cross Strategy [QuantNomad]Continue to experiement with VWAP and EVWMA.
It seems that just simple crosses between VWAP and EVWMA can be pretty good signals. VWAP is a bit choppy so you can use VWAP smoothing input to smoth it a bit.
Here are few other strategies based on EVWMA:
EVWMA VWAP MACD Strategy
QuantNomad - EVWMA MACD Strategy
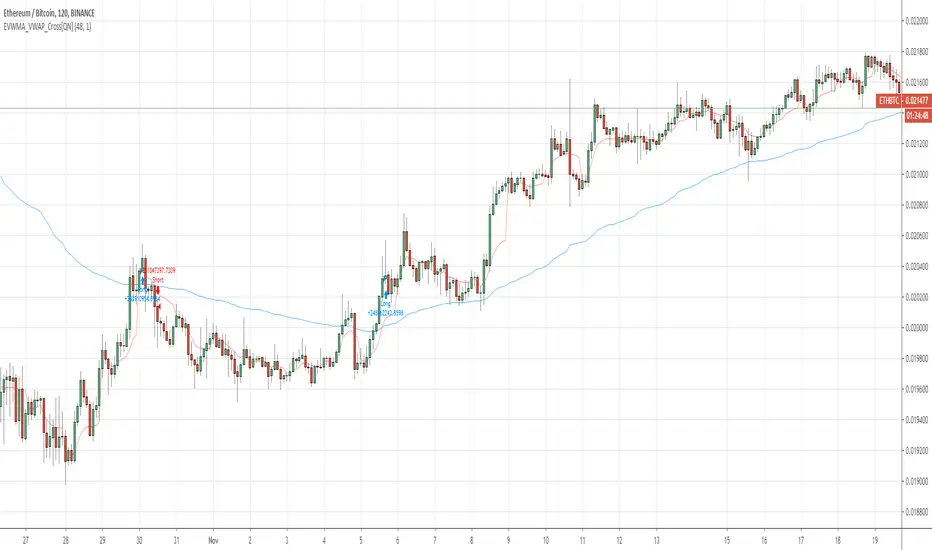
inwCoin DCA Strategy=========================
English
=========================
Just simple strategy idea for DCA bitcoin with different conditions.
Also, this is for education purpose and not the investing advise.
Use it as your own risk.
-----------
Concept
-----------
DCA with options as following ( only important option )
** Please use only in Daily TF **
Bullets Count : Amount of bullets for DCA period. If you want to DCA every months for 2 years ( close all position every 2 years ), your bullets value should be 24.
Buy every N candles : Number of candle you want to let this strategy trigger buy, 1 candle = 1 day so if you want to buy every month, input 30.
Entry / Exit filter : Dropdown to filter trade. If you don't want to DCA in downtrend, make sure to select this option. The simple trend filter is EMA 120 daily
Reset at candle N : One of DCA weak point is...no taking profit target in sight. So this option will force to take profit at N candle. You can try 1 year ( 365 ) or 2 years ( 730 )
==========================
Thai
==========================
Strategy สำหรับ backtest การ DCA ในรูปแบบต่างๆ ครับ โดยมี parameter ดังต่อไปนี้
** ควรใช้สำหรับ Timeframe Daily เท่านั้น **
Price : เป็นข้อมูลที่จะดึงมาคำนวณ ว่าจะเอาข้อมูลไหนจากแท่งเทียนมาคิด ปกติเลือก close แต่ถ้าไม่อยากให้ repaint ก็เลือก open
Bullets Count : จำนวนไม้ ที่เราจะเอามาเข้าซื้อ อย่างเช่น ถ้าจะซื้อเดือนละครั้ง และจะปิดยอดทุกๆ ปี ก็ให้ใส่ 12 ลงไป หรือถ้าเราอยากจะปิดยอดทุกๆ 2 ปี ก็ใส่ 48 เป็นต้น
Buy every N candles : จำนวนแท่งเทียนที่เราอยากจะซื้อ เช่นถ้าซื้อทุกเดือนก็ใส่ 30 ถ้าจะให้ซื้อทุกสัปดาห์ก็ใส่ 7 เป็นต้น
Entry/Exit Filter : ตัวกรองเงื่อนไขการเข้า ค่า default คือไม่กรอง แต่ถ้าจะกรอง ก็มีสองช้อยให้เลือก คือ
* กรองจาก EMA โดยจะใส่ length ของ EMA ที่ช่องด้านล่าง
* กรองจาก MACD cross 0 โดยจะใส่ รายละเอียดของ MACD ที่ช่องด้านล่าง
Reset at candle N : จะทำการขายปิดยอดที่แท่งเทียนที่เท่าไหร่ ถ้าจะปิดยอดทุกๆ ปีก็ใส่ 365 ถ้าจะปิดทุกๆ 2 ปี ก็ใส่ 730 และถ้าแก้ค่านี้ ก็อย่าลืมไปปรับ bullet count ให้สอดคล้องกันด้วย
Slow EMA Length : ตามนั้น ควรใช้ 120 เพราะ BTC ชอบค่านี้ แต่จะปรับเท่าไหร่ก็ได้แล้วแต่
Fast / Slow / MACD length : ค่าที่ใช้คำนวณ MACD ปกติจะเป็น 12,26,9
==========
Optional
==========
Close position at specific profit% : ถ้าติ๊กตรงนี้ มันจะทำการขายออก ถ้ากำไรเราได้ถึงช่องข้างล่าง
Reset at profit% : กรอก % ที่อยากจะให้ระบบขายไม้ DCA ออก ถ้ากำไรถึงเป้านี้
Close remaining position at last bar : จะทำการสรุปยอดและรับรู้กำไร ที่แท่งสุดท้าย จะใช้เพื่อลองดูประสิทธิภาพของ strategy
Exclude profit from capital : ไม่เอากำไร กลับเข้ามารวมในเงินทุนตอนแรก ( ลดการ Drawdown ได้เยอะอยู่ )
ที่เหลือเป็นตั้งช่วงที่จะ backtest ก็ไม่ยากอะไร
===========
วิธีใช้งาน
===========
เอาใส่กราฟ ก็จะเห็นผล backtest เลย แต่ถ้าอยากลองเล่นโน่นนี่นั่น ก็ลองปรับค่าไปเรื่อยๆ ดู
ตัวอย่างการตั้งค่า
============
* อยาก DCA แบบ เก็บกำไร สองปีครั้ง และแบ่งเป็น 24 ไม้ ( ทุน หาร 24 ) และซื้อทุกเดือน
Bullets Count = 24
Buy every N candles = 30
Reset at candle N = 730
* อยาก DCA ย้อนหลัง 5 ปี แบบไม่เก็บกำไรเลย มาเก็บเอาวันสุดท้าย และซื้อทุกเดือน
Bullets Count = 60 ( คือ 12 x 5 )
Buy every N candles = 30
Reset at candle N = 1825 ( คือ 365 x 5 )
From year : 2014
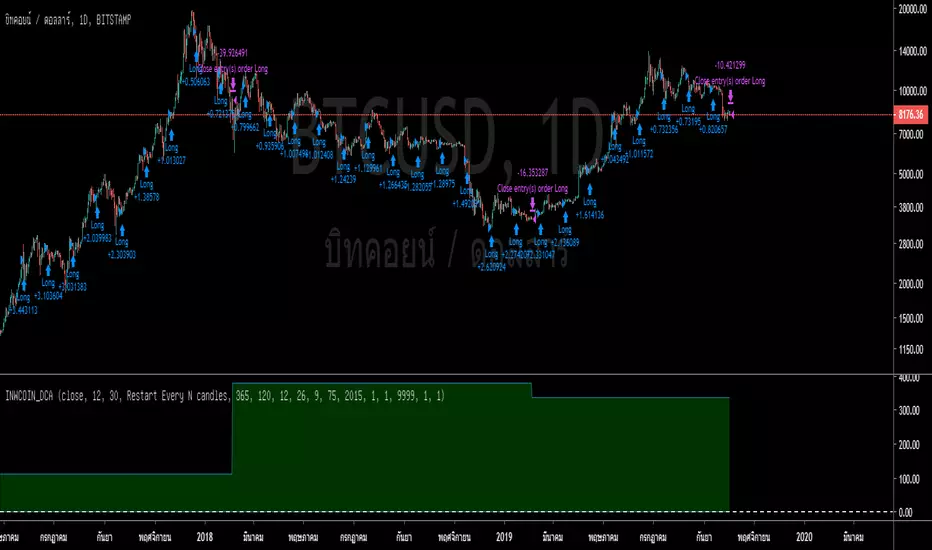
BTC Daily Strategy BFStrategy based on code by @CredibleHulk so thanks for that.
This is a strategy for the Daily Bitcoin chart which uses the MACD, RSI, Stochastic RSI and a moving average.
The conditions for long or short signals depend on the indicators above crossing user-defined thresholds.
Long signal = (Stochastic RSI k value is below Stochastic Sell Threshold) AND EITHER (MACD delta crosses above MACD Threshold OR RSI crosses above RSI Threshold)
Short signal = (MACD delta crosses below 0) AND EITHER (Close Price - an SMA of the ohlc4 values crosses below the DMA threshold OR Stochastic RSI k value is above Stochastic Sell Threshold)
INSTRUCTIONS
Green background = go long
Red background = go short
You can adjust stop loss values for long or short signals in settings as well as all parameters for the indicators.

loscuentosdelacryptoThe stories of the crypto indicate possible areas to enter or exit with crossings of macd
Recommendations of this indicator
Use and compare with macd crossovers and the distance direction
Use zoom in the candle chart to see all the signs
Do not operate in lateral
Use temporality 15 minutes.
To request access I like it and send your request I will deliver it without cost
Español:
Los cuentos de la crypto indica posibles zonas en donde entrar o salir cumpliendo con cruces de macd
Recomendaciones de este indicador
Usar y comparar con cruces de macd y la direccion de la distancia
Usar zoom en el grafico de velas para poder ver bien todas las señales
No operar en lateral
Usar temporalidad 15 minutos.
Para pedir acceso dele me gusta y enviar su solicitud se lo entregare sin costo

PT2 Strategies Run Test Beta這是進行Profit Trailer 2環境的回測測試
Backtesting for PT2 (profit trailer 2) strategy Bate Version
目前支援策略
NORMAL BUY Strategy
HIGHBB,LOWBB,BBWIDTH,LOSE,EMAGAIN,EMASPREAD,EMACROSS,SMAGAIN,SMASPREAD,SMACROSS,MACD,RSI,STOCH,STOCHRSI,OVB
NORMAL SELL Strategy
GAIN,HIGHBB,BBWIDTH,EMAGAIN,EMASPREAD,EMACROSS,SMAGAIN,SMASPREAD,SMACROSS,MACD,RSI,STOCH,STOCHRSI,OVB
DCA BUY Strategy
ANDERSON,HIGHBB,LOWBB,BBWIDTH,LOSE,EMAGAIN,EMASPREAD,EMACROSS,SMAGAIN,SMASPREAD,SMACROSS,MACD,RSI,STOCH,STOCHRSI,OVB
DCA SELL Strategy
GAIN,HIGHBB,BBWIDTH,EMAGAIN,EMASPREAD,EMACROSS,SMAGAIN,SMASPREAD,SMACROSS,MACD,RSI,STOCH,STOCHRSI,OVB
感謝提供香油錢
ETH:
0x1997685628d149d1b679d20a21dcd06589c956f8
BTC:
12vuunzF3P9hcmEgNWgh1iF5SXXTpQVPaA
LTC:
LbVtnbRuGUw6YuE6UkoWshSQruWStUCMg8
