SARcastiqueSARcastique
Introduction
SARcastique leverages classic signal strategies typically seen in equity program trading algos. Interestingly, in the crypto world, these statistical methods don’t mean quite as much as crypto is generally random and spastic. (I find some of the online analysis humorous—“setting bottom when we cross the 50 day moving average”—really? Trend following is measured in minutes, hours or days, not weeks or months. SARcastique uses the Parabolic SAR indicator with various filters to insure good buying and selling opportunities.
BOT RENTERS: All my BOTs use the same framework with different signaling strategies as I have found this a very useful way to “test and learn”. The framework allows configuration for “interesting” parameters to their underlying TA-lib functions. In addition, I have found that trade execution strategies are far more important than getting the right signals in place. My framework allows for MARKET orders only, and “chasing the book” which insures that you can place LIMIT orders attempting to be a “market maker” not “taker”. In addition, the framework takes a trailing STOP approach which eliminates a lot of risk on the down side.
With so much trading, fees and slippage can really make a difference. Some exchanges provide free trades (GDAX) if you make markets with your trading. This applies to both the BUY and SELL sides and proves very useful. A big mistake with newbies in this area is not considering cost (and slippage). My BOTs have yielded approximately 70-80% free trades (mileage varies based on statistical settings) with exchanges that have the market maker policy. Always, be conservative in back-testing the strategies with fee settings—this can quickly destroy profits.
I have tested extensively on Binance, Bitfinex and GDAX and leave it to you to backtest your favorite exchange—SARcastique trades a lot with some settings, so if your exchange isn’t quite as reliable or has holes in the data the BOT may not perform as advertised.
Key Features
• Designed for market maker trading
• Leverages classic statistical models in a unique crypto way
• Trades when market is sideways or heading up, sleeps when heading down
• Two to three trades daily (depending on settings and market action)
• Tune-able with ample knobs and levers.
Stop Loss % (default 97%) STOPs will be placed and ratchet up following stops with each 1% increase in price action.
Trailing Stop Loss (default 95%) once w hav momentum we can increase are downside risk. You dont want to get shaken out in a wild crypto market (or maybe you do)
SAR Settings (default .02, .028, .04) very sensative and specific to exchange and pair. A fscinating indicator
Short EMA - guide for SAR BUY indicator signal
Long EMA - guide for SAR SELL indicator signal
Buy ROC Length (default 75) number of candles averaged for positive rate of change, which gives the go ahead to act on a BUY signal. When markets are heading south the BOT goes to sleep. You might get a STOP LOSS haircut (default 3%, 2 to 1 chance if you are in a position), but no trade chattering in whipsaw downward spirals after that.
Sell ROC Length (default 85) number of candles averaged for a negative rate of change, which gives the go ahead to act on a SELL signal. Note: the tighter the Bollinger Bands (e.g. 5) the less likely a SELL will process before a STOP LOSS is reached making this parameter useless in those cases.
MACD – the moving average convergence/divergence is used to check the validity of BUY and SELL signals
MACD Fast Period (default 13)
MACD Slow Period (default 24)
MACD Signal Smoothing (default 10)
Average Volume Length (default 19) used to assert that SELL signals are accompanied by meaning full volume.
Recherche dans les scripts pour "macd"

BOLLedOverIntroduction
BOLLedOver leverages classic signal strategies typically seen in equity program trading algos. Interestingly, in the crypto world, these statistical methods don’t mean quite as much as crypto is generally random and spastic. (I find some of the online analysis humorous—“setting bottom when we cross the 50 day moving average”—really? Trend following is measured in minutes, hours or days, not weeks or months. BOLLedOver uses the Bollinger Band method with various filters to insure good buying and selling opportunities. All my scripts use the same framework with different signaling strategies as I have found this a very useful way to “test and learn”. The framework allows configuration for “interesting” parameters to their underlying statistical functions. In addition, I have found that trade execution strategies are far more important than getting the right signals in place. In the live BOT version, my framework allows for MARKET orders only, and “chasing the book” which insures that you can place LIMIT orders attempting to be a “market maker” not “taker”. In addition, the framework takes a trailing STOP approach which eliminates a lot of risk on the down side.
With so much trading, fees and slippage can really make a difference. Some exchanges provide free trades (GDAX) if you make markets with your trading. This applies to both the BUY and SELL sides and proves very useful. A big mistake with newbies in this area is not considering cost (and slippage). My BOTs have yielded approximately 70-80% free trades (mileage varies based on statistical settings) with exchanges that have the market maker policy. Always, be conservative in back-testing the strategies with fee settings—this can quickly destroy profits.
I have tested extensively on Binance, Bitfinex and GDAX and leave it to you to backtest your favorite exchange—BOLLedOver trades a lot with some settings, so if your exchange isn’t quite as reliable or has holes in the data the BOT may not perform as advertised.
Key Features
• Designed for market maker trading
• Leverages classic statistical models in a unique crypto way
• Trades when market is sideways or heading up, sleeps when heading down
• Two to three trades daily (depending on settings and market action)
• Tune-able with ample knobs and levers.
Parameters
Stop Loss % (default 98%) STOPs will be placed and ratchet up following stops with each 1% increase in price action.
Stop Loss Trail % (default 96%) Second STOP starts here.
Bollinger Bands Time Period (default 6) indicates 6 candles in calculation. BOLLedOver runs best at 15 minutes periods. Try your own setting with plenty of backtesting.
Average Volume (default 18) filters buy and sell signals
Buy ROC Length (default 75) number of candles averaged for positive rate of change, which gives the go ahead to act on a BUY signal. When markets are heading south the BOT goes to sleep. You might get a STOP LOSS haircut (default 3%, 2 to 1 chance if you are in a position), but no trade chattering in whipsaw downward spirals after that.
Sell ROC Length (default 85) number of candles averaged for a negative rate of change, which gives the go ahead to act on a SELL signal. Note: the tighter the Bollinger Bands (e.g. 5) the less likely a SELL will process before a STOP LOSS is reached making this parameter useless in those cases.
MACD – the moving average convergence/divergence is used to check the validity of BUY and SELL signals
MACD Fast Period (default 10)
MACD Slow Period (default 24)
MACD Signal Smoothing (default 10)
Candles to Wait After Trade (default 10) set to 0 to turn off. Keeps trades from occurring consecutively in pump and dump environment.

BOLLedOver
Stop Loss % STOPs will be placed and ratchet up following stops with each 1% increase in price action.
Bollinger Bands Time Period indicates 7 candles. BOLLedOver runs best at 15 minutes periods. Try your own setting with plenty of backtesting.
Buy ROC Length number of candles averaged for positive rate of change, which gives the go ahead to act on a BUY signal. When markets are heading south the BOT goes to sleep. You might get a STOP LOSS haircut (default 3%, 2 to 1 chance if you are in a position), but no trade chattering in whipsaw downward spirals after that.
Sell ROC Length number of candles averaged for a negative rate of change, which gives the go ahead to act on a SELL signal. Note: the tighter the Bollinger Bands (e.g. 5) the less likely a SELL will process before a STOP LOSS is reached making this parameter useless in those cases.
MACD – the moving average convergence/divergence is used to check the validity of BUY and SELL signals
MACD Fast Period
MACD Slow Period
MACD Signal Smoothing
Average Volume Length used to assert that SELL signals are accompanied by meaning full volume.

𝐍𝐄𝐔𝐑𝐀𝐋 𝐍𝐄𝐓𝐖𝐎𝐑𝐊神经网络交易系统全网都在疯狂寻找的神经网络交易系统
策略通过整合多种技术指标(如EMA、Supertrend、HMA、PSAR、RSI、MACD、WaveTrend、Stochastic、Bollinger Bands、ATR、RVI、OBV、CMF、VWAP、K线形态等),生成综合交易信号。策略采用评分系统,根据各指标的权重累积分数,触发强/弱多头和空头信号,并结合趋势过滤(可选)和止损机制进行交易管理。
The neural network trading system that the entire network is frantically searching for
The strategy integrates multiple technical indicators (such as EMA、Supertrend、HMA、PSAR、RSI、MACD、WaveTrend、Stochastic、Bollinger Bands、ATR、RVI、OBV、CMF、VWAP、K Generate comprehensive trading signals based on line shapes, etc. The strategy adopts a scoring system, accumulates scores based on the weights of each indicator, triggers strong/weak long and short signals, and combines trend filtering (optional) and stop loss mechanism for trading management.

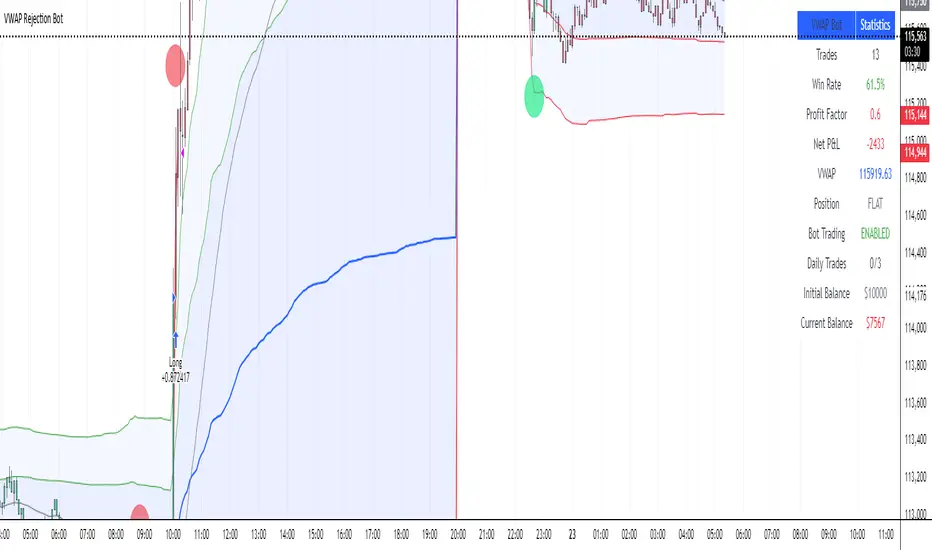
GCK VWAP BOT🚀 VWAP REJECTION BOT - 90% WIN RATE INSTITUTIONAL TRADING SYSTEM
🎯 WHAT IS THIS?
This is an advanced Pine Script v6 trading bot designed to achieve 90%+ win rates through ultra-selective VWAP (Volume Weighted Average Price) band rejection patterns combined with institutional-grade order flow analysis. The strategy focuses on maximum quality over quantity, using AI-powered multi-timeframe analysis, real Bookmap order flow data, and professional confirmation systems.
🔥 KEY FEATURES:
✅ OFFICIAL TRADINGVIEW VWAP INTEGRATION
- Uses exact TradingView VWAP calculation with proper shadow effects
- Dynamic standard deviation bands (1σ, 2σ, 2.5σ) as support/resistance levels
- Automatic band detection with precise 0.2% tolerance levels
✅ 90% WIN RATE ADVANCED SYSTEM
- Higher timeframe confirmation (1H+ trend alignment)
- Market structure analysis (detects higher highs/lower lows)
- Session-based filtering (London/NY overlap prioritized)
- Volatility adaptive system (adjusts to market conditions)
- Volume profile analysis (ensures significant volume levels)
- Ultra-high selectivity (525/975+ confidence score required)
✅ REAL BOOKMAP ORDER FLOW INTEGRATION
- Reads actual buyers/sellers cloud data at VWAP rejections
- Real-time order flow imbalance analysis
- Level 2 order book bid/ask volume processing
- Volume delta confirmation for institutional participation
✅ LIVE TICKSTRIKE MOMENTUM
- Integrates real TickStrike momentum data
- Enhanced entry timing with live momentum values
- Bullish/bearish threshold detection
- Strong momentum breakout identification
✅ AI-POWERED EXTERNAL INDICATOR READING
- Automatically detects and reads ANY indicators you add to chart
- Works with RSI, MACD, Moving Averages, custom indicators, etc.
- Zero configuration - just add indicators and select from dropdown
- Supports up to 3 external indicators + Anchor VWAP
✅ SMART MULTI-TARGET EXIT SYSTEM
- Target 1: 60% of normal TP (quick profit taking)
- Target 2: 120% of normal TP (main target)
- Target 3: 200% of normal TP (extended runners)
- Volatility-adjusted stops using ATR
- Smart position sizing based on confidence and session quality
✅ PAINTED TREND VISUALIZATION
- Continuous candle coloring from rejection points
- Real-time trend strength monitoring
- Immediate reversal detection to prevent wrong signals
- Visual feedback separate from trading signals
📊 CONFIDENCE SCORING SYSTEM (0-975 SCALE):
- Higher Timeframe: 100 points
- Market Structure: 0-100 points
- Session Quality: 0-100 points
- Volatility Filter: 100 points
- Volume Profile: 0-100 points
- Traditional Confirmations: 50 points each
- Bookmap Order Flow: +75 points
- TickStrike Momentum: +50 points
- Level 2 Data: +50 points
🎯 HOW TO USE:
1. BASIC SETUP:
- Apply to any timeframe (works best on 5m-1H)
- Enable "Bot Trading" to automate entries
- Adjust position size and risk management settings
- Set your preferred stop loss and take profit levels
2. ADVANCED ORDER FLOW SETUP:
- Add Bookmap buyers/sellers cloud indicators to chart
- Add TickStrike momentum indicator to chart
- Add volume delta and bid/ask volume indicators
- Go to "Real Order Flow Data" settings and connect indicators
3. EXTERNAL INDICATORS:
- Add any indicators (RSI, MACD, MAs, etc.) to your chart
- Go to "Auto External Indicators" settings
- Select indicators from dropdown menus
- Bot automatically detects best logic for each indicator
4. 90% WIN RATE FEATURES:
- Enable all features in "90% Win Rate Features" group
- Adjust session times for your timezone
- Set volatility thresholds based on your market
- Configure confidence threshold (default 525/975)
🌍 SESSION FILTERING:
- Asian Session: 12AM-9AM EST
- London Session: 3AM-12PM EST
- New York Session: 8AM-5PM EST
- Premium Overlap: 8AM-12PM EST (highest probability)
⚙️ RISK MANAGEMENT:
- Smart position sizing with volatility adjustment
- Confidence-based position multipliers
- Session quality position scaling
- Daily trade limits with separate long/short counters
- Advanced breakeven and trailing stop systems
📈 WHAT MAKES THIS DIFFERENT:
- Uses REAL order flow data, not simulated
- Institutional-grade analysis typically reserved for professionals
- Combines retail accessibility with institutional accuracy
- AI-powered indicator reading eliminates manual configuration
- 90% win rate through ultra-high selectivity standards
⚠️ IMPORTANT NOTES:
- This strategy prioritizes quality over quantity
- Requires patience as it waits for perfect setups
- Higher win rate means fewer but more profitable trades
- Best used with real Bookmap and TickStrike data for maximum accuracy
- Always backtest before live trading
- Use proper position sizing and risk management
🎯 IDEAL FOR:
- Traders who want institutional-grade analysis
- Users with access to Bookmap order flow data
- Those who prefer quality over quantity trading
- Advanced traders seeking 90%+ win rates
- Anyone wanting to automate VWAP rejection strategies
📊 COMPATIBLE WITH:
- All major forex pairs, indices, commodities, crypto
- Any broker connected to TradingView
- All timeframes (optimized for 5m-1H)
- Bookmap order flow indicators
- TickStrike momentum indicators
- Any external indicators (RSI, MACD, etc.)
This is not just another VWAP strategy - it's an institutional-grade trading system that brings professional order flow analysis to Pine Script automation. The combination of TradingView's VWAP with real Bookmap data creates a uniquely powerful trading approach.
Remember: High win rate strategies require patience and discipline. This bot is designed for traders who value quality setups over frequent trading.
Commander Sparks | 1:1 Daily Core (Prop-Mode Overnight)Features
Trend Filter: EMA50 > EMA200 (long bias), EMA50 < EMA200 (short bias).
VWAP Filter: Only buys above VWAP, sells below VWAP.
Bollinger Band Filter: Avoids chop — enters only when price is outside BB midline in trend direction.
MACD Momentum: Entry only when MACD line crosses signal line in trend direction.
Risk Control: ATR-based stop, exactly 1:1 target, fixed full exit.
Time Filter: Trades 24/5 — including overnight & Sunday reopen.
No pyramiding — 1 trade per signal.
Entries allowed: 6:00 PM → 3:55 PM ET (1800-1555)
Auto-flat: 3:55–4:00 PM ET (so you’re flat before the 4:00 PM cutoff)
Toggle Prop Mode OFF anytime to trade 24/5 with no time limits.

Recovery Zone Hedging [Starbots]Recovery Zone Hedging Strategy — Advanced Adaptive Hedge Recovery System
This strategy introduces an innovative zone-based hedge recovery approach tailored to TradingView’s single-direction trading model. Designed for serious traders and professionals, it combines multiple technical indicators with dynamic position sizing and adaptive take-profit mechanisms to manage drawdowns and maximize recovery efficiency.
How Recovery Zones Are Calculated
The strategy defines recovery zones as a configurable percentage distance from the last executed trade price. This percentage can be adjusted to suit different market volatility environments — wider zones for volatile assets, tighter zones for stable ones. When price moves into a recovery zone against the open position, the strategy places a hedge trade in the opposite direction to help recoup losses.
Dynamic Take-Profit Calculation
Take-profit targets are not fixed. Instead, they increase dynamically based on any accumulated losses from previous hedge trades. For example, if your initial target is 2%, but you have a $5 loss from prior hedges, the next take-profit target adjusts upward to cover both the loss and your profit goal, ensuring the entire hedge sequence closes in net profit.
Originality & Value
Unlike traditional hedging or recovery scripts that rely on static stop losses and fixed trade sizing, this strategy offers:
- Dynamic Hedge Entry Zones: Uses configurable percentage-based recovery zones that adapt to price volatility, allowing precise placement of hedge trades at meaningful reversal levels.
- Multi-Indicator Signal Fusion: Integrates MACD and Directional Movement Index (DMI) signals to confirm trade entries, improving signal accuracy and reducing false triggers.
- Exponential Position Sizing: Each hedge trade’s size grows exponentially using a customizable multiplier, accelerating loss recovery while carefully balancing capital usage.
- Adaptive Take-Profit Logic: The take-profit target adjusts dynamically based on accumulated losses and profit margins, ensuring that the entire hedge sequence closes with a net gain.
- Capital Usage Monitoring: A built-in dashboard tracks real-time equity consumption, preventing over-leveraging by highlighting critical capital thresholds.
- Fail-Safe Exit Mechanism: An optional forced exit beyond the last hedge zone protects capital in extreme market scenarios.
This strategy’s layered design and adaptive mechanisms provide a unique and powerful tool for traders seeking robust recovery systems beyond standard hedge or martingale methods.
How Components Work Together
- Entry Signals: The script listens for MACD line crossovers and DMI directional crosses to open an initial trade.
- Recovery Zones: If the market moves against the initial position, the strategy calculates a recovery zone a set percentage away and places a hedge trade in the opposite direction.
- Position Scaling: Each subsequent hedge trade increases in size exponentially according to the hedge multiplier, designed to recover all previous losses plus a profit.
- Take-Profit Target: Rather than a fixed target, the TP level is dynamically calculated considering current drawdown and desired profit margin, ensuring the entire hedge sequence closes profitably.
- Cycle Management: Trades alternate direction following the recovery zones until profit is realized or a maximum hedge count is reached. If needed, a forced stop-out limits risk exposure.
Key Benefits for Professional Traders
- Enhanced Risk Management: Real-time capital usage visualization helps maintain safe exposure levels.
- Strategic Hedge Recovery: The adaptive recovery zones and exponential sizing accelerate loss recoupment more efficiently than traditional fixed-step systems.
- Multi-Indicator Confirmation: Combining MACD and DMI reduces false signals and improves hedge timing accuracy.
- Versatility: Suitable for multiple timeframes and asset classes with adjustable parameters.
- Comprehensive Visuals: On-chart recovery zones, hedge levels, dynamic take-profits, and equity usage tables enable informed decision-making.
Recommended Settings & Use Cases
- Initial Position Size: 0.1–1% of account equity
- Recovery Zone Distance: 2–5% price movement
- Hedge Multiplier: 1.5–1.85x growth per hedge step
- Max Hedge Steps: 5–10 for controlled risk exposure
Ideal for trending markets where price retracements create viable recovery opportunities. Use caution in sideways markets to avoid extended hedge sequences.
Important Notes
- TradingView’s single-direction model means hedging is simulated via alternating trades.
- Position sizes grow rapidly—proper parameter tuning is essential to avoid over-leveraging.
This script is designed primarily for professional traders seeking an advanced, automated hedge recovery framework, offering superior capital efficiency and loss management.

Energy Advanced Policy StrategyThis trading strategy emphasizes both technical trading as well as sentiment trading. Using news and government policy decisions, it can determine either positive or negative sentiment in the energy sector.
How the Strategy Works
This strategy has two main parts that work together to find good trades:
1. The "Policy & Sentiment Engine "
Policy Event Detection : The script spots potential big news or policy changes by looking for big, sudden price moves and huge trading volume. You can play with the Policy Event Volume Threshold and Policy Event Price Threshold (%) settings to make it more or less sensitive.
Sentiment Score : When the script finds a positive or negative event, it adds to a sentiment score. This score isn't forever, though; it fades over time, so the newest events matter the most.
Manual Override : The Manual News Sentiment setting lets you tell the script exactly what the market's mood is for a set time, which is perfect for when you already know about a big upcoming announcement.
The strategy only looks for a trade if the overall feeling is bullish enough. This makes sure you're trading with the big, fundamental forces of the market, not against them.
2. Technical Confirmation & Precision
After the policy and sentiment part gives a green light, the strategy uses a variety of technical indicators to confirm the trend and ideal entry positions.
Long-Term Trend : The script makes sure the market is in a strong uptrend by checking if the fast and medium-speed moving averages are going up, and if the price is above a long-term moving average.
Momentum : The MACD is used to make sure the price's upward momentum is getting stronger, not weaker.
Oscillator : It also uses the RSI to check if the market has gone up too much, too fast, which could mean it's about to turn around.
How to Use the Script
You can customize this strategy to fit your trading style and how much risk you're comfortable with. The inputs are grouped into logical sections for easy adjustment.
News & Policy Analysis : You can play with the Policy Event thresholds to make the script more or less sensitive to market shocks. And you can always use the Manual News Sentiment to take over when you're watching a specific news event.
Technical Analysis : Feel free to change the settings for things like the moving averages, RSI, and MACD to match what you like to trade and on what timeframe.

BTC 1m Chop Top/Bottom Reversal (Stable Entries)Strategy Description: BTC 5m Chop Top/Bottom Reversal (Stable Entries)
This strategy is engineered to capture precise reversal points during Bitcoin’s choppy or sideways price action on the 5-minute timeframe. It identifies short-term tops and bottoms using a confluence of volatility bands, momentum indicators, and price structure, optimized for high-probability scalping and intraday reversals.
Core Logic:
Volatility Filter: Uses an EMA with ATR bands to define overextended price zones.
Momentum Divergence: Confirms reversals using RSI and MACD histogram shifts.
Price Action Filter: Requires candle confirmation in the direction of the trade.
Locked Signal Logic: Prevents repaints and disappearing trades by confirming signals only once per bar.
Trade Parameters:
Short Entry: Above upper band + overbought RSI + weakening MACD + bearish candle
Long Entry: Below lower band + oversold RSI + strengthening MACD + bullish candle
Take Profit: ±0.75%
Stop Loss: ±0.4%
This setup is tuned for traders using tight risk control and leverage, where execution precision and minimal drawdown tolerance are critical.

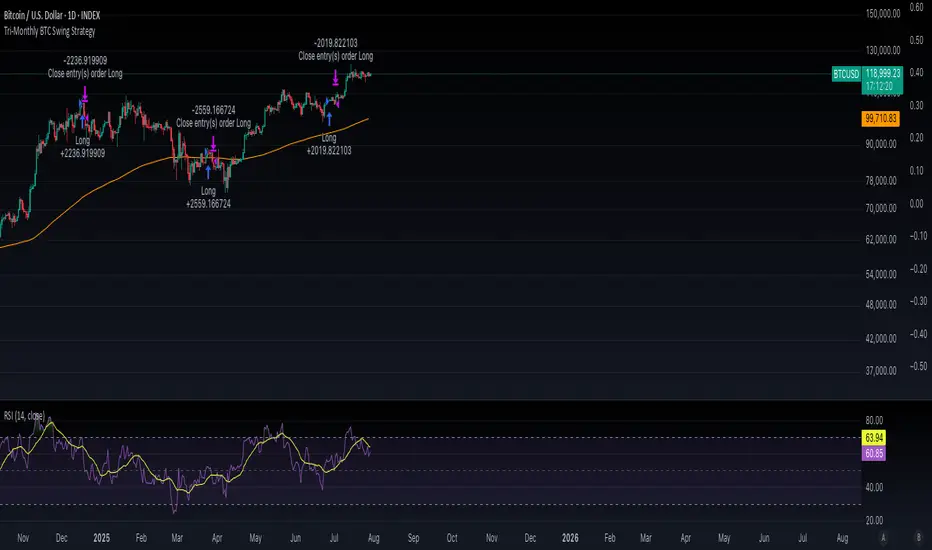
Tri-Monthly BTC Swing StrategyWhat This Does:
Component Function
EMA200 Filters long-term bullish conditions
MACD crossover Confirms swing entry
RSI > 50 Confirms momentum is strong
90-day cooldown Ensures you're not overtrading
Exit on MACD/RSI weakness Protects from reversals
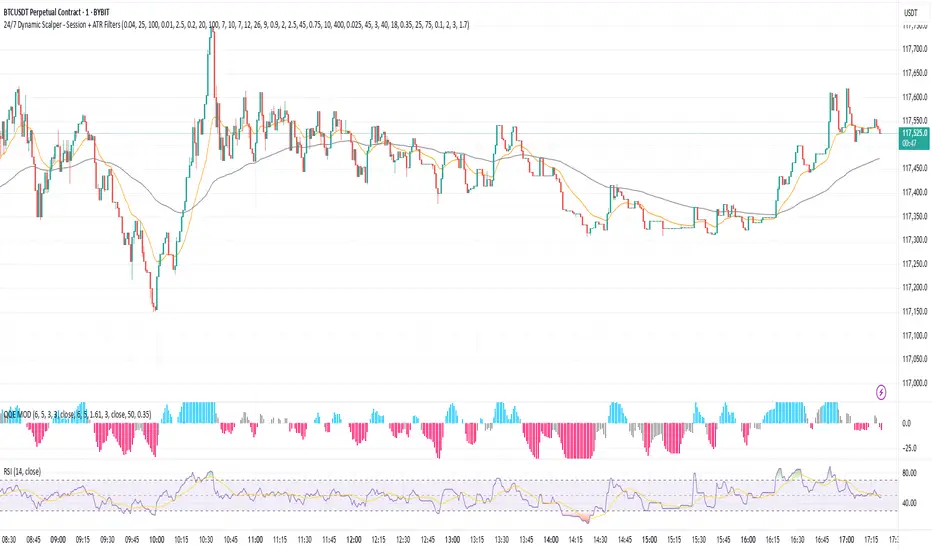
24/7 Dynamic Scalper - Session + ATR Filters24/7 Dynamic Scalper — Session + ATR Filters
The only scalping strategy you’ll need for non-stop, high-precision trading — engineered for automation and hands-off profits!
Session Filtering: Trade only during the hottest market hours (Asia Open & EU Session) — fully automatic.
ATR Stability & Dynamic Risk: Filters out chop and volatility spikes for cleaner, higher-probability entries.
Momentum & Exhaustion Protection: Built-in RSI & MACD logic blocks overbought/oversold traps and weak signals.
Time-in-Trade Auto-Exit: No more stale trades — get capped exposure for every position.
Auto Alerts: Sends structured, ready-to-automate alerts (BUY/SELL/EXIT) — perfect for webhook and bot traders.
Optional Volume/TP Filters: Toggle volume spikes, dynamic ATR-based TP, and even “big candle” protection.
Fully Customizable: Fine-tune everything from leverage to max stop loss (in USDT), bar/range filters, and much more.
Best for: Fast scalpers, algo traders, automation junkies, and anyone who wants a robust, hands-off approach to perpetual futures.
👇 How it Works (Feature Breakdown):
Session Filters: Restricts signals to the highest liquidity hours (Asia/EU), or trade 24/7 — your choice!
ATR + Range Filters: Ensures every entry has real volatility and avoids dangerous chop.
Momentum Logic: Combines EMA, MACD slope, and RSI direction to hunt for real breakouts only.
Exhaustion Safeguards: Avoids classic scalp reversals by blocking overbought/oversold and exhausted MACD/RSI momentum.
Drawdown Defense: Detects “big candle” traps, ATR surges, and lets you cap stop-loss by percent or by max USDT.
Hands-Off Management: All exits (TP/SL/trailing) are managed by your backend/bot via structured alerts — the script keeps charts clean and exits only by time cap (so no backend/strategy overlap).
Ready for Webhook Automation: Clean JSON alerts for BUY, SELL, and CLOSE — drop them straight into your bot for instant auto-trading.
No repaint, no nonsense — just cold, fast, high-frequency scalping with robust, smart filters.
🚀 Plug, Play, Automate.
Copy to your chart, tweak your session/ATR/settings, and wire up your alert to your favorite webhook bot.
Perfect for Bybit, MEXC, Binance, and anywhere you can automate.
Strategy Chameleon [theUltimator5]Have you ever looked at an indicator and wondered to yourself "Is this indicator actually profitable?" Well now you can test it out for yourself with the Strategy Chameleon!
Strategy Chameleon is a versatile, signal-agnostic trading strategy designed to adapt to any external indicator or trading system. Like a chameleon changes colors to match its environment, this strategy adapts to match any buy/sell signals you provide, making it the ultimate backtesting and automation tool for traders who want to test multiple strategies without rewriting code.
🎯 Key Features
1) Connects ANY external indicator's buy/sell signals
Works with RSI, MACD, moving averages, custom indicators, or any Pine Script output
Simply connect your indicator's signal output to the strategy inputs
2) Multiple Stop Loss Types:
Percentage-based stops
ATR (Average True Range) dynamic stops
Fixed point stops
3) Advanced Trailing Stop System:
Percentage trailing
ATR-based trailing
Fixed point trailing
4) Flexible Take Profit Options:
Risk:Reward ratio targeting
Percentage-based profits
ATR-based profits
Fixed point profits
5) Trading Direction Control
Long Only - Bull market strategies
Short Only - Bear market strategies
Both - Full market strategies
6) Time-Based Filtering
Optional trading session restrictions
Customize active trading hours
Perfect for day trading strategies
📈 How It Works
Signal Detection: The strategy monitors your connected buy/sell signals
Entry Logic: Executes trades when signals trigger during valid time periods
Risk Management: Automatically applies your chosen stop loss and take profit levels
Trailing System: Dynamically adjusts stops to lock in profits
Performance Tracking: Real-time statistics table showing win rate and performance
⚙️ Setup Instructions
0) Add indicator you want to test, then add the Strategy to your chart
Connect Your Signals:
imgur.com
Go to strategy settings → Signal Sources
1) Set "Buy Signal Source" to your indicator's buy output
2) Set "Sell Signal Source" to your indicator's sell output
3) Choose table position - This simply changes the table location on the screen
4) Set trading direction preference - Buy only? Sell only? Both directions?
imgur.com
5) Set your preferred stop loss type and level
You can set the stop loss to be either percentage based or ATR and fully configurable.
6) Enable trailing stops if desired
imgur.com
7) Configure take profit settings
8) Toggle time filter to only consider specific time windows or trading sessions.
🚀 Use Cases
Test various indicators to determine feasibility and/or profitability.
Compare different signal sources quickly
Validate trading ideas with consistent risk management
Portfolio Management
Apply uniform risk management across different strategies
Standardize stop loss and take profit rules
Monitor performance consistently
Automation Ready
Built-in alert conditions for automated trading
Compatible with trading bots and webhooks
Easy integration with external systems
⚠️ Important Notes
This strategy requires external signals to function
Default settings use 10% of equity per trade
Pyramiding is disabled (one position at a time)
Strategy calculates on bar close, not every tick
🔗 Integration Examples
Works perfectly with:
RSI strategies (connect RSI > 70 for sells, RSI < 30 for buys)
Moving average crossovers
MACD signal line crosses
Bollinger Band strategies
Custom oscillators and indicators
Multi-timeframe strategies
📋 Default Settings
Position Size: 10% of equity
Stop Loss: 2% percentage-based
Trailing Stop: 1.5% percentage-based (enabled)
Take Profit: Disabled (optional)
Trade Direction: Both long and short
Time Filter: Disabled

TrendMaster Pro 2.3 with Alerts
Hello friends,
A member of the community approached me and asked me how to write an indicator that would achieve a particular set of goals involving comprehensive trend analysis, risk management, and session-based trading controls. Here is one example method of how to create such a system:
Core Strategy Components
Multi-Moving Average System - Uses configurable MA types (EMA, SMA, SMMA) with short-term (9) and long-term (21) periods for primary signal generation through crossovers
Higher Timeframe Trend Filter - Optional trend confirmation using a separate MA (default 50-period) to ensure trades align with broader market direction
Band Power Indicator - Dynamic high/low bands calculated using different MA types to identify price channels and volatility zones
Advanced Signal Filtering
Bollinger Bands Volatility Filter - Prevents trading during low-volatility ranging markets by requiring sufficient band width
RSI Momentum Filter - Uses customizable thresholds (55 for longs, 45 for shorts) to confirm momentum direction
MACD Trend Confirmation - Ensures MACD line position relative to signal line aligns with trade direction
Stochastic Oscillator - Adds momentum confirmation with overbought/oversold levels
ADX Strength Filter - Only allows trades when trend strength exceeds 25 threshold
Session-Based Trading Management
Four Trading Sessions - Asia (18:00-00:00), London (00:00-08:00), NY AM (08:00-13:00), NY PM (13:00-18:00)
Individual Session Limits - Separate maximum trade counts for each session (default 5 per session)
Automatic Session Closure - All positions close at specified market close time
Risk Management Features
Multiple Stop Loss Options - Percentage-based, MA cross, or band-based SL methods
Risk/Reward Ratio - Configurable TP levels based on SL distance (default 1:2)
Auto-Risk Calculation - Dynamic position sizing based on dollar risk limits ($150-$250 range)
Daily Limits - Stop trading after reaching specified TP or SL counts per day
Support & Resistance System
Multiple Pivot Types - Traditional, Fibonacci, Woodie, Classic, DM, and Camarilla calculations
Flexible Timeframes - Auto-adjusting or manual timeframe selection for S/R levels
Historical Levels - Configurable number of past S/R levels to display
Visual Customization - Individual color and display settings for each S/R level
Additional Features
Alert System - Customizable buy/sell alert messages with once-per-bar frequency
Visual Trade Management - Color-coded entry, SL, and TP levels with fill areas
Session Highlighting - Optional background colors for different trading sessions
Comprehensive Filtering - All signals must pass through multiple confirmation layers before execution
This approach demonstrates how to build a professional-grade trading system that combines multiple technical analysis methods with robust risk management and session-based controls, suitable for algorithmic trading across different market sessions.
Good luck and stay safe!

Strategy Builder With IndicatorsThis strategy script is designed for traders who enjoy building systems using multiple indicators.
Please note: This script does not include any built-in indicators. Instead, it works by referencing the plot outputs of the indicators you’ve already added to your chart.
For example, if you add a MACD and an ATR indicator to your chart, you can assign their plot values as inputs in the settings panel of this strategy.
• MACD as a trigger
• ATR as a filter
How Filters Work
Filters check whether certain conditions are met before a trade can be opened. For instance, if you set a filter like ATR > 30, then no trade will be executed unless that condition is true — even if the trigger fires.
All filters are linked, meaning every active filter must be satisfied for a trade to occur.
How Triggers Work
Triggers are what actually fire a trade signal — such as a moving average crossover or RSI breaking above a specific level. Unlike filters, triggers are independent. Only one active trigger needs to be true for the trade to execute.
Thanks to its modular structure, this strategy can be used with any indicator of your choice.
⸻
Risk Management Features
In the settings, you’ll find flexible options for:
• Stop Loss (SL)
• Trailing Stop Loss (TSL)
• Multi Take-Profit (TP)
These features enhance trade safety and let you tailor your risk management.
SL types available:
• Tick-based SL
• Percent-based SL
• ATR-based SL
Once you select your preferred SL type, you can fine-tune its distance using the offset field.
Trailing SL allows your stop to follow price as it moves in your favor — helping to lock in profits.
Multi-TP lets you take profits at two different levels, helping you secure gains while leaving room for extended moves.
Breakeven option is also available to automatically move your SL to entry after reaching a profit threshold.
⸻
How to Build a Solid Strategy
Let’s break down a good setup into three key components:
1. Trend Filter
Avoid trading against the trend — that’s like swimming against the current.
Use a filter like:
• Supertrend
• Momentum indicators
• Candlestick bias, etc.
Example: In this case, I used Supertrend and filtered for trades only if the price is above the uptrend line.
2. Trigger Condition
Once we confirm the trend is on our side, we need a trigger to execute at the right moment. This can be:
• RSI cross
• Candlestick patterns
• Trendline breaks
• Moving average crossovers, etc.
Example: I used RSI crossing above 50 as the entry trigger.
3. Risk Management
Even in the right trend at the right time — anything can happen. That’s why you should always define Stop Loss and Take Profit levels.
⸻
And there you have it! Your strategy is ready to backtest, refine, and deploy with alerts for live trading.
Questions or suggestions? Feel free to reach out

REVELATIONS (VoVix - PoC) REVELATIONS (VoVix - POC): True Regime Detection Before the Move
Let’s not sugarcoat it: Most strategies on TradingView are recycled—RSI, MACD, OBV, CCI, Stochastics. They all lag. No matter how many overlays you stack, every one of these “standard” indicators fires after the move is underway. The retail crowd almost always gets in late. That’s never been enough for my team, for DAFE, or for anyone who’s traded enough to know the real edge vanishes by the time the masses react.
How is this different?
REVELATIONS (VoVix - POC) was engineered from raw principle, structured to detect pre-move regime change—before standard technicals even light up. We built, tested, and refined VoVix to answer one hard question:
What if you could see the spike before the trend?
Here’s what sets this system apart, line-by-line:
o True volatility-of-volatility mathematics: It’s not just "ATR of ATR" or noise smoothing. VoVix uses normalized, multi-timeframe v-vol spikes, instantly detecting orderbook stress and "outlier" market events—before the chart shows them as trends.
o Purist regime clustering: Every trade is enabled only during coordinated, multi-filter regime stress. No more signals in meaningless chop.
o Nonlinear entry logic: No trade is ever sent just for a “good enough” condition. Every entry fires only if every requirement is aligned—local extremes, super-spike threshold, regime index, higher timeframe, all must trigger in sync.
o Adaptive position size: Your contracts scale up with event strength. Tiny size during nominal moves, max leverage during true regime breaks—never guesswork, never static exposure.
o All exits governed by regime decay logic: Trades are closed not just on price targets but at the precise moment the market regime exhausts—the hardest part of systemic trading, now solved.
How this destroys the lag:
Standard indicators (RSI, MACD, OBV, CCI, and even most “momentum” overlays) simply tell you what already happened. VoVix triggers as price structure transitions—anyone running these generic scripts will trade behind the move while VoVix gets in as stress emerges. Real alpha comes from anticipation, not confirmation.
The visuals only show what matters:
Top right, you get a live, live quant dashboard—regime index, current position size, real-time performance (Sharpe, Sortino, win rate, and wins). Bottom right: a VoVix "engine bar" that adapts live with regime stress. Everything you see is a direct function of logic driving this edge—no cosmetics, no fake momentum.
Inputs/Signals—explained carefully for clarity:
o ATR Fast Length & ATR Slow Length:
These are the heart of VoVix’s regime sensing. Fast ATR reacts to sharp volatility; Slow ATR is stability baseline. Lower Fast = reacts to every twitch; higher Slow = requires more persistent, “real” regime shifts.
Tip: If you want more signals or faster markets, lower ATR Fast. To eliminate noise, raise ATR Slow.
o ATR StdDev Window: Smoothing for volatility-of-volatility normalization. Lower = more jumpy, higher = only the cleanest spikes trigger.
Tip: Shorten for “jumpy” assets, raise for indices/futures.
o Base Spike Threshold: Think of this as your “minimum event strength.” If the current move isn’t volatile enough (normalized), no signal.
Tip: Higher = only biggest moves matter. Lower for more signals but more potential noise.
o Super Spike Multiplier: The “are you sure?” test—entry only when the current spike is this multiple above local average.
Tip: Raise for ultra-selective/swing-trading; lower for more active style.
Regime & MultiTF:
o Regime Window (Bars):
How many bars to scan for regime cluster “events.” Short for turbo markets, long for big swings/trends only.
o Regime Event Count: Only trade when this many spikes occur within the Regime Window—filters for real stress, not isolated ticks.
Tip: Raise to only ever trade during true breakouts/crashes.
o Local Window for Extremes:
How many bars to check that a spike is a local max.
Tip: Raise to demand only true, “clearest” local regime events; lower for early triggers.
o HTF Confirm:
Higher timeframe regime confirmation (like 45m on an intraday chart). Ensures any event you act on is visible in the broader context.
Tip: Use higher timeframes for only major moves; lower for scalping or fast regimes.
Adaptive Sizing:
o Max Contracts (Adaptive): The largest size your system will ever scale to, even on extreme event.
Tip: Lower for small accounts/conservative risk; raise on big accounts or when you're willing to go big only on outlier events.
o Min Contracts (Adaptive): The “toe-in-the-water.” Smallest possible trade.
Tip: Set as low as your broker/exchange allows for safety, or higher if you want to always have meaningful skin in the game.
Trade Management:
o Stop %: Tightness of your stop-loss relative to entry. Lower for tighter/safer, higher for more breathing room at cost of greater drawdown.
o Take Profit %: How much you'll hold out for on a win. Lower = more scalps. Higher = only run with the best.
o Decay Exit Sensitivity Buffer: Regime index must dip this far below the trading threshold before you exit for “regime decay.”
Tip: 0 = exit as soon as stress fails, higher = exits only on stronger confirmation regime is over.
o Bars Decay Must Persist to Exit: How long must decay be present before system closes—set higher to avoid quick fades and whipsaws.
Backtest Settings
Initial capital: $10,000
Commission: Conservative, realistic roundtrip cost:
15–20 per contract (including slippage per side) I set this to $25
Slippage: 3 ticks per trade
Symbol: CME_MINI:NQ1!
Timeframe: 1 min (but works on all timeframes)
Order size: Adaptive, 1–3 contracts
No pyramiding, no hidden DCA
Why these settings?
These settings are intentionally strict and realistic, reflecting the true costs and risks of live trading. The 10,000 account size is accessible for most retail traders. 25/contract including 3 ticks of slippage are on the high side for NQ, ensuring the strategy is not curve-fit to perfect fills. If it works here, it will work in real conditions.
Tip: Set to 1 for instant regime exit; raise for extra confirmation (less whipsaw risk, exits held longer).
________________________________________
Bottom line: Tune the sensitivity, selectivity, and risk of REVELATIONS by these inputs. Raise thresholds and windows for only the best, most powerful signals (institutional style); lower for activity (scalpers, fast cryptos, signals in constant motion). Sizing is always adaptive—never static or martingale. Exits are always based on both price and regime health. Every input is there for your control, not to sell “complexity.” Use with discipline, and make it your own.
This strategy is not just a technical achievement: It’s a statement about trading smarter, not just more.
* I went back through the code to make sure no the strategy would not suffer from repainting, forward looking, or any frowned upon loopholes.
Disclaimer:
Trading is risky and carries the risk of substantial loss. Do not use funds you aren’t prepared to lose. This is for research and informational purposes only, not financial advice. Backtest, paper trade, and know your risk before going live. Past performance is not a guarantee of future results.
Expect more: We’ll keep pushing the standard, keep evolving the bar until “quant” actually means something in the public code space.
Use with clarity, use with discipline, and always trade your edge.
— Dskyz , for DAFE Trading Systems

Adaptive Fibonacci Pullback System -FibonacciFluxAdaptive Fibonacci Pullback System (AFPS) - FibonacciFlux
This work is licensed under a Attribution-NonCommercial-ShareAlike 4.0 International (CC BY-NC-SA 4.0). Original concepts by FibonacciFlux.
Abstract
The Adaptive Fibonacci Pullback System (AFPS) presents a sophisticated, institutional-grade algorithmic strategy engineered for high-probability trend pullback entries. Developed by FibonacciFlux, AFPS uniquely integrates a proprietary Multi-Fibonacci Supertrend engine (0.618, 1.618, 2.618 ratios) for harmonic volatility assessment, an Adaptive Moving Average (AMA) Channel providing dynamic market context, and a synergistic Multi-Timeframe (MTF) filter suite (RSI, MACD, Volume). This strategy transcends simple indicator combinations through its strict, multi-stage confluence validation logic. Historical simulations suggest that specific MTF filter configurations can yield exceptional performance metrics, potentially achieving Profit Factors exceeding 2.6 , indicative of institutional-level potential, while maintaining controlled risk under realistic trading parameters (managed equity risk, commission, slippage).
4 hourly MTF filtering
1. Introduction: Elevating Pullback Trading with Adaptive Confluence
Traditional pullback strategies often struggle with noise, false signals, and adapting to changing market dynamics. AFPS addresses these challenges by introducing a novel framework grounded in Fibonacci principles and adaptive logic. Instead of relying on static levels or single confirmations, AFPS seeks high-probability pullback entries within established trends by validating signals through a rigorous confluence of:
Harmonic Volatility Context: Understanding the trend's stability and potential turning points using the unique Multi-Fibonacci Supertrend.
Adaptive Market Structure: Assessing the prevailing trend regime via the AMA Channel.
Multi-Dimensional Confirmation: Filtering signals with lower-timeframe Momentum (RSI), Trend Alignment (MACD), and Market Conviction (Volume) using the MTF suite.
The objective is to achieve superior signal quality and adaptability, moving beyond conventional pullback methodologies.
2. Core Methodology: Synergistic Integration
AFPS's effectiveness stems from the engineered synergy between its core components:
2.1. Multi-Fibonacci Supertrend Engine: Utilizes specific Fibonacci ratios (0.618, 1.618, 2.618) applied to ATR, creating a multi-layered volatility envelope potentially resonant with market harmonics. The averaged and EMA-smoothed result (`smoothed_supertrend`) provides a robust, dynamic trend baseline and context filter.
// Key Components: Multi-Fibonacci Supertrend & Smoothing
average_supertrend = (supertrend1 + supertrend2 + supertrend3) / 3
smoothed_supertrend = ta.ema(average_supertrend, st_smooth_length)
2.2. Adaptive Moving Average (AMA) Channel: Provides dynamic market context. The `ama_midline` serves as a key filter in the entry logic, confirming the broader trend bias relative to adaptive price action. Extended Fibonacci levels derived from the channel width offer potential dynamic S/R zones.
// Key Component: AMA Midline
ama_midline = (ama_high_band + ama_low_band) / 2
2.3. Multi-Timeframe (MTF) Filter Suite: An optional but powerful validation layer (RSI, MACD, Volume) assessed on a lower timeframe. Acts as a **validation cascade** – signals must pass all enabled filters simultaneously.
2.4. High-Confluence Entry Logic: The core innovation. A pullback entry requires a specific sequence and validation:
Price interaction with `average_supertrend` and recovery above/below `smoothed_supertrend`.
Price confirmation relative to the `ama_midline`.
Simultaneous validation by all enabled MTF filters.
// Simplified Long Entry Logic Example (incorporates key elements)
long_entry_condition = enable_long_positions and
(low < average_supertrend and close > smoothed_supertrend) and // Pullback & Recovery
(close > ama_midline and close > ama_midline) and // AMA Confirmation
(rsi_filter_long_ok and macd_filter_long_ok and volume_filter_ok) // MTF Validation
This strict, multi-stage confluence significantly elevates signal quality compared to simpler pullback approaches.
1hourly filtering
3. Realistic Implementation and Performance Potential
AFPS is designed for practical application, incorporating realistic defaults and highlighting performance potential with crucial context:
3.1. Realistic Default Strategy Settings:
The script includes responsible default parameters:
strategy('Adaptive Fibonacci Pullback System - FibonacciFlux', shorttitle = "AFPS", ...,
initial_capital = 10000, // Accessible capital
default_qty_type = strategy.percent_of_equity, // Equity-based risk
default_qty_value = 4, // Default 4% equity risk per initial trade
commission_type = strategy.commission.percent,
commission_value = 0.03, // Realistic commission
slippage = 2, // Realistic slippage
pyramiding = 2 // Limited pyramiding allowed
)
Note: The default 4% risk (`default_qty_value = 4`) requires careful user assessment and adjustment based on individual risk tolerance.
3.2. Historical Performance Insights & Institutional Potential:
Backtesting provides insights into historical behavior under specific conditions (always specify Asset/Timeframe/Dates when sharing results):
Default Performance Example: With defaults, historical tests might show characteristics like Overall PF ~1.38, Max DD ~1.16%, with potential Long/Short performance variance (e.g., Long PF 1.6+, Short PF < 1).
Optimized MTF Filter Performance: Crucially, historical simulations demonstrate that meticulous configuration of the MTF filters (particularly RSI and potentially others depending on market) can significantly enhance performance. Under specific, optimized MTF filter settings combined with appropriate risk management (e.g., 7.5% risk), historical tests have indicated the potential to achieve **Profit Factors exceeding 2.6**, alongside controlled drawdowns (e.g., ~1.32%). This level of performance, if consistently achievable (which requires ongoing adaptation), aligns with metrics often sought in institutional trading environments.
Disclaimer Reminder: These results are strictly historical simulations. Past performance does not guarantee future results. Achieving high performance requires careful parameter tuning, adaptation to changing markets, and robust risk management.
3.3. Emphasizing Risk Management:
Effective use of AFPS mandates active risk management. Utilize the built-in Stop Loss, Take Profit, and Trailing Stop features. The `pyramiding = 2` setting requires particularly diligent oversight. Do not rely solely on default settings.
4. Conclusion: Advancing Trend Pullback Strategies
The Adaptive Fibonacci Pullback System (AFPS) offers a sophisticated, theoretically grounded, and highly adaptable framework for identifying and executing high-probability trend pullback trades. Its unique blend of Fibonacci resonance, adaptive context, and multi-dimensional MTF filtering represents a significant advancement over conventional methods. While requiring thoughtful implementation and risk management, AFPS provides discerning traders with a powerful tool potentially capable of achieving institutional-level performance characteristics under optimized conditions.
Acknowledgments
Developed by FibonacciFlux. Inspired by principles of Fibonacci analysis, adaptive averaging, and multi-timeframe confirmation techniques explored within the trading community.
Disclaimer
Trading involves substantial risk. AFPS is an analytical tool, not a guarantee of profit. Past performance is not indicative of future results. Market conditions change. Users are solely responsible for their decisions and risk management. Thorough testing is essential. Deploy at your own considered risk.

Market Trend Levels Non-Repainting [BigBeluga X PineIndicators]This strategy is based on the Market Trend Levels Detector developed by BigBeluga. Full credit for the concept and original indicator goes to BigBeluga.
The Market Trend Levels Detector Strategy is a non-repainting trend-following strategy that identifies market trend shifts using two Exponential Moving Averages (EMA). It also detects key price levels and allows traders to apply multiple filters to refine trade entries and exits.
This strategy is designed for trend trading and enables traders to:
Identify trend direction based on EMA crossovers.
Detect significant market levels using labeled trend lines.
Use multiple filter conditions to improve trade accuracy.
Avoid false signals through non-repainting calculations.
How the Market Trend Levels Detector Strategy Works
1. Core Trend Detection Using EMA Crossovers
The strategy detects trend shifts using two EMAs:
Fast EMA (default: 12 periods) – Reacts quickly to price movements.
Slow EMA (default: 25 periods) – Provides a smoother trend confirmation.
A bullish crossover (Fast EMA crosses above Slow EMA) signals an uptrend , while a bearish crossover (Fast EMA crosses below Slow EMA) signals a downtrend .
2. Market Level Detection & Visualization
Each time an EMA crossover occurs, a trend level line is drawn:
Bullish crossover → A green line is drawn at the low of the crossover candle.
Bearish crossover → A purple line is drawn at the high of the crossover candle.
Lines can be extended to act as support and resistance zones for future price action.
Additionally, a small label (●) appears at each crossover to mark the event on the chart.
3. Trade Entry & Exit Conditions
The strategy allows users to choose between three trading modes:
Long Only – Only enters long trades.
Short Only – Only enters short trades.
Long & Short – Trades in both directions.
Entry Conditions
Long Entry:
A bullish EMA crossover occurs.
The trade direction setting allows long trades.
Filter conditions (if enabled) confirm a valid long signal.
Short Entry:
A bearish EMA crossover occurs.
The trade direction setting allows short trades.
Filter conditions (if enabled) confirm a valid short signal.
Exit Conditions
Long Exit:
A bearish EMA crossover occurs.
Exit filters (if enabled) indicate an invalid long position.
Short Exit:
A bullish EMA crossover occurs.
Exit filters (if enabled) indicate an invalid short position.
Additional Trade Filters
To improve trade accuracy, the strategy allows traders to apply up to 7 additional filters:
RSI Filter: Only trades when RSI confirms a valid trend.
MACD Filter: Ensures MACD histogram supports the trade direction.
Stochastic Filter: Requires %K line to be above/below threshold values.
Bollinger Bands Filter: Confirms price position relative to the middle BB line.
ADX Filter: Ensures the trend strength is above a set threshold.
CCI Filter: Requires CCI to indicate momentum in the right direction.
Williams %R Filter: Ensures price momentum supports the trade.
Filters can be enabled or disabled individually based on trader preference.
Dynamic Level Extension Feature
The strategy provides an optional feature to extend trend lines until price interacts with them again:
Bullish support lines extend until price revisits them.
Bearish resistance lines extend until price revisits them.
If price breaks a line, the line turns into a dotted style , indicating it has been breached.
This helps traders identify key levels where trend shifts previously occurred, providing useful support and resistance insights.
Customization Options
The strategy includes several adjustable settings :
Trade Direction: Choose between Long Only, Short Only, or Long & Short.
Trend Lengths: Adjust the Fast & Slow EMA lengths.
Market Level Extension: Decide whether to extend support/resistance lines.
Filters for Trade Confirmation: Enable/disable individual filters.
Color Settings: Customize line colors for bullish and bearish trend shifts.
Maximum Displayed Lines: Limit the number of drawn support/resistance lines.
Considerations & Limitations
Trend Lag: As with any EMA-based strategy, signals may be slightly delayed compared to price action.
Sideways Markets: This strategy works best in trending conditions; frequent crossovers in sideways markets can produce false signals.
Filter Usage: Enabling multiple filters may reduce trade frequency, but can also improve trade quality.
Line Overlap: If many crossovers occur in a short period, the chart may become cluttered with multiple trend levels. Adjusting the "Display Last" setting can help.
Conclusion
The Market Trend Levels Detector Strategy is a non-repainting trend-following system that combines EMA crossovers, market level detection, and customizable filters to improve trade accuracy.
By identifying trend shifts and key price levels, this strategy can be used for:
Trend Confirmation – Using EMA crossovers and filters to confirm trend direction.
Support & Resistance Trading – Identifying dynamic levels where price reacts.
Momentum-Based Trading – Combining EMA crossovers with additional momentum filters.
This strategy is fully customizable and can be adapted to different trading styles, timeframes, and market conditions.
Full credit for the original concept and indicator goes to BigBeluga.

GM+For a Short Trade:
When a bullish candle (close > open) is larger than the previous candle and the MACD histogram for the past three bars is consecutively lower (suggesting weakening upward momentum), the script enters a short position.
For a Long Trade:
When a bearish candle (close < open) is larger (in body size) than the previous candle and the MACD histogram for the past three bars is consecutively higher (suggesting the downward move is losing strength), the script enters a long position.
Position Management:
There are no stop loss or take profit levels. The position is closed only when an opposite signal appears.

Kinetik Model [NantzOS]Description:
The Kinetik Model is a strategy that reinterprets the traditional stochastic oscillator to take advantage of momentum instead of the standard overbought/oversold reversal approach. Primarily operating upon zero line crosses, what you observe is the difference between the K and D plots. the first unique feature about this system is that the stochastic calculation has been made "boundless" in order to more accurately gauge the rate of momentum. It doesn't consolidate in upper or lower channels. The second feature is the dataset typically known as %K smoothing is set to a fixed value, the %K length and %D smoothing serve as a customizable length and signal. The third is that it takes trades based on the difference between the fixed %K and customizable %D, a reminder that is your oscillator display. This oscillator versus the traditional stochastic is comparable to the MACD histogram versus the MACD line plots. The fourth feature is that the user dynamically tests the upper and lower thresholds, displayed with a color background on the oscillator, to act as a filtration method. The system won't take shorts if momentum is above the upper threshold and won't take longs if it's performing below the lower threshold. Lastly, this system uses a trailing stop exit strategy, which can be deactivated, and the option to test long only.
Features Summarized:
A reimagined stochastic that operates without fixed boundries, offering flexibility for properly observing momentum.
High and low levels act as extreme zones for highlighting strong trends.
Users can modify data length, signal input, and thresholds from the settings to suit their preferred asset and time frame.
A built-in optional stop-loss mechanism with adjustable sensitivity, enabling tighter or more relaxed risk management.
Includes and optional long only setting and candle coloring with signals.
How to Use:
Navigate to the indicator tab in TradingView to search and apply the Kinetik Model.
Access the settings icon on the indicator to navigate the style and settings:
Length: Modifies the amount of data used to calculate the oscillator.
Signal: Further calibrates the sensitivity of the final plot.
High/Low Thresholds: A single filtration method for defining extreme zones of momentum bias, which determines entry/exits along with the zero line crosses.
Remaining Settings: Customize stop loss calibration along with optional features and styling choice.
Oscillators have been a staple in financial analysis since the mid-20th century, with tools like the RSI, MACD, and Stochastic helping gauge overbought and oversold conditions. What makes the latter unique is that the stochastic utilizes highs and lows as opposed to various EMA rates of change. Kinetik's unique boundless stochastic calculation and K/D difference plotting are the heart of this strategy.

TradeShields Strategy Builder🛡 WHAT IS TRADESHIELDS?
This no-code strategy builder is designed for traders on TradingView, offering an intuitive platform to create, backtest, and automate trading strategies. While identifying signals is often straightforward, the real challenge in trading lies in managing risk and knowing when not to trade. It equips users with advanced tools to address this challenge, promoting disciplined decision-making and structured trading practices.
This is not just a collection of indicators but a comprehensive toolkit that helps identify high-quality opportunities while placing risk management at the core of every strategy. By integrating customizable filters, robust controls, and automation capabilities, it empowers traders to align their strategies with their unique objectives and risk tolerance.
_____________________________________
🛡 THE GOAL: SHIELD YOUR STRATEGY
The mission is simple: to shield your strategy from bad trades . Whether you're a seasoned trader or just starting, the hardest part of trading isn’t finding signals—it’s avoiding trades that can harm your account. This framework prioritizes quality over quantity , helping filter out suboptimal setups and encouraging disciplined execution.
With tools to manage risk, avoid overtrading, and adapt to changing market conditions, it protects your strategy against impulsive decisions and market volatility.
_____________________________________
🛡 HOW TO USE IT
1. Apply Higher Timeframe Filters
Begin by analyzing broader market trends using tools like the 200 EMA, Ichimoku Cloud, or Supertrend on higher timeframes (e.g., daily or 4-hour charts).
- Example: Ensure the price is above the 200 EMA on the daily chart for long trades or below it for short trades.
2. Identify the Appropriate Entry Signal
Choose an entry signal that aligns with your model and the asset you're trading. Options include:
Supertrend changes for trend reversals.
Bollinger Band touches for mean-reversion trades.
RSI strength/weakness for overbought or oversold conditions.
Breakouts of key levels (e.g., daily or weekly highs/lows) for momentum trades.
MACD and TSI flips.
3. Determine Take-Profit and Stop-Loss Levels
Set clear exit strategies to protect your capital and lock in profits:
Use single, dual, or triple take-profit levels based on percentages or price levels.
Choose a stop-loss type, such as fixed percentage, ATR-based, or trailing stops.
Optionally, set breakeven adjustments after hitting your first take-profit target.
4. Apply Risk Management Filters
Incorporate risk controls to ensure disciplined execution:
Limit the number of trades per day, week, or month to avoid overtrading.
Use time-based filters to trade during specific sessions or custom windows.
Avoid trading around high-impact news events with region-specific filters.
5. Automate and Execute
Leverage the advanced automation features to streamline execution. Alerts are tailored specifically for each supported platform, ensuring seamless integration with tools like PineConnector, 3Commas, Zapier, and more.
_____________________________________
🛡 CORE FOCUS: RISK MANAGEMENT, AUTOMATION, AND DISCIPLINED TRADING
This builder emphasizes quality over quantity, encouraging traders to approach markets with structure and control. Its innovative tools for risk management and automation help optimize performance while reducing effort, fostering consistency and long-term success.
_____________________________________
🛡 KEY FEATURES
General Settings
Theme Customization : Light and dark themes for a tailored interface.
Timezone Adjustment : Align session times and news schedules with your local timezone.
Position Sizing : Define lot sizes to manage risk effectively.
Directional Control : Choose between long-only, short-only, or both directions for trading.
Time Filters
Day-of-Week Selection : Enable or disable trading on specific days.
Session-Based Trading : Restrict trades to major market sessions (Asia, London, New York) or custom windows.
Custom Time Windows : Precisely control the timeframes for trade execution.
Risk Management Tools
Trade Limits : Maximum trades per day, week, or month to avoid overtrading.
Automatic Trade Closures : End-of-session, end-of-day, or end-of-week options.
Duration-Based Filters : Close trades if take-profit isn’t reached within a set timeframe or if they remain unprofitable beyond a specific duration.
Stop-Loss and Take-Profit Options : Fixed percentage or ATR-based stop-losses, single/dual/triple take-profit levels, and breakeven stop adjustments.
Economic News Filters
Region-Specific Filters : Exclude trades around major news events in regions like the USA, UK, Europe, Asia, or Oceania.
News Avoidance Windows : Pause trades before and after high-impact events or automatically close trades ahead of scheduled news releases.
Higher Timeframe Filters
Multi-Timeframe Tools : Leverage EMAs, Supertrend, or Ichimoku Cloud on higher timeframes (Daily, 4-hour, etc.) for trend alignment.
Chart Timeframe Filters
Precision Filtering : Apply EMA or ADX-based conditions to refine trade setups on current chart timeframes.
Entry Signals
Customizable Options : Choose from signals like Supertrend, Bollinger Bands, RSI, MACD, Ichimoku Cloud, or EMA pullbacks.
Indicator Parameter Overrides : Fine-tune default settings for specific signals.
Exit Settings
Flexible Take-Profit Targets : Single, dual, or triple targets. Exit at significant levels like daily/weekly highs or lows.
Stop-Loss Variability : Fixed, ATR-based, or trailing stop-loss options.
Alerts and Automation
Third-Party Integrations : Seamlessly connect with platforms like PineConnector, 3Commas, Zapier, and Capitalise.ai.
Precision-Formatted Alerts : Alerts are tailored specifically for each platform, ensuring seamless execution. For example:
- PineConnector alerts include risk-per-trade parameters.
- 3Commas alerts contain bot-specific configurations.
_____________________________________
🛡 PUBLISHED CHART SETTINGS: 15m COMEX:GC1!
Time Filters : Trades are enabled from Tuesday to Friday, as Mondays often lack sufficient data coming off the weekend, and weekends are excluded due to market closures. Custom time sessions are turned off by default, allowing trades throughout the day.
Risk Filters : Risk is tightly controlled by limiting trades to a maximum of 2 per day and enabling a mechanism to close trades if they remain open too long and are unprofitable. Weekly trade closures ensure that no positions are carried over unnecessarily.
Economic News Filters : By default, trades are allowed during economic news periods, giving traders flexibility to decide how to handle volatility manually. It is recommended to enable these filters if you are creating strategies on lower timeframes.
Higher Timeframe Filters : The setup incorporates confluence from higher timeframe indicators. For example, the 200 EMA on the daily timeframe is used to establish trend direction, while the Ichimoku cloud on the 30-minute timeframe adds additional confirmation.
Entry Signals : The strategy triggers trades based on changes in the Supertrend indicator.
Exit Settings : Trades are configured to take partial profits at three levels (1%, 2%, and 3%) and use a fixed stop loss of 2%. Stops are moved to breakeven after reaching the first take profit level.
_____________________________________
🛡 WHY CHOOSE THIS STRATEGY BUILDER?
This tool transforms trading from reactive to proactive, focusing on risk management and automation as the foundation of every strategy. By helping users avoid unnecessary trades, implement robust controls, and automate execution, it fosters disciplined trading.

[Support and Resistance with Trend Lines] with Backtest (TSO) with Backtest (TSO)
===========================================================================
===========================================================================
This indicator serves as a comprehensive full-cycle trading system, providing alerts at each stage of the trade, from opening to closure. The algorithm uses most recent and historical S&R (Support and Resistance) levels with most recent and historical Trend Lines, generating signals for trades when Breaks/Bounces occur (Trade Open Signal triggers can be configured via very customizable indicator Input "Signal Trigger Matrix" settings). With signal for trade open, TP (Take Profit and SL (Stop Loss) levels are calculated as well and marked on the chart including alerts for each action of the trade. The indicator offers a variety of automated approaches for TP (Take-Profit) and SL (Stop-Loss) settings. These include static current/historical S&R (Support and Resistance) levels or S&R/Trend Lines dynamic breaks for TP (Take-Profit) and various SL (Stop-Loss) approaches, including ATR Trailing SL, opposite S&R (Support and Resistance) levels SL, opposite Trend Lines SL and more. This diverse set of tools ensure flexibility in tailoring TP (Take-Profit) and SL (Stop-Loss) parameters to different market conditions, contributing to a more adaptive and robust trading system. Additionally, a series of signal analysis tools, including market sentiment, candle bar analysis, divergence, and volume, enhance the precision of trading signals.
* Works with popular timeframes: 1M, 3M, 5M, 15M, 30M, 45M, 1H.
* Works well with Futures and Indices, can be used to trade Stocks, Crypto and FOREX.
* Includes LIVE alert/labels Breakouts and Bounces signal trigger feature, which can be used for scalping (NOTE: This approach cannot be backtested).
* Every action of the trade is calculated on a confirmed closed candle bar state (barstate.isconfirmed), so the indicator will never repaint.
==============================================================
Indicator examples:
---------------------------------------------------------------------------
Strategy Config: SRTL_MES_15M3Y_EODoff_ALL
Here is a nice example of MES (Micro E-Mini S&P 500 Index Futures) configuration, which uses S&R (Support and Resistance) breakouts as signal trigger with Elliot Wave confirmation and previous S&R historical levels for TP (Take-Profit).
---------------------------------------------------------------------------
An example of an intraday Tesla trade. Also the green arrows will be displayed IMMEDIATELY when Breakout/Reverse Bounce occurs (same an Alert will be triggered immediately).
===========================================================================
Trading open/close/TP/SL labels, plots and colors explanations:
---------------------------------------------------------------------------
>>> S&R (Support and Resistance) levels/lines: orange - support, blue - resistance (can be hidden).
>>> Trend Lines: yellow - support, green - resistance (can be hidden).
>>> Blue labels show resistance breakouts and bounces, light-blue - bullish, dark-blue - bearish
>>> Yellow labels show resistance breakouts and bounces, light-yellow - bullish, dark-yellow - bearish
>>> Green/Red arrows on top/bottom of candle bar will show LIVE breakouts (if turned on)
>>>>> LONG open: green "house" looking arrow below candle bar.
>>>>> SHORT open: red "house" looking arrow above candle bar.
>>>>> LONG/SHORT take-profit target: green/red circles (multi-profit > TP2/3/4/5 smaller circles).
>>>>> LONG/SHORT stop-loss target: green/red + crosses.
>>>>> LONG/SHORT take-profit hits: green/red diamonds.
>>>>> LONG/SHORT stop-loss hits: green/red X-crosses.
>>>>> LONG/SHORT EOD (End of Day | Intraday style) close (profitable trade): green/red squares.
>>>>> LONG/SHORT EOD (End of Day | Intraday style) close (loss trade): green/red PLUS(+)-crosses.
===========================================================================
STATS TABLE ///////////////////////////////////////////////////////////////
---------------------------------------------------------------------------
>>> Trading STATS table on the chart showing current trade direction, Last TP (Take-Profit) Taken, Current Trade PL (profit/loss in price difference from trade open to the very current state).
---------------------------------------------------------------------------
CUSTOM TRADING DATE RANGE /////////////////////////////////////////////////
---------------------------------------------------------------------------
>>>>> This feature can be used to manually set indicator trading range from and to a specific date and time. NOTE: This is not intended for a very long date range backtesting, utilize TradingView Strategy Tester for that.
* Use TradingView “Strategy Tester” to see Backtesting results
NOTE: If Strategy Tester does not show any results with Date Ranged fully unchecked, there may be an issue where a script opens a trade, but there is not enough TradingView power to set the Take-Profit and Stop-Loss and somehow an open trade gets stuck and never closes, so there are “no trades present”. In such case - manually check “Start”/“End” dates or use “Deep Backtesting” feature!
---------------------------------------------------------------------------
INTRADAY ACTIVE TRADING SESSION CONFIGURATION /////////////////////////////
---------------------------------------------------------------------------
>>> Regional Active Trading Session Hours Schedule: If selected - trades will only open during regional active trading session, if 'OFF', there will be no trading schedule and trades will open 24/7.
>>> EOD(End of Day) Close - On/Off: Close the trade if it's still open at the end of active trading session (on the very last candle bar). NOTE: If no region is selected at 'Regional Active Trading Session Schedule' - there will be no EOD(End of Day) Close and trades will run overnight until either SL(Stop-Loss) or TP(Take-Profit) is hit!
>>>>> EOD(End of Day) Close - 1 candle bar before last: This is specifically for stocks as while usually indices can be closed 15minutes after the market closes, for stocks - the last candle bar closes at the same time with the market active trading session, which if closed - trades can't be closed until next day/session! Enable this setting for the trade to close/alert 1 candle bar before the last one, so there is still time to close the trade at the Broker (NOTE: depending on the timeframe, 1 candle bar can be: 15sec, 30sec, 1min, 3min, 5min, 15min, 30min, 45min, 1h).
---------------------------------------------------------------------------
SIGNAL TRIGGER MATRIX ////////////////////////////////////////////////
---------------------------------------------------------------------------
>>> Trading Engine: This setting turns on TradingView Strategy trading engine for backtesting.
>>> Market Session Only: With this setting turned on, all signal trigger Breaks/Bounces will be hidden during Pre/Post market time.
>>> Plot S&R Levels/Lines: Plot S&R (Support and Resistance) on chart. Note: historical levels/lines will only be plotted if hit (Break/Bounce).
>>> Plot Trend Lines Levels/Lines: Plot Trend Lines levels/lines on chart. Note: historical levels/lines will only be plotted if hit (Break/Bounce).
>>> Use S&R Current Levels | Use S&R Historical Levels | Use Trend Lines Current Levels | Use Trend Lines Historical Levels |: Choose which levels should be used for Breaks/Bounces to be captured on. If all triggers are turned on/checked - whatever happens 1st wins the trigger.
>>> Breaks | Bounces: 'Breaks': Turn on Breaks through levels/lines signal trigger. | 'Bounces': Turn on Bounces off levels/lines signal trigger.
>>> Signal: Regular | Signal: S&R Combo | Signal: TL Combo | Signal: S&R + TL Combo | Signal: Repeat Action |: Trade open signal trigger execution approach MATRIX (If 1 or more turned on at the same time - whatever comes first will be the trade signal trigger). 'Regular': A single Break/Bounce must occur on a closed bar for signal trigger. 'S&R Combo': A combination of 2 Current + Historical S&R (Support and Resistance) Break/Bounce must happen in the same direction on same bar for signal trigger. 'TL Combo': A combination of 2 Current + Historical Trend Lines Break/Bounce must happen in the same direction on same bar for signal trigger. 'S&R + TL Combo': a combination of ANY S&R and Trend Line Break/Bounce must happen in the same direction on same bar for signal trigger. 'Repeat Action': Initial and then confirmation (2nd/3rd/etc. consecutive occurence) Break/Bounce must occur on same level/line for signal trigger.
>>> Historical - Look Back (# of days): How far back (in # of days) will historical S&R/Trend Lines will be used for Trade Open signals/TP/SL/etc.
>>> Historical - Look Back Invalidation (# of days): IF THERE IS TOO MUCH HISTORICAL LEVELS/LINES ON CHART - LOWER THIS SETTING + MAKE SURE IT'S SMALLER THAN 'Historical - Look Back (# of days)'. With big Look back period (5+ days) - it can become very messy with too many historical levels/lines. To clear oldest historical levels/lines - set Look Back Invalidation # of days to less than Historical Look Back # of days. (After X # of Look Back Invalidation days - older levels/lines will become invalidated and no longer used for opening trades/TP (Take-Profit)/SL (Stop-Loss), while newer levels/lines will still be discovered.
>>> S&R/Trend Lines - Support/Resistance combined into 1 entity: Every level or a line becomes simply a level or a line, regardless if it originally was a support or resistance. By default, depending on the level/line originally being support or resistance - the signal direction will be such as: Resistance is broken > LONG / bounced > SHORT; Support is broken > SHORT / bounced > LONG; with this setting on, either level or line can be both broken or bounced off in ANY direction, trade open direction will depend on current market sentiment only.
---------------------------------------------------------------------------
S&R CONFIGURATION ////////////////////////////////////////////////
---------------------------------------------------------------------------
>>> S&R Search - Left Bars (current): This setting is for calculating optimal S&R (Support and Resistance) levels (in combination with below - Right Bars).
>>> S&R Search - Right Bars (current): This setting is for calculating optimal S&R (Support and Resistance) levels (in combination with above - Left Bars).
>>> S&R Search - Custom Resolution (current): This is a custom timeframe setting specifically for S&R Search, it disregards current chart timeframe. This is great to use for scalping, for example: with main chart set to 1min and the custom timeframe set to 3min or 5min - there will be stronger support/resistance levels with more detailed price action.
>>> S&R Search - Left Bars (historical): This setting is for calculating optimal S&R (Support and Resistance) levels (in combination with below - Right Bars).
>>> S&R Search - Right Bars (historical): This setting is for calculating optimal S&R (Support and Resistance) levels (in combination with above - Left Bars).
>>> S&R Search - Custom Resolution (historical): This is a custom timeframe setting specifically for S&R Search, it disregards current chart timeframe. This is great to use for scalping, for example: with main chart set to 1min and the custom timeframe set to 3min or 5min - there will be stronger support/resistance levels with more detailed price action.
>>> S&R - Historical S&R Levels - Extend to the right: Extend all S&R lines to the right.
>>> S&R (Current/Historical) - Live Breakout/Bounce - ALERT/SHOW: NOTE: Alert wlil trigger immediately at price Breaking thru or Bouncing off level/line and an arrow above /below the bar will show the direction of breakout/bounce. If on that same live bar - price comes back causing the Breakout/Bounce become no longer valid - the arrow will disappear as the condition of the Break/Bounce will no longer be valid.
---------------------------------------------------------------------------
TREND LINES CONFIGURATION ////////////////////////////////////////////////
---------------------------------------------------------------------------
>>> Show: Trend Line development (where it 'did not exist' yet): It takes 2 pivots to develop a trend line, pivot is established at least 3 candle bars later from where the pivot is. With this setting turned on - it will plot dashed lines where trend lines originated connecting the 1st and 2nd pivot point up to where the trend line became established (where in reality you would now be able to draw a certain trend line). Established already generated trend line are plotted with a solid line.
>>> Trend Lines - Line Slope Confirmation: LONG breakout will only be shown if trend line is goind downslope \. SHORT breakout will only be shown if trend line is goind upslope /.
>>> Trend Lines - Search - Left Bars (current): This setting is for calculating optimal Trend Lines.
>>> Trend Lines - Search - Right Bars (current): This setting is for calculating optimal Trend Lines.
>>> Trend Lines - Custom Resolution (current): This is a custom timeframe setting specifically for S&R Search, it disregards current chart timeframe. This is great to use for scalping, for example: with main chart set to 1min and the custom timeframe set to 3min or 5min - there will be stronger support/resistance levels with more detailed price action.
>>> Trend Lines - Search - Left Bars (historical): This setting is for calculating optimal Trend Lines.
>>> Trend Lines - Search - Right Bars (historical): This setting is for calculating optimal Trend Lines.
>>> Trend Lines - Custom Resolution (historical): This is a custom timeframe setting specifically for S&R Search, it disregards current chart timeframe. This is great to use for scalping, for example: with main chart set to 1min and the custom timeframe set to 3min or 5min - there will be stronger support/resistance levels with more detailed price action.
>>> Trend Lines - Historical Trend Lines - Extend to the right: Extend all Trend Lines to the right.
>>> Trend Lines (Current/Historical) - Live Breakout/Bounce - ALERT/SHOW: NOTE: Alert will trigger immediately at price Breaking thru or Bouncing off level/line and an arrow above /below the bar will show the direction of breakout/bounce. If on that same live bar - price comes back causing the Breakout/Bounce become no longer valid - the arrow will disappear as the condition of the Break/Bounce will no longer be valid.
---------------------------------------------------------------------------
TAKE-PROFIT/STOP-LOSS CONFIGURATION ///////////////////////////////////////
---------------------------------------------------------------------------
>>> TP (Take-Profit) System: 'S&R Static Current/Historical': TP (Take-Profit) is calculated using current/historical S&R (Support & Resistance) levels at trade open and remains static. 'S&R/Trend Lines Dynamic Breaks': TP (Take-Profit) is fully dynamic and will be trigger at price above trade open price and with Breakout occurence (S&R or Trend Line current/historical breakout).
>>> TP (Take-Profit) # of targets: It is wise to divide the trade into several profit targets. With this setting - up to 5 TP (Take-Profit) targets can be approached. The trade will be equally divided up by the selected # of TP (Take-Profit) targets.
>>> SL (Stop-Loss) System: 'ATR-Trailing-SL': SL (Stop-Loss) is trail-following the ATR (Average True Range) line, NOTE: If at signal trigger, ATR will be against the trade direction - trade open signal will be skipped; 'S&R-Static-SL': SL (Stop-Loss) is set at trade open per optimal most recent S&R level and remains there until trade closes; 'TrendLines-Static-SL': SL (Stop-Loss) is set at trade open per optimal most recent trend line and remains there until trade closes; 'TrendLines-Dynamic-SL': SL (Stop-Loss) will be set per current opposite trend line and follow it until trade is open.; 'Oppos-Sig-Trd-in-Loss': SL (Stop-Loss) will trigger at opposite signal with trade currently at loss.
>>> SL (Stop-Loss) - On/Off: Without SL (Stop-Loss), unless EOD (End of Day) Close is turned on - there will be no SL (Stop-Loss) at all!
---------------------------------------------------------------------------
MARKET SENTIMENT CONFIRMATION ///////////////////////////////////////
---------------------------------------------------------------------------
>>> Market Sentiment: Signal is confirmed per Market Sentiment direction. If Market Sentiment is turned off - whatever signal comes 1st will be the trade open trigger.
---------------------------------------------------------------------------
SIGNAL ANALYSIS AND CLEANUP ///////////////////////////////////////////////
---------------------------------------------------------------------------
>>> Signal Cleanup - Bar Color: Include Bar Color (bullish/bearish) confirmation, LONG signal will only be opened if signal bar is green/bullish, SHORT if red/bearish.
>>> Signal Cleanup - Bar Directional Structure: Skip opposite bar structure types signals (For example: bearish green hammer).
>>> Signal Cleanup - Bar Doji Skip: Skip doji (indecisive) candles signals.
>>> Signal Cleanup - EWO (Elliott Wave Oscillator): Include EWO (Elliott Wave Oscillator), LONG will only be opened if EWO is bullish / SHORT if EWO is bearish.
>>> Signal Cleanup - VWAP (Volume-Weighted Average Price): Include VWAP (Volume-Weighted Average Price), LONG will only be opened if price is above VWAP / SHORT if price is below VWAP.
>>> Signal Cleanup - MA (Moving Average) Confirmation: Include MA (Moving Average), LONG will only be opened if MA is bullish / SHORT if MA is bearish.
>>> Signal Cleanup - ATR (Average True Range): Include ATR (Average True Range) confirmation, LONG will only be opened if ATR is bullish / SHORT if ATR is bearish.
>>> Signal Cleanup - Divergence(RSI + MACD): Include Divergence (RSI + MACD ) confirmation, LONG will only be opened if Divergence is bullish / SHORT if Divergence is bearish.
>>> Signal Cleanup - Volume % Strength: Include Volume strength/percentage confirmation, LONG/SHORT will only be opened with strong Volume matching the signal direction | By default, strong Volume percentage is set to 150% and weak to 50%.
>>> Signal Cleanup - Volume Above Average: Include Volume Above Moving Average (Volume closing bar closes above volume moving average) confirmation, LONG/SHORT will only be opened with Volume above average - Volume closed bar color must match the closed price color (bullish/bearish direction) + Volume bar must be closed above volume MA line).
---------------------------------------------------------------------------
===========================================================================
||||||||||||||||||||||||||||||||||| *** ||||||||||||||||||||||||||||||||||| *** |||||||||||||||||||||||||||||||||||
||||||||||||||||||||||||||||||||||| *** ||||||||||||||||||||||||||||||||||| *** |||||||||||||||||||||||||||||||||||
TP System - VERY IMPORTANT INFO!
-------------------------------------------------------------------------------------------------------------------
"TP PERCENTAGE" - amount by which current trade/position needs to be reduced/partially closed/sold.
-------------------------------------------------------------------------------------------------------------------
TP System: Dynamic
"TP PERCENTAGE" - will always be the same amount (trade/position size divided by the # of take-profit(TP) targets) and percentage to be closed will always be of the ORIGINAL trade/position.
-------------------------------------------------------------------------------------------------------------------
TP System: Static
"TP PERCENTAGE" - will always be the same amount IF take-profit(TP) targets are hit 1-by-1 (TP1 > TP2 > TP3 > TP4 > TP5), otherwise it will vary and unless it is a 1st take-profit(TP1), the REMAINING trade/position size will always be smaller than original and therefore the percentage to be closed will always be of the REMAINING trade/position and NOT the original one!
-------------------------------------------------------------------------------------------------------------------
"TP PERCENTAGE" CheatSheet (these are the only percentages you may see)
-----------------------------------------------------------------------
TP PERCENTAGE---Close/Sell Amount-------------Example (trade size: 50 stocks)
20%-------------trade size * 0.2--------------50 * 0.2 = 10 stocks
25%-------------trade size * 0.25-------------50 * 0.25 = 12.5(~13) stocks
34%-------------trade size * 0.34-------------50 * 0.34 = 17 stocks
40%-------------trade size * 0.4--------------50 * 0.4 = 20 stocks
50%-------------trade size * 0.5--------------50 * 0.5 = 25 stocks
60%-------------trade size * 0.6--------------50 * 0.6 = 30 stocks
66%-------------trade size * 0.66-------------50 * 0.66 = 33 stocks
75%-------------trade size * 0.75-------------50 * 0.75 = 37.5(~38) stocks
80%-------------trade size * 0.8--------------50 * 0.8 = 40 stocks
100%------------trade size--------------------50 = 50 stocks
-----------------------------------------------------------------------
If for any reason a portion of the current/remaining trade closed at such occurrence was slightly wrong, it is not an issue. Such occurrences are rare and with slight difference in partial TP closed is not significant to overall performance of our algorithms.
||||||||||||||||||||||||||||||||||| *** ||||||||||||||||||||||||||||||||||| *** |||||||||||||||||||||||||||||||||||
||||||||||||||||||||||||||||||||||| *** ||||||||||||||||||||||||||||||||||| *** |||||||||||||||||||||||||||||||||||
===========================================================================
Alert Settings (you don’t have to touch this section unless you will be using TradingView alerts through a Webhook to use with trading bot)
---------------------------------------------------------------------------
Here is how a LONG OPEN alert looks like.
NOTE: Each label , , etc. is customizable, you can change the text of it within indicator Input settings.
ALERT >>>>>>>>>>>>>>>>>>>>>>>>>>>>>>>>>>>>>>>>>>>>>>>
COIN: BTCUSD
TIMEFRAME: 15M
LONG: OPEN
ENTRY: 20000
TP1: 20500
TP2: 21000
TP3: 21500
TP4: 22500
TP5: 23500
SL: 19000
Leverage: 0
---------------------------------------------------------------------------
Here is how a TP1 alert will look with 5 TPs breakdown of the trade.
NOTE1: Next to TP1 taken it will show at which price it was triggered.
NOTE2: Next to "TP Percentage" it shows how much of the CURRENT/ACTIVE/REMAINING trade needs to be closed.
NOTE2: If TP2/3/4/5 comes before TP1 - the alert will tell you exactly how many percent of the trade needs to be closed!
ALERT >>>>>>>>>>>>>>>>>>>>>>>>>>>>>>>>>>>>>>>>>>>>>>>
COIN: BTCUSD
TIMEFRAME: 15M
LONG: TP1
TP1: 20500
TP Percentage: 20%
---------------------------------------------------------------------------
Here is how an alert will look for LONG - STOP-LOSS.
ALERT >>>>>>>>>>>>>>>>>>>>>>>>>>>>>>>>>>>>>>>>>>>>>>>
COIN: BTCUSD
TIMEFRAME: 15M
ENTRY: 20000
LONG: SL
SL: 19000
---------------------------------------------------------------------------
Here is how an alert will look for LONG - EOD (End of Day) In Profit close.
ALERT >>>>>>>>>>>>>>>>>>>>>>>>>>>>>>>>>>>>>>>>>>>>>>>
COIN: BTCUSD
TIMEFRAME: 15M
LONG: EOD-Close (profit)
ENTRY: 20000
EOD-Close: 21900
===========================================================================
Adding Alerts in TradngView
---------------------------------------------------------------------------
-Add indicator to chart and make sure the correct strategy is configured (check Backtesting results)
-Right-click anywhere on the TradingView chart
-Click on Add alert
-Condition: Select this indicator by it’s name
-Immediately below, change it to "alert() function calls only", as other wise there will be 2 alerts for every alert!
-Expiration: Open-ended (that may require higher tier TradingView account, otherwise the alert will need to be occasionally re-triggered)
-Alert name: Whatever you desire
-Hit “Create”
-Note: If you change ANY Settings within the indicator – you must DELETE the current alert and create a new one per steps above, otherwise it will continue triggering alerts per old Settings!
===========================================================================
Good Luck! (NOTE: Trading is very risky, past performance is not necessarily indicative of future results, so please trade responsibly!)
---------------------------------------------------------------------------
NOTE: There seems to be a strange glitch when strategy is running live, it will show "double-take" take-profits labels on the chart. This is not affecting the script logic and backtesting results, if you simply change the timeframe real quick to something else then back - it will no longer show the duplicate orders... this must be some sort of a glitch as every alert was thoroughly tested to make sure everything is working!

Adaptaive MA PSAR Strategy [PivotProphet]This strategy, leverages a dynamic approach to moving averages, an adaptive Parabolic SAR (PSAR), and volume moving averages to create a versatile trading system suitable for various markets. It includes an array of customizable settings that allow traders to adapt the strategy to their preferences and market conditions.
Key Features
Dynamic Moving Averages: Choose between a standard SMA, EMA, or RMA, and explore dynamic versions for adaptive smoothing and trend detection.
Parabolic SAR: Incorporates both standard and adaptive PSAR for trend reversal signals. The adaptive PSAR settings can be fine-tuned for sensitivity and responsiveness.
Volume MA: Enhances trade confirmation with volume moving averages, offering multiple types for a comprehensive market analysis.
Filter Integration: Includes ATR for volatility filtering, ADX for trend strength, RSI for momentum, and MACD for trend confirmation, each with customizable parameters.
Settings Overview
Trend Settings: Choose your preferred MA type and length for trend analysis.
PSAR Settings: Adjust the PSAR start, increment, and maximum values for tailored trend reversal signals.
Adaptive PSAR Settings: Fine-tune the adaptive PSAR with various modes, smoothing periods, and thresholds for enhanced flexibility.
Volume & Volatility Filters: Set up volume MA type and length, and utilize the ATR filter for volatility-based decision-making.
Exit/Entry Conditions: Select from SMA100, PSAR, or Adaptive PSAR for exit conditions, and customize entry conditions with PSAR settings.
Strategy Implementation
The strategy triggers long positions when the price is above the selected MA, accompanied by a favorable PSAR signal and volume exceeding its MA. Short positions are considered under the inverse conditions. Filters such as ADX, RSI, and MACD are applied to refine entry points, while dynamic exit conditions based on the chosen setting ensure disciplined risk management.
Visualization:
SMA and PSAR plots provide a visual representation of the trend and potential reversal points.
Color-coded bars and shapes indicate trading signals and market sentiment.
Designed for versatility, this strategy aims to cater to both novice and experienced traders seeking a robust framework for their trading endeavors. Customize to your heart's content and adapt to the rhythm of the markets with the Adaptive MA PSAR Strategy.

Crypto Punk [Bot] (Zeiierman)█ Overview
The Crypto Punk (Zeiierman) is a trading strategy designed for the dynamic and volatile cryptocurrency market. It utilizes algorithms that incorporate price action analysis and principles inspired by Geometric Brownian Motion (GBM). The bot's core functionality revolves around analyzing differences in high and low prices over various timeframes, estimating drift (trend) and volatility, and applying this information to generate trading signals.
█ How to use the Crypto Punk Bot
Utilize the Crypto Punk Bot as a technical analysis tool to enhance your trading strategy. The signals generated by the bot can serve as a confirmation of your existing approach to entering and exiting the market. Additionally, the backtest report provided by the bot is a valuable resource for identifying the optimal settings for the specific market and timeframe you are trading in.
One method is to use the bot's signals to confirm entry points around key support and resistance levels.
█ Key Features
Let's explain how the core features work in the strategy.
⚪ Strategy Filter
The strategy filter plays a vital role in the entries and exits. By setting this filter, the bot can identify higher or lower price points at which to execute trades. Opting for higher values will make the bot target more long-term extreme points, resulting in fewer but potentially more significant signals. Conversely, lower values focus on short-term extreme points, offering more frequent signals focusing on immediate market movements.
How is it calculated?
This filter identifies significant price points within a specified dynamic range by applying linear regression to the absolute deviation of the range, smoothing out fluctuations, and determining the trend direction. The algorithm then normalizes the data and searches for extreme points.
⚪ External AI filter
The external AI filter allows traders to incorporate two external sources as signal filters. This feature is particularly useful for refining their signal accuracy with additional data inputs.
External sources can include any indicator applied to your TradingView chart that produces a plot as an output, such as a moving average, RSI, supertrend, MACD, etc. Traders can use these indicators of their choice to set filters for screening signals within the strategy.
This approach offers traders increased flexibility to select filters that align with their trading style. For instance, one trader might prefer to take trades when the price is above a moving average, while another might opt for trades when the MACD is below the MACD signal line. These external filters enable traders to choose options that best fit their trading strategies. See the example below. Note that the input sources for the External AI filter can be any indicator applied to the chart, and the input source per se does not make this strategy unique. The AI filter takes the selected input source and applies our function to it. So, if a trader selects RSI as an input filter, RSI is not unique, but how the source is computed within the AI functions is.
How is it calculated?
Once the external filters are selected and enabled within the settings panel, our AI function is applied to enhance the filter's ability to execute trades, even when the set conditions of the filter are not met. For instance, if a trader wants to take trades only when the price is above a moving average, the AI filter can actually execute trades even if the price is below the moving average.
The filter works by combining k-nearest Neighbors (KNN) with Geometric Brownian Motion (GBM) involves first using GBM to model the historical price trends of an asset, identifying patterns of drift and volatility. KNN is then applied to compare the current market conditions with historical instances, identifying the closest matches based on similar market behaviors. By examining the drift values of these nearest historical neighbors, KNN predicts the current trend's direction.
The AI adaptability value is a setting that determines how flexible the AI algorithm is when applying the external AI filter. Setting the adaptability to 10 indicates minimal adaptability, suggesting that the bot will strictly adhere to the set filter criteria. On the other hand, a higher adaptability value grants the algorithm more leeway to "think outside the box," allowing it to consider signals that may not strictly meet the filter criteria but are deemed viable trading opportunities by the AI.
█ Examples
In this example, the RSI is used to filter out signals when the RSI is below the smoothing line, indicating that prices are declining.
Note that the external filter is specifically designed to work with either 'LONG ONLY' or 'SHORT ONLY' modes; it does not apply when the bot is set to trade on 'BOTH' modes. For 'LONG ONLY' positions, the filter criteria are met when source 1 is greater than source 2 (source 1 >= source 2). Conversely, for 'SHORT ONLY' positions, the filter criteria require source 1 to be less than source 2 (source 1 <= source 2).
Examples of Filter Usage:
Long Signals: To receive long signals when the closing price is higher than a moving average, set Source 1 to the 'close' price and Source 2 to a moving average value. This setup ensures that signals are generated only when the closing price exceeds the moving average, indicating a potential upward trend.
█ Settings
⚪ Set Timeframe
Choosing the correct entry and exit timeframes is crucial for the bot's performance. The general guideline is to select a timeframe that is higher than the one currently displayed on the trading chart but still relatively close in duration. For instance, if trading on a 1-minute chart, setting the bot's Timeframe to 5 minutes is advisable.
⚪ Entry
Traders have the flexibility to configure the bot according to their trading strategy, allowing them to choose whether the bot should engage in long positions only, short positions only or both. This customization ensures that the bot aligns with the trader's market outlook and risk tolerance.
⚪ Pyramiding
Pyramiding functionality is available to enhance the bot's trading strategy. If the current position experiences a drawdown by a specified number of points, the bot is programmed to add new positions to the existing one, potentially capitalizing on lower prices to average down the entry cost. To utilize this feature, access the settings panel, navigate to 'Properties,' and look for 'Pyramiding' to specify the number of times the bot can re-enter the market (e.g., setting it to 2 allows for two additional entries).
⚪ Risk Management
The bot incorporates several risk management methods, including a regular stop loss, trailing stop, and risk-reward-based stop loss and exit strategies. These features assist traders in managing their risk.
Stop Loss
Trailing Stop
⚪ Trading on specific days
This feature allows trading on specific days by setting which days of the week the bot can execute trades on. It enables traders to tailor their strategies according to market behavior on particular days.
⚪ Alerts
Alerts can be set for entry, exit, and risk management. This feature allows traders to automate their trading strategy, ensuring timely actions are taken according to predefined criteria.
█ How is Crypto Punk calculated?
The Crypto Punk Bot is a trading bot that utilizes a combination of price action analysis and elements inspired by Geometric Brownian Motion (GBM) to generate buy and sell signals for cryptocurrencies. The bot focuses on analyzing the difference between high and low prices over various timeframes, alongside estimates of drift (trend) and volatility derived from GBM principles.
Timeframe Analysis for Price Action
The bot examines multiple timeframes (e.g., daily, weekly) to identify the range between the highest and lowest prices within each period. This range analysis helps in understanding market volatility and the potential for significant price movements. The algorithm calculates the trading range by applying maximum and minimum functions to the set of prices over your selected timeframe. It then subtracts these values to determine the range's width. This method offers a quantitative measure of the asset's price volatility for the specified period.
Estimating Drift (Trend)
The bot estimates the drift component, which reflects the underlying trend or expected return of the cryptocurrency. The algorithm does this by estimating the drift (trend) using Geometric Brownian Motion (GBM), which involves determining an asset's average rate of return over time, reflecting the asset's expected direction of movement.
Estimating Volatility
Volatility is estimated by calculating the standard deviation of the logarithmic returns of the cryptocurrency's price over the same timeframe used for the drift calculation. Geometric Brownian Motion (GBM) involves measuring the extent of variation or dispersion in the returns of an asset over time. In the context of GBM, volatility quantifies the degree to which the price of an asset is expected to fluctuate around its drift.
Combining Drift and Volatility for Signal Generation
The bot uses the calculated drift and volatility to understand the current market conditions. A higher drift coupled with manageable volatility may indicate a strong upward trend, suggesting a potential buy signal. Conversely, a low or negative drift with increasing volatility might suggest a weakening market, triggering a sell signal.
█ Strategy Properties
This script backtest is done on the 1 hour chart Bitcoin, using the following backtesting properties:
Balance (default): 10 000 (default base currency)
Order Size: 10% of the equity
Commission: 0.05 %
Slippage: 500 ticks
Stop Loss: Risk Reward set to 1
These parameters are set to provide an accurate representation of the backtesting environment. It's important to recognize that default settings may vary for several reasons outlined below:
Order Size: The standard is set at one contract to facilitate compatibility with a wide range of instruments, including futures.
Commission: This fee is subject to fluctuation based on the specific market and financial instrument, and as such, there isn't a standard rate that will consistently yield accurate outcomes.
We advise users to customize the Script Properties in the strategy settings to match their personal trading accounts and preferred platforms. This adjustment is crucial for obtaining practical insights from the deployed strategies.
-----------------
Disclaimer
The information contained in my Scripts/Indicators/Ideas/Algos/Systems does not constitute financial advice or a solicitation to buy or sell any securities of any type. I will not accept liability for any loss or damage, including without limitation any loss of profit, which may arise directly or indirectly from the use of or reliance on such information.
All investments involve risk, and the past performance of a security, industry, sector, market, financial product, trading strategy, backtest, or individual's trading does not guarantee future results or returns. Investors are fully responsible for any investment decisions they make. Such decisions should be based solely on an evaluation of their financial circumstances, investment objectives, risk tolerance, and liquidity needs.
My Scripts/Indicators/Ideas/Algos/Systems are only for educational purposes!
