Trend ShotBTCUSD -- 5 min or 15 min (recommended)
BUY POSITION
1 : Ema 50 must be above ema 200
2 : The macd should show a buy sign
3 : Multiple RSI should show a buy sign
4 : Multiple fast EMA should show a sign of buy
SELL POSITION
1 : Ema 50 must be below ema 200
2 : The macd should show a sell sign
3 : Multiple RSI should show a sell sign
4 : Multiple fast EMA should show a sell sign
Recherche dans les scripts pour "macd"

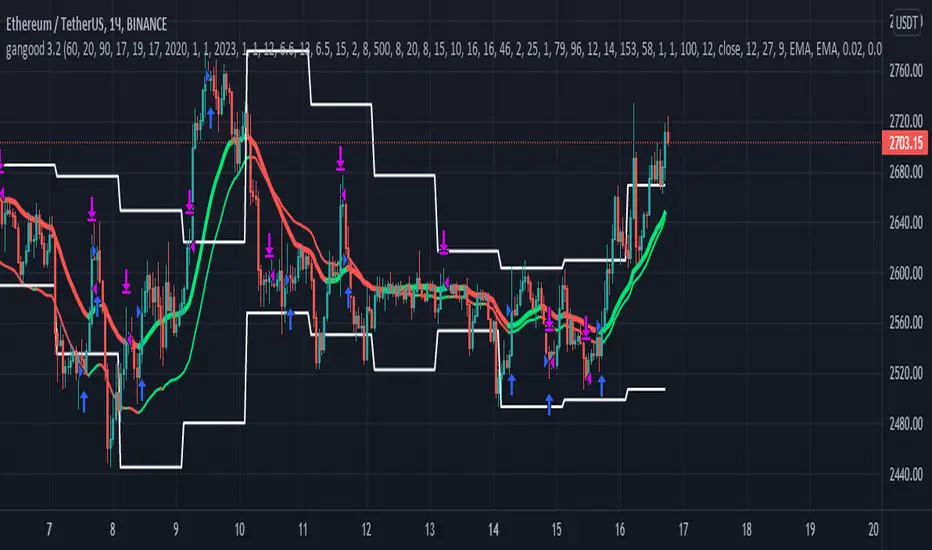
gangood bot for FinandyGangood is a mean reversion algorithm currently optimized for trading the ETH/USDT pair on the 1 hour chart time frame. All indicator inputs use the closing price of the period, and all trades are executed at the open of the period following the period in which the trading signal was generated.
To take into account slippage, the commission costs 0.15%.
Backtest result from 2020.
Result since 2019 2,500,000%, maximum drawdown 18%
This bot uses 11 indicators:
1) ADX
2) RANGE FILTER
3) SAR
4) RSI
5) TWAP
6) JMA
7) MACD
8) VOLUME DELTA
9) VOLUME WEIGHT
10) MA
11) TSI
Pattern 1:
There are 3 main components that make up Gangood: I. Trend Filter. The algorithm uses a version of the ADX indicator as a trend filter to only trade during certain time periods when price is most likely to be range-bound (i.e., average retracement). This indicator consists of a fast ADX and a slow ADX both using the same lookback period.
The ADX is smoothed with a 6-period EMA and the slow ADX is smoothed with a 12-period EMA. When the fast ADX is above the slow ADX , the algorithm does not trade because it indicates that the price is most likely trending, which is bad for a mean reversion system. Conversely, when the fast ADX is below the slow ADX, the price is likely to be in a range, so this is the only time the algorithm is allowed to trade. II. Bollinger Bands When the trend filter allows trading, the algorithm uses Bollinger Bands.
Indicator for opening long and short positions. The Bolliger Bands indicator has a 20 lookback period and a 1.5 standard deviation for both the upper and lower bands. When the price crosses the lower band, a buy signal is generated and a long position is opened. When the price crosses the upper band, a sell signal is generated and a short position is opened.
Pattern 2:
Based on RSI which is commonly used as a trend reversal indicator. However, here it is used as a trend-setting indicator, often with great success. This pattern only takes long trades, which is quite successful in a bull market.
Pattern 3:
Long or short trades are determined by the intersection of the fast EMA with the slow EMA for long positions and vice versa for short positions. Trades should only occur close to intersections. We then use the MACD for the long position. an indicator with a 10-minute time frame where we look for high peaks in negative values for longs and vice versa for shorts. They should be significantly higher than the other peaks.
Capital Management:
The maximum leverage in this strategy, I would recommend 2x, in order to trade without unnecessary risks and keep your nerves in order.
Bot setup:
I use the Finandy terminal, in which you can easily trade with this strategy.
1. We go to binance and turn on the hedging mode, this is necessary so that if tradingview sends a webhook for buying later than for selling.
2. Adding a new signal to Finandy
2.1. Open tab
2.1.1. "Order side" Strategy
2.1.2. "Amount" Balance% x Leverage
2.1.3. We set the percentage of the order two times less than the one you want
2.1.4. "Shoulder" is twice as large as the one you want
2.2.Close tab
2.2.1. "Enebaled" tick
2.2.2. "Reverse / Close" Disable
3. Set a notification for this strategy.
4. Copy "Signal URL" and paste it into webhook on tradingview
5. Copy "Signal Message" and paste it into the message on tradingview
Top 40 High Low Strategy for SPY, 5minThis strategy is developed based on my High Low Index SPY Top 40 indicator
Notes:
- this strategy is only developed for SPY on the 5 min chart . It seems to work with QQQ as well, but it isn't optimized for it
- P/L shown is based on 10 SPY option contracts, call or put, with strike price closest to the entry SPY price and expiry of 0 to 1 day. This includes commissions (can be changed). This is only an estimate calculated using an arbitrary multiplier factor, this can be changed in the setting
- P/L is based on $5000 initial capital
- Works with both regular / extended trading session turned on/off. However, max drawdown is 1/2 with extended trading session ON
- there is still a bug that doesn't allow alert to be created due to calculation error, will update once fixed
This strategy combines signals from the following indicators to determine entry signals:
- High Low Index SPY Top 40
- MACD
- Linear Regression Slope
Entry signal is triggered when:
- High Low Index line crosses the EMA line
- MACD trending in the same direction
- Linear Regression slope is accelerating above a threshold in the same direction, indicating a strong trend
Profit target(PT) and stop loss(SL) are determined using ATR value, with 2:1 Reward to Risk ratio as default.
Exit signal may be triggered prior to PT or SL trigger when:
- High Low Index SPY Top 40 shows a reversal after overbought or oversold conditions (optional)
- Opposite entry signal is triggered
There are a number of optional settings:
- Turn on/off "option trading", P/L will be calculated using share price only without multiplication factor for trading option contracts
- # of options per trade, default to 10
- Reinvest with profit made
- Trade with trailing SL after PT hit
- Take profit early based on Top 40 overbought/oversold
- Trade 0/1 day expiry. This will signal exit by the end of the day on Mon/Wed/Fri, and only exits 1/2 of positions (if in profit) on Tues/Thurs
- Can reduce the SL level without impacting PT
- No entry between 10:05 - 10:20 (don't ask me why, but statistically it performs better)
Consider donating me some of your profit if you make $$$ hahaha~ ;)
Enjoy~~

Shark_AlgoGram_IndicatorHello traders!
I have been developing Shark trading indicator over the last year. This algorithm indicator is based on a set of different strategies, each with its own weight (weighted strategy). The set of strategies that I currently use are 6:
MACD
Stochastic RSI
RSI
Supertrend
MA crossover
Donchin Channel
Moreover, this indicator includes STOP losses criteria and a taking profit strategy. this indicator must be optimized for the desired asset to achieves its full potential.
Best Time-Frame :
The 30 & 31 Minutes Time frame give good results. The algo has been tested for several asset (same dataframe, different optimization values).
When to Buy & Sell :
Buy Entry & Exit : Take entry when Green Arrow or Buy Trigger on screen & Exit when Purple Arrow or exit trigger on screen
Sell Exit & Exit : Take entry when Red Arrow or Sell Trigger on screen & Exit when Purple Arrow or exit trigger on screen
Important note:
Backtest the algorithm with different data stamps to avoid overfitting results
How it works:
The algorithm is based on a combination of well-documented indicators. First, the algorithm calculated the weight_strategy, which represents a value from 0 to 5 of the number of strategies that are fulfilled (in case the weight of each strategy is the same). To open a position, the value of weight_strategy must be greater than the value of weight_signal, by default 2. Modify the indicator parameters for the desired asset and data frame. Set stop-loss and take profit criteria.
Features:
* The algorithm allows to trade with long, short or both positions.
* Backtest the algorithm over a defined interval (data stamp), e.g., from 2022
* stop loss (SL) orders based on movement of the previous candle source, e.g., close or candle volatility. Only close the position after the candle is close!
* It can moves the stop loss when this indicator takes profit (TP) & Market true such condition where trailing SL Activate
* Take profit based on market movement and once 3 condition true out of 6 True they push exit order
* Define delays to evaluate the strategies of more previous candles:
+ Candle Delay is for MACD strategy
+ Candle delay Stoch RSI is for the Stochastic RSI strategy.
+ RSI Candle Delay is for the RSI strategy.
+ Candle delay Exit is the number of candles the algorithm waits to open a new position.
* Choose if you want to use the weighted strategy or just some of them.
* Choose the weight (relevance) of each strategy.
* Customize the well-documented MACD strategy.
* Customize the well-documented Stochastic RSI strategy.
* Customize the well-documented RSI strategy.
* Customize the well-documented Supertrend strategy.
* Customize the well documented MA cross strategy.
Disclaimer :
AlgoGram Script,Indicator,Strategy,Trading Idea & presentations are only for educational & Research purposes and are not intended as investment advice. I cannot guarantee the accuracy of any information provided above , please take trade with help of your Financial adviser or on your own risk
Cheers! & Best Of Luck
By AlgoGram

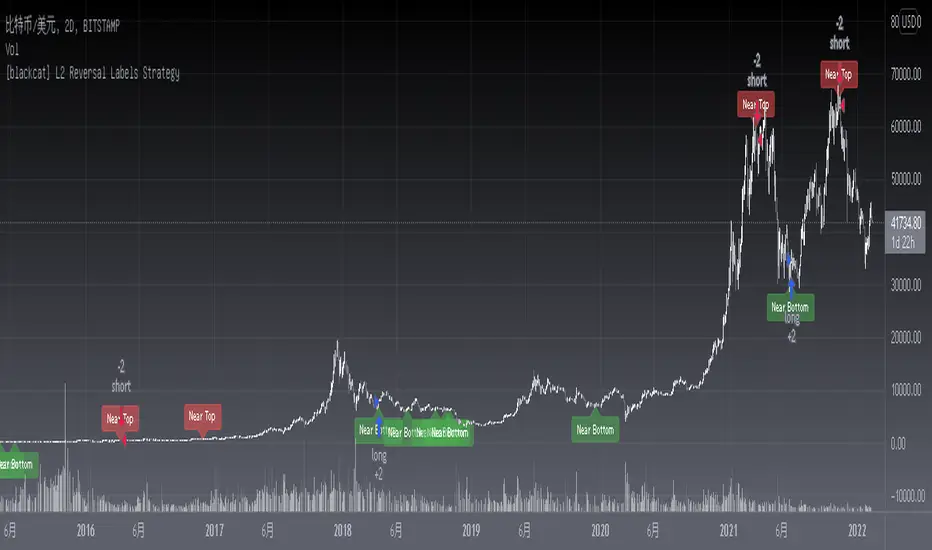
[blackcat] L2 Reversal Labels StrategyLevel: 2
Background
There is a Chinese proverb that says: "The great way leads to simplicity". This indicator is the representative of this meaning. Through the processing of the most common MACD indicator data, it is possible to quickly determine the market price: whether the current price is at a historical high or low, whether a reversal will happen soon, etc. at a glance.
Function
This is the strategy version of the same indicator which performs screening and filtering through the fast and slow line data corresponding to the output of the standard MACD indicator, so as to realize the function of judging the top and bottom of the trend.
Inputs
N/A
Key Signal
Near Top --> Top is reached and reversal may happen soon. (red labels)
Near Bottom --> Bottom is reached and reversal may happen soon. (green labels)
Remarks
The backtest result is picked up and optimized for BTCUSD '2D' time frame, it does not work constantly well for any time frame. You need to combine other indicators for other trading pair and time frame.
You can add alerts for this version.
This is a Level 2 free and open source indicator.
Feedbacks are appreciated.
PowerX Strategy BacktestThis script implements the Power X trading strategy by Markus Heitkoetter and Rockwell Trading. The strategy is described in detail in "The PowerX Strategy: How to Trade Stocks and Options in Only 15 Minutes a Day" written by Markus Heitkoetter.
The Power X trading strategy uses RSI, Slow Stochastic and MACD indicators. When RSI and Slow Stochastic are both greater than 50 and MACD crosses up the signal line, it signals an up-trend. If RSI and slow stochastic are both less than 50 and MACD crosses down the signal line, it signals a down-trend. Other conditions signal no trend. There is an official version of this indicator available: PowerX Strategy Bar Coloring OFFICIAL VERSION.
This script opens a long entry with an up-trend momentum and a short entry with down-trend momentum. Trades are exited when profit target or stop loss is reached. Profit target and stop loss are calculated based on 7 days Average Daily Range (ADR). If the momentum is lost, a trade is exited the next day. The quantity of assets to buy/sell is calculated based on the stop loss to limit the risk to a user defined percentage of the initial capital.
There is another implementation of the Power X trading strategy available by therealhaolu: Power X Strategy Back-test. However, according to the comments this script seems to have some flaws.

Ultimate Scalper 1.2 @DaviddTechThis script turns out to be a great scalper for Crypto.
Long
* Looks for a pullback in MACD
* EMA 50 over EMA 200
Short
* Looks for a pullback in MACD
* EMA 50 below EMA 200
I use also the ADX for filtering flat markets.
ATR, VWAP and RSI can be used for confluence.
WARNING:
- For purpose educate only - My mission is to debunk fake strategies with code to find THE ONE.
- Plots EMAs and other values on chart.
- This script to change bars colours.
Release Notes: Change the description tabs

EMR Strategy [H1 Backtesting]EMR Strategy base on EMA, MACD and RSI to supply signal on time frame H1.
Details of Rule as below:
===
1.EMA
+ Time frame: H1
+ Periods: 25, 100 (~ EMA 25 H4), 600 (~ EMA 25 D1)
===
2.MACD
+ Time frame: H1
+ Periods: 12,26,9
===
3.RSI
+ Time frame: H1
+ Periods: 14
===
4.Trading Rule
4.1.Long Position
+ MACD>0 and RSI>50 and close price moving above EMA 25
+ Close price crossed EMA 100 or crossed EMA 600 at the first time
4.2.Short Position
+ MACD<0 and RSI<50 and close price moving below EMA 25
+ Close price crossed EMA 100 or crossed EMA 600 at the first time
===
5.Money Management
+ This strategy concentrate into winrate.
+ So use trailing stop to protect your profits.
+ And use stoploss to avoid big loss on trades.

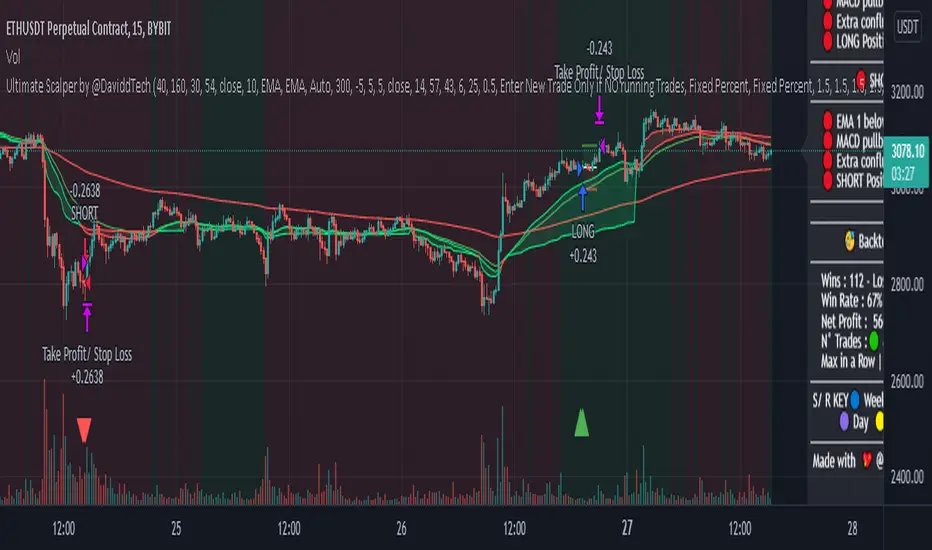
Ultimate Scalper by @DaviddTechThis script turns out to be a great scalper for Crypto.
Long
* Looks for a pullback in MACD
* EMA 50 over EMA 200
Short
* Looks for a pullback in MACD
* EMA 50 below EMA 200
VWAP and RSI can be used for confluence.
WARNING:
- For purpose educate only - My mission is to debunk fake strategies with code to find THE ONE.
- Plots EMAs and other values on chart.
- This script to change bars colours.
Release Notes: Change the description tabs
Stock trending strategy This is a long only strategy designed maily for stock markets and futures. In general it works best with 1h, however it can be optimized with other timeframes as well.
Components:
VWAP
MACD histogram
EMA 9
Rules for entry
Long :
For VWAP: close is above the vwap daily
EMA: close is above the moving average
MACD histogram is above 0
Short:
For VWAP: close is belowthe vwap daily
EMA: close is below the moving average
MACD histogram is below 0
Rules for exit
This strategy does not have any risk management inside. Instead it exits whenver it receives an opposite signal form the original one used for entry.
If you have any questions let me know !

Extremely high win rate FOREX swing strategyTHis is a very simple yet extremely efficient FOREX strategy .
In general it tends to work the best against NZD and AUD pairs, however other major pairs and crosses can work as well.
It's made of a time management, together with MACD , moving average , a price action rule and a risk management.
THe logic behind is the next one :
For LONG:
We have 3 ascending candles.
Histogram of MACD is positive.
Last close of a candle is was above moving average.
If all those previous condition happened before 17/18 UTC time depending if its summer time or not, we enter the trade.
For Short:
We have 3 descending candles.
Histogram of MACD is negative.
Last close of a candle is was below moving average.
If all those previous condition happened before 17/18 UTC time depending if its summer time or not, we enter the trade.
RIsk management
For risk management, since we aim to have a 95%+ win rate, we aim to have a 5:1 or 10:1 risk to reward ratio. Meaning that for each $ we can win, we can lose 5-10$.
THats why I recommend to be extremely careful when playing with leverage with this strategy.

Full Forex scalper StrategyTHis is a FOREX scalping system that can be optimized with almost all majors and crosses pairs.
Its made of multiple elements such as :
MACD
Stochastic RSI
Fast VW moving average
Slow VW moving average
Time management( forex sessions as inputs)
Rules for entry
Long
Last 2 MACD values were ascending, fast moving average is below moving average and stochastic RSI is below 30 level. At the same time we are either into London or NY session.
Short
Last 2 MACD values were descending, fast moving average is above moving average and stochastic RSI is above 70 level. At the same time we are either into London or NY
Rules for exit
WE have 2 exit possibilities: we can exit either at the end of NY/London Session or based on a TP/SL risk management calculating % in movement.
If you have any questions let me know !

Jigga - Heatmap ComparisionHi All,
I always have a question on how to know which sector is performing. I have created this Heatmap comparison to know strength of sector.
I have used RSI and MACD calculation and put it across 5 different index. Color shows bullishness and Gray shows weakness.
You can select RSI or MACD or Both to have calculation. And you can also compare stocks if you want.
Note: Use it for Medium / Long term investment. Can not be use for Intraday.
Happy investing !!

Stock Buy/Sell BotHello everyone, I've been making this strategy for a few weeks now. I finally feel like it's time to release it to the public so I can share what I have been working on.
This strategy only enters a long trades when the MACD crosses over the signal line and the RSI is oversold . The logic behind this is to wait for RSI to enter the oversold territory, and then when the market starts to recovery the MACD will crossover telling us the sell off is over and when are bot to buy.
ADDONS That Affect Strategy:
* Modify RSI oversold and RSI overbought levels.
* Modify MACD Fast and Slow moving average.
Thank you for taking the time to use and try my strategy. I hope you have the best success. I will be making a short strategy, and alerts for this strategy soon so you can automate it. Follow me for updates!

Dankland Playground DCAing multi-strategy OPThis is essentially a script that I made for myself before deciding it may be good enough for you all as well.
How it works basically is this... you have 18 oscillators which can all be used as independently as you wish. That means there are 20 groups which they can be split amongst as you choose.
When in separate groups they should not be able to sell eachothers positions without triggering a stop loss. Every single oscillator has its own position sizing and exit sizing which can be stated as either a percent of balance or a flat amount of contracts. Each oscillator has a minimum amount of profit you can tell it to sell it, which is calculated from the average cost of your current position, which does include all groups. This works out to help you average out better entry and exit prices, essentially a method of DCAing.
You can set the minimum sale amount, which is to keep it from placing orders below your exchanges minimum dollar trade cost.
The included oscillators are as follows:
Chande Momentum cross
Moving Average Cross
MACD cross
%B Bollinger cross
Stochastic cross + region filter
Stochastic RSI cross + region filter
SMII cross and region
Three RMIs
Standard RSI
LSMA-smoothed RSI
Know Sure Thing
RSI of KST
Coppock Curve
RSI of Curve
PPO
RSI of PPO
Trix
RSI of Trix
So the idea is that this is essentially multiple strategies combined into one backtestable house. Balance is calculated for all position sizes in order to try to prevent false entries that plague so many scripts (IE, you set pyramiding to 2, each buy $1000, initial balance $1000, and yet it buys two orders off the bat for $2000 total and nets 400% profit because the second was considered free)/
You tune each side and position size them so that they work together as well as you can and in doing so you are able to create a single backtest that is capable of running a bot, essentially, between multiple strategies - you can run a slower Moving Average cross, a faster SMI cross or MACD, or Bollinger that grabs big moves only, all the while having MACD trade small bonuses along the way. This way you can weight the Risk to Reward of each against eachother.
I will not try to claim this is something you can open and with no work have the best bot on the planet. This scripts intention is to take a lot of relatively common trading strategies and combine them under on roof with some risk management and the ability to weigh each against eachother.
If you are looking for a super advanced singular algorithm that tries to capture every peak and valley exactly on the dot, this is not for you. If you are looking for a tool with a high level of customizability, with a publisher who intends to update it to the best of his ability in accordance to seeking to make the best product that I personally can make for both myself and the community (because I will be using this myself of course!) that was specifically designed with the intention of performing well in spot markets by averaging low entry costs and high exit costs, this is for you! That is the exact intention here.
I do not trade margin currently, I trade spot. I am sure this script can be tuned to work on margin but this is not my intention or area so if this is you and there is something you need for margin specifically implemented, ask, because I likely don't know what you need yet.
The current backtest shown is hand-optimized by myself for BTC/USD 1hr market with NO stop loss enabled and all sales weighed to be around 0% minimum profit from the total average entry cost.
I chose to run it myself with no stop losses because Bitcoin is so bullish to me. The stop losses can still be very profitable, but not 1495% net profit. This style of automation is not for everyone as when running with no stop loss and the requirement every sale is somewhat profitable, or at least no very noticeable loss, you wind up relying on yourself to manually stop out if things crash too much and the bot has to stop trading to wait for market to go back up. The thing to do here if you are playing without a stop loss is to have your own alerts set at your fear level, a % drop in a period of time or something like that, and when you reach that point I would consider resetting the bot so it continues to take trades. I personally will accept a temporary drop in USD as long as I can keep my BTC holdings up overall as the goal should always be to have as many BTC as possible by the start and end of the bull run.

Cyatophilum Strategy BuilderAn indicator to create strategies, backtest and setup alerts.
The user can choose one or multiple TA entry conditions, if more than one the conditions are combined with a logical AND.
The entries will open up a trade, which is then handled by a risk management system including Trailing Stop, Take Profit and up to 100 Safety Orders.
This indicator can be used to backtest 3commas DCA bots who are using TA presets, RSI or ULT.
Its main goal is to create strategies by combining indicators.
Let's dive into the details of what's included:
Entry Condition: MACD
Triggers an entry when macd crosses with the signal line.
Configure the fast, slow length, signal smoothing and timeframe to trigger the condition.
Entry Condition: RSI
Triggers an entry when the RSI is higher or lower than the long/short threshold.
Configure the length, timeframe, long and short threshold to trigger the condition.
Entry Condition: ULT (Ultimate Oscillator)
Triggers an entry when the ULT is higher or lower than the long/short threshold.
Configure the 3 lengths, timeframe, long and short threshold to trigger the condition.
Entry Condition: Bollinger Bands
Triggers an entry when the price is above the upper band for long and below the lower band for short.
Configure the length, standard deviation and timeframe to trigger the condition.
Entry Condition: MFI (Money Flow Index)
Similar to RSI, it triggers an entry when the MFI is higher or lower than the long/short threshold.
Configure the length, timeframe, long and short threshold to trigger the condition.
Entry Condition: CCI (Commodity Channel Index)
Another oscillator that triggers an entry when its value is higher or lower than the long/short threshold.
Configure the length, timeframe, long and short threshold to trigger the condition.
Trend Filters
Use one or two trendlines to filter your trades: go only long/short when the trendline is bullish/bearish.
Choose between the several trendlines: ema, sma, wma, hull ma, kama, alma, rma, swma, vwma, Tilson T3, and the unique Adaptive T3 and Adaptive Hull MA.
If this is not enough, you can use the external trendline feature to plug in any other indicator for your trendline.
The second trendline can be MTF and come from another symbol if needed.
Combining Indicators
Most of the time we will not be using a single indicator at a time, but instead, combine them in order to get stronger entries.
The entry conditions are combined using a AND logical gate, meaning all conditions must be true for the entry to trigger.
Here is an example using a combination of 2 indicators: Bollinger Bands and RSI.
We can see less entries are being triggered on the bottom chart than on the top chart because the bottom chart is combining the 2 indicators while the top chart is only using Bollinger Bands.
You can combine up to all 6 indicators if you want, but keep in mind that combining too many may lead to triggering no entry at all.
Risk Management and Trade system
The indicator will not trigger more than one long or short entry in a row.
To start a new trade, the indicator will wait for either take profit, stop loss or an opposite entry if no SL and TP is set.
Stop Loss and Take Profit
Configure your stop loss and take profit for long and short trades.
You can also make a trailing stoploss and a trailing take profit.
Safety Orders
Just like 3commas bots, you can create a strategy with up to 100 safety orders.
Configure their placement and order size using the price deviation, step scale, take profit type (from base order or total volume), and volume scale settings.
Note: only the 20 first safety order steps or so will be plotted due to graphic limiations. The steps after that still trigger alerts and backtest results.
Creating Alerts
The indicator is using the newest alert system:
1. Write your alert messages in the indicator settings (alert section at the bottom)
2. Click "Create Alert" as usual, but choose "alert() function calls only"
Data Window
Since the indicator is applied on top of the price chart, the oscillator indicators cannot be plotted. You can always add them on another pane but if you want to just see their values, you can use the Data Window to see the value of each oscillator on each bar.
Backtest settings
Used to get the results below:
Initial Capital: 100 000$
Base Order Size: 0.1 contract (BTC)
Safety Order Size: 0.1 contract (BTC)
Commission: 0.1%
Slippage: 100 ticks
pyramiding: 6
The indicator settings are plotted in the main chart panel.

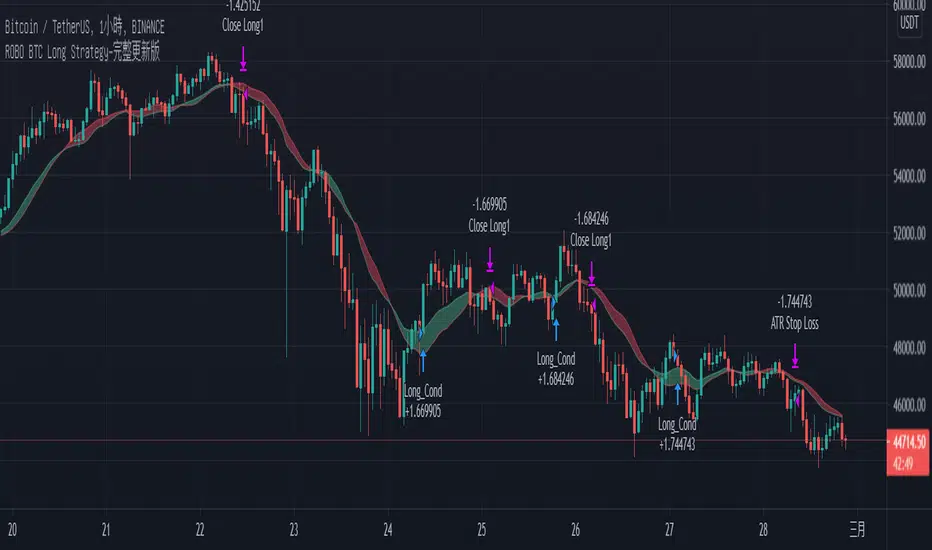
BTC/1H Long Strategy1) At present, six indicators are used for trend combination, including ATR / RSI / ROC / EMA / SMA / MACD .
2) Trend strategy is usually not very good, but any band can be stable profit.
3) BTC / usdt for any exchange, 1 hour time zone.
4) It is expected that the actual measurement will start in February. Please look forward to it.
1)目前使用了六種指標做了趨勢組合,其中包ATR/ RSI / ROC / EMA / SMA /MACD。
2)趨勢策略通常勝率都不太好,但是任何波段都能穩定獲利。
3)適於任何交易所的BTC/USDT,1小時時區。
4)預計3月開始能開始實測,屆時敬請期待。
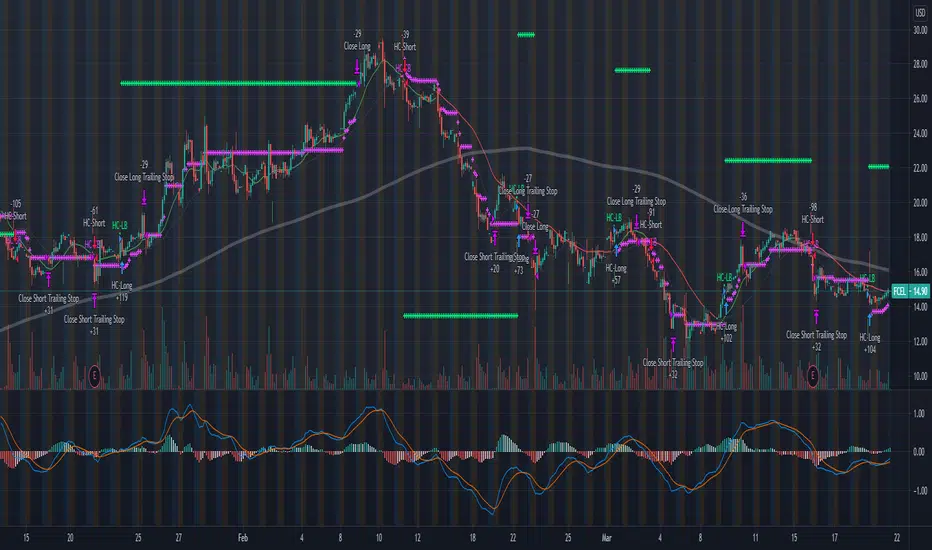
Trend Catcher BotTrend analysis strategy with entry filters such as MACD and Tilson T3. It will look at possible entry points and it can use MACD or TilsonT3 filters to decide whether or not enter in a new trade.
Notes:
- Results include a 0.075% Fee.
- Simulated leverage of 5x.
- Initial Capital of $1000.
- Uses a max order size of $200k per trade (Leverage included).
- Stop loss of 1.15%.
- The stop loss is moved to 0.4% Profit once the Trade reaches 1.15% profit.
- All settings adjustable.
- Non Repainting.

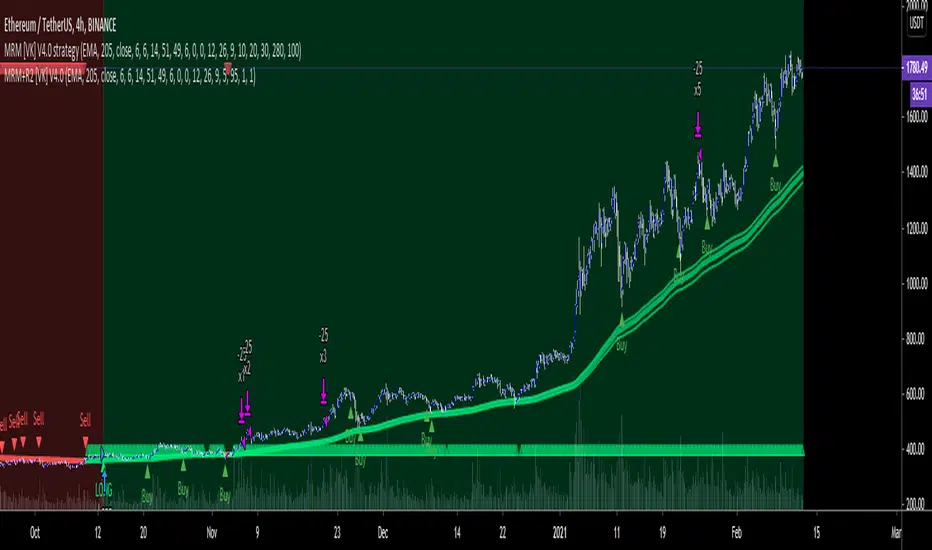
MRM [VK] V4.0 strategyMRM VK strategy
This strategy uses MA, RSI , MACD combined.
MACD and RSI can be used multi time frame to filter trend.
It is a very simple strategy which goes long/short when MACD , RSI and MA Trend Changes in higher Time Frame.
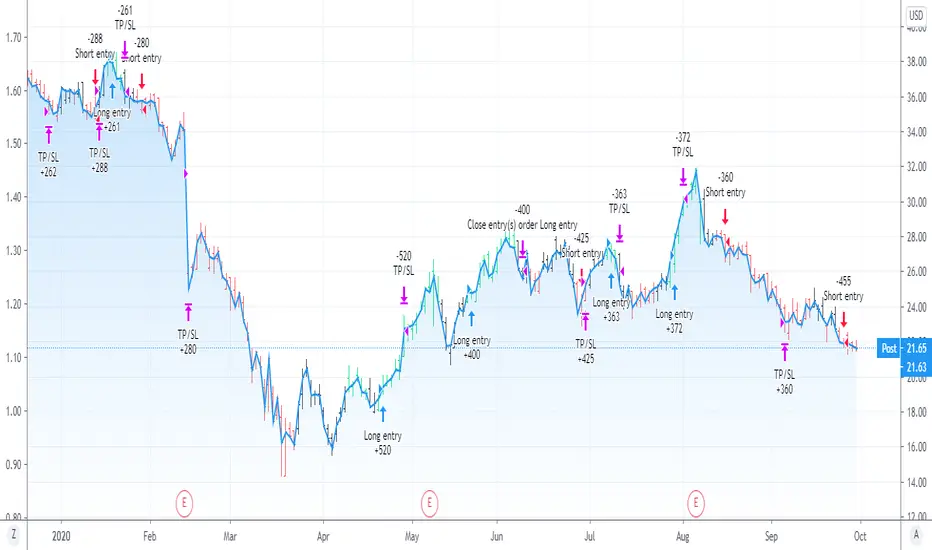
[DS]Entry_Exit_TRADE.V01-StrategyThe proposal of this script is to show the possible trading points of BUY and SELL based on the 15-minute chart of the Nasdaq Future Index. The start point of the strategy was schedule for 2021/01/01 and until the time of this publication (2021/01/31), for 1 index contract the results presented area a Gross Profit of 2.97% with a Net Profit of 1.35%.
█ FEATURES
The indicator shows on the graph the position of the MACD and TSI indicators that are the places of strength among Buyers and Sellers.
It's possible to observe a sharp fall or rise in the price of these positions.
On the current candle, a label is displayed containing the value of the William %R Mod indicator, which will display the OverBought position (dark red) and OverSold position (dark green). The other colors like light red and green are the regions where the price makes the decision of which direction to go.
There are also other indicators:
a) The positions of the BUY (light green) and SELL areas (light red);
b) The label with the position of BUY (dark green) and SELL (dark red) with the line that connects these points;
c) DEMA 72 (orange);
d) EmaOchl4 in the color green for BULL and red for BEAR market;
e) Pivots high and low
f) Maximum (purple light) and minimum areas (blue light)
█ FUNCTIONS AND SETTINGS
The indicator uses the following functions:
(1) DEMA - Double Exponential Moving Average (08,17,34, 72)
(2) ema () - Exponential Moving Averge (72, ohlc4)
(3) plot()
(4) barcolor()
(5) cross()
(6) pivots ()
(7) William R% Md (OverBought = -7, OverSold=-93)
(8) Maximum and Minimum Value
(9) fill()
(10) macd () - Moving Average Convergence Divergence (Fast Lengt=12, Slow Length=26, Source=close, Signal Smoothing=9)
(11) tsi() - Trading Strenght Indicator==> Índice de Força Real ( IFR ) (Long Length=72, Short Length=17, Signal Length=17)
(12) Buy and Sell TRADE Points
█ PERFORMANCE AND ERRORS
The positions of BUY and SELL points are defined through the crossing of the Dema 34 candles with the Ema Ohcl4. As it is an indicator, it can present different positions from de market direction. Thus there is a need to observe the direction of the market in order to verify whether the indicate decision is really acceptable. The decision to BUY or SELL an asset must be well studied to avoid financial losses. The indicator will only help you in this decision, is your responsibility the decision of entering or leaving an asset.
█ THANKS TO
PineCoders for all they do, all the tools and help they provide, and their involvement in making a better community. All the PineCoders, Pine Pros, and Pine Wizards, people who share their work and knowledge for the sake of it and helping others, I'm very happy and grate full indeed.
█ NOTE
If you have any suggestions for improving the script or need help using it, please send a message in the comments

KISS Strategy: SMA + EMA//Hello my fellow investors
//I am creating a simple non-cluttered strategy that uses 3(+1) simple means to determine: viability, entry, and exit
//1) Has a consistent trend been maintained for several days/weeks
//2) SH SMA crossover LG SMA = Bullish entry/LG SMA crossover SH SMA = Bearish entry
//3) Use the Slope factor & Weeks in Trend (WiT) to dertermine how strong of an entry signal you are comfortable with
//4) Exit position based on next SMA cross and trend reversal or stop loss%
//3+1) For added confidence in trend detection: Apply MACD check - buy--> MACD line above signal line and corssover below histogram \\ sell --> MACD line below signal line and crossover above histogram.
//*)This code also allows you to determine your desired backtesting date compliments of alanaster
The chart shown has:
Starting Capital: $10,000
Investment percent per trade: 1.5%
Stop Loss: 20%
Take Profit: 100%
Power X Strategy Back-testThis script back-test the Power X Strategy developed by Markus Heitkoetter and Rockwell Trading. For more detail about the strategy, please refer to "The PowerX Strategy: How to Trade Stocks and Options in Only 15 Minutes a Day" written by Markus Heitkoetter. Note that this script is not publish, develop or maintain by Rockwell Trading, and may have different results. Rockwell Trading has a powerful software called Power X Optimizer, which scan, back-test and optimize the best stock for the strategy.
The Power X Strategy uses RSI , Slow Stochastic and MACD indicators under the hood. When RSI and slow Stochastic are both greater than 50 and MACD crosses up the signal line, it marks as up-trend. If RSI and slow stochastic are both less than 50 and MACD crosses down the signal line, it marks as down-trend. Other are mark as no trend.
This back-test makes a long entry with an up-trend momentum and short entry with down-trend momentum. Trade is exited when profit target or stop lose is reach. Profit target and stop lose is calculated based on 7 days Average Daily Range (ADR).
If the either of the momentum is lost, trade is exited the next day. It also skips the entire month of March 2020, since the market crash and is not in a normal market condition for the strategy.
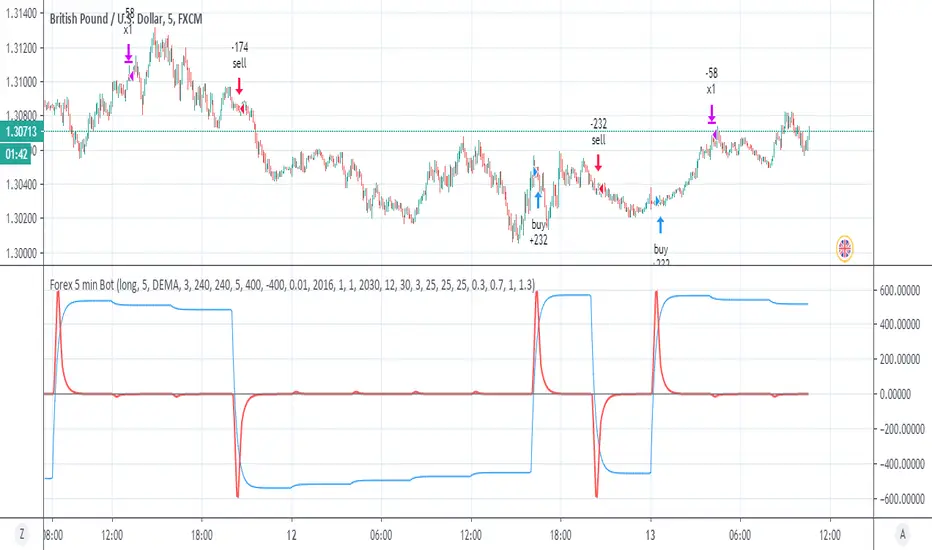
Forex 5 min BotBy request of freind made this bot for forex 5 min
it has 3 mode
non repaint at all (usless and not proftible) but no repaint at all:)
corected -attempt to correct some repaint
repainted -by using the method in ECG and MACD ECG
you can find detail explation about this there
here it the buy and sell are cross of close no repaint state(black line)
and the repaint state of the ECG bot model
and the brain is the MACD ECG model
there is peep take profit and stop lose +TS
you can try different options for this bot
I set it to forex 5 min chart on 4 hour MTF
the system is not free of some repaint that may exist
so my advice is to be coutios with this dodel and test it very before you decide to span mony on its decisions
for further detail please let me know either PM
or write bellow
so as the name imply it design for 5 min chart
if you want different chart you need to increase repaint control according to the candels
3 min=3
5min=5
15min=15
30min=30
45min=45
60min=60
choose any MTF you wish
the up and low have no meaning as we not use them like the ECG bot