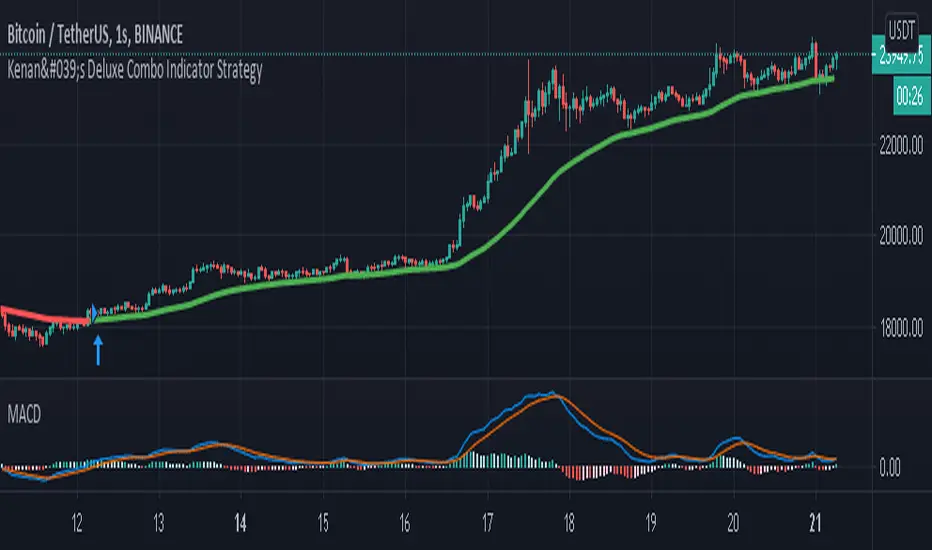
Kenan's Deluxe Combo Indicator StrategyThis is a combo strategy of sorts. I've been able to come up with this strategy after a lot of research.
Under Normal circumstances, when people look at dozens of indicators and they all signal, they open positions. So I decided to save people the trouble and put the major indicators together in a strategy.
All of the classic cross strategies usually give a lot of signal. Some of these signals are unnecessary and incorrect signals. Combining leading indicators. I tried to avoid the faulty signals.
Indicators and oscillators included in this strategy are:
1. Ema 5/13/21
2. Macd
3. Macd Dema
4. Ichimoku
5. Dmi
6. Stochastic
7. Aroon
8. Bollinger Band
9. Rsi
10. Chande Momentum Oscillator
11. Exponential Ease of Movement ( Eom )
12. Klinger Oscillator
13. Stochastic RSI
14. Ultimate Oscillator
15. Woodies CCI
16. Rate Of Change Lenght( Roc ) oscillator
17. WaveTrend Oscillator . It was created by @fskrypt.
18. Ehlers Adaptive CG Indicator . It was created by @LazyBear
19. Insync Index. It was created by @LazyBear
This script works by listening to the indicators and oscillators above. Opens new position after receiving signal verification signal from all
So how does this strategy close your position (optional).
1. You can close the position with the trailing stop option.
2. You can close the position according to the Rsi limits. To give an example. After a long position is opened, you can close the position after the rsi has risen above 70.
3. You can close the position according to the Bollinger Band . After a position is opened, you can close the position after the price moves out of the bollinger Band .
You can also change the values of indicators as desired. If you get better results. I would appreciate it if you could contact me via comment or private message.
I set the commission rate at 0.075 percent. If you want, you can change the settings yourself and make backtest.I changed the default settings for some indicators.
Recherche dans les scripts pour "macd"
PS3X Strategy TesterPS3X Strategy Tester is a completely new strategy built from the ground up as a successor to previous 1.0 and 2.0 versions of Profit Sniper.
Offering up huge improvements, including multiple position triggers, derived from Bollinger Bands and Chande Momentum as well as our own bespoke stochastic ribbons that provide trend pivots.
So how does it work?
PS3X Strategy Tester allows you to tailor your preference for waiting for either Stochastic Ribbon cross only, Ribbon Cross followed by Chande Confirmation, or Ribbon Cross followed by rising/falling MACD for additional market structure confidence.
Strategy exits can be configured to exit on % change of MACD histogram indicating a direction change, and additionally using our revolutionary "Profit Lockin" to provide a stepped lock in of profits according to your preferred risk strategy. Commision of 0.05% has been added to represent "limit in-market out" trading, but please tailor this again to your preferred trading approach.
If you would like access, please send me a PM.

BTC and ETH Long strategy - version 1I will start with a small introduction about myself. I'm now trading cryto currencies manually for almost 2 years. I decided to start after watching a documentary on the TV showing people who made big money during the Bitcoin pump which happened at the end of 2017.
The next day, I asked myself "Why should I not give it a try and learn how to trade".
This was in February 2018 and the price of Bitcoin was around 11500USD.
I didn't know how to trade. In fact, I didn't know the trading industry at all.
So, my first step into trading was to open an account with a broken. Then I directly bought 200$ worst of BTC . At that time, I saw the graph and thought "This can only go back in the upward direction!" :)
I didn't know anything about Stop loss, Take profit and Risk management.
Today, almost 2 years after, I think that I know how to trade and can also confirm that I still hold this bag of 200$ of bitcoin from 2018 :)
I did spend the 2 last years to learn technical analysis , risk management and leverage trading.
Today (14/05/2020), I know what I'm doing and I'm happy to see that the 2 last years have been positive in terms of gains. Of course, I did not make crazy money with my saving but at least I made more than if I would have kept it in my bank account.
Even if I like trading, I have a full time job which requires my full energy and lots of focus, so, the biggest problem I had is that I didn't have enough time to look at the charts.
Also, I realized that sometimes, neither technical analysis , nor fundamentals worked with crypto currency (at least for short time trading). So, as I have a developer background I decided to try to have a look at algo trading.
The goal for me was neither to make complex algos nor to beat the market but just to automate my trading with simple bot catching the big waves.
I then started to take a look at TV pine script and played with it.
I did my first LONG script in February 2020 to Long the BTC Market. It has some limitations but works well enough for me for the time being. Even if the real trades will bring me half of what the back testing shows, this will still be a lot more than what I was used to win during the last 2 years with my manual trading.
So, here we are! Below you will find some details about my first LONG script. I'm happy to share it with you.
Feel free to play with it, give your comments and bring improvements to it.
But please note that it only works fine with the candle size and crypto pair that I have mentioned below. If you use other settings this algo might loose money!
- Crypto pairs : XBTUSD and ETHXBT
- Candle size: 2 Hours
- Indicator used: Volatility , MACD (12, 26, 7), SMA (100), SMA (200), EMA (20)
- Default StopLoss: -1.5%
- Entry in position if: Volatility < 2%
AND MACD moving up
AND AME (20) moving up
AND SMA (100) moving up
AND SMA (200) moving up
AND EMA (20) > SAM (100)
AND SMA (100) > SMA (200)
- Exit the postion if: Stoploss is reached
OR EMA (20) crossUnder SMA (100)
Here is a summary of the results for this script:
XBTUSD : 01/01/2019 --> 14/05/2020 = +107%
ETHXBT : 01/01/2019 --> 14/05/2020 = +39%
ETHUSD : 01/01/2019 --> 14/05/2020 = +112%
It is far away from being perfect. There are still plenty of things which can be done to improve it but I just wanted to share it :) .
Enjoy playing with it....

inwCoin Martingale Strategy ( for Bitcoin )** Same as my previous martingale script but this version = opensource **
inwCoin Martingale Strategy is the proof of concept strategy that in the end, anyone who using martingale strategy will kaboom their portfolio.
For those who don't know what is "martingale".. it's a simple double down strategy in the hope to cover the loss in previous entry.
Example
In the game that if you win, you'll get 100% of your bet money back.
1st loss = 1$
2nd loss = bet 2$ : if win, get 2$ / real profit = 1$ ( 2-1 )
3rd loss = bet 4$ : if win, get 4$ / real profit = 1$ ( 4 - ( 2+1) )
4th loss = bet 8$ : if win, get 8$ / real profit = 1$ ( 8 - ( 4+2+1 ) )
...
...
10th loss = bet 512$ : if win, get 512$ / real profit = 1$ ( 512 - ( 256+128+64+32+16+8+4+2+1) )
as you can see, the next bet will be first bet x 2^(n-1)
and the profit will equal to your first bet.
==================
In trading and forex EA ( Expert Advisor or bot ) people use this strategy to fool newbies that their martingale system will generate steady income for eternity.
But in reality, this strategy will destroy your whole portfolio eventually some time in the future. Because there will be some "Blackswan event" in market at some point in time. And one who ignore this fact, will lose everything.
But, if you using low risk strategy and generate some profit from your low-risk portfolio. You can take small chunk of that profit and put it in riskier strategy like this martingale, to accerelate your profit snowball.
===================
Parameter Explaination
====================
Price = datasource for indicator calculation
Fixed position size option = if uncheck, the "Start position size" parameter will be % of your initial capital. If checked, it will fixed position size ( like 1 BTC )
Start Position Logic = condition to enter first trade
- MACD singal > 0 : Self explanatory, default macd value
- Stochastic RSI cross up : enter when sto line cross up from bottom ( 20 )
- ATR channel : enter trade if price cross above 2.3 ATR
Take Profit Percent = take profit target % from average entry
Start martingale ..= if price compare to average position entry less than this %, it will start to double down ( martingale )
Martingale Multiplier = you can specific how big you'll double down, default is 2
Trade Direction = long only for now
Use date rang = self explanatory
** make sure to setup your initial capital in properties tab **
On chart
=======
White Line = Average position price
Orange Line = your current equity
If equity less than 0, it will close any remaining positions ( It's mean your position got liquidated )
If price > equity line for "take profit percent" it will close any remaining positions.
=======
As you can see, this strategy survive 2018 drop and pump profit to 1000+% ( Check in the strategy tester tab > list of trades )
But in May 2020 -50% drop in just 3 days, your whole portfolio got liquidated.
Actually, after some digging in profit and backtest result.
This strategy, when it can survive a shape drop, can generate a lot of profit.
So, if you want to use martingale. Make sure to use only small chunk of your profit from "low-risk" strategy to accelerate your profit generation ( aka degen port )
DO NOT greedy and use all of your initial capital or borrowed money to use with this strategy!

BT Profit Sniper 3.0BT Profit Sniper 3.0 is a completely new strategy built from the ground up as a successor to previous 1.0 and 2.0 versions of Profit Sniper.
Offering up huge improvements, including multiple position triggers, derived from Bollinger Bands and Chande Momentum as well as our own bespoke stochastic ribbons that provide trend pivots . Another big decision was to remove the MACD from the indicator package, as invariably users preferred using the built-in MACD .
So how does it work?
3.0 operates off two timeframes in parallel, your Trend Timeframe (Higher Timeframe concerned with identifying market up & down trends), and your Trade Timeframe (Lower Timeframe to actually backtest Longs & Shorts in).
Within each timeframe, you can tailor your preference for waiting for either Stochastic Ribbon cross only, or Ribbon Cross followed by Chande Confirmation for that additional market structure confidence.
You also have the option to trade with trend so the indicator will automatically flag & alert only Shorts in a Short trend, and Longs in a Long Trend.
User parameters allow traders to add trailing stop, toggle between percentage and USD value, providing higher accuracy in the forecast rate.
If you would like access, please send me a PM.

Profit Sniper 2.0 | BACKTESTProfit Sniper 2.0 Backtest now offering up huge improvements, including multiple position triggers, derived from Bollinger Bands and Chande Momentum as well as our own bespoke stochastic ribbons that provide trend pivots .
Profit Sniper now works with regular Japanese candles, however, still provides the flexibility of Heiken Ashi settings for certain elements of the indicator, this allows the accuracy of Japanese candlestick prices, and the smooth trends of HA.
Profit Sniper 2.0 has been specifically re-written for use with automation, including our own in-house trading robot known as C.A.T (Crypto Algo Trader) and as such we have chosen to remove several noisy elements of the now defunct Profit Sniper that were underused, such as the PPO and RSI variants.
Another big decision was to remove the MACD from the indicator package, as invariably users preferred using the built in MACD .
So how does it work?
HUNT
In true Sniper fashion, when our stochastic HA ribbons pivot between short and long trends, the indicator will offer up a colour coded flag the says “1. HUNT” green for long, red for short.
SIGHT
At this stage, the indicator is now looking for a second condition, this is displayed as “2. Sight” at this point the indicator as noticed a drop in the previous momentum, to pre-empt a flip between long and short. Red is for short, green is for Long
FIRE
The final condition to be met, is based on the positioning of the Bollinger Bands , which is show as the “3. Fire Flag” again, as with hunt and sight, red is for short and green is for long.
User parameters allow traders to add trailing stop, toggle between percentage and USD value, as well as edit all the indicator settings in both HA and JPY Candles providing higher accuracy in the forecast rate.
** Please note, that trade execution occurs at the open of the candle after the FIRE condition is met, this means that it is likely that the back test may throw up slightly worse results than in real time trading with using CAT as CAT will execute on Bollinger moving average line in real time.

inwCoin ActionZone - Ignore first red StrategyinwCoin Action Zone Ignore 1st Red Candle Strategy.
Description : Action Zone is easier version of painting MACD on the chart.
If MACD signal line above zero = bar will become Green = buy signal
If MACD signal line under zero = bar will become Red = sell signal
This alteration is just a proof of concept to answer these questions;
* What will happen if we just ignore the first red bar after we just enter position?
* If red bar is between entry price and stop loss price, we'll not sell the position.
* We'll sell when red bar is above entry price and stop loss price only.
* We'll also stop loss if price drop below previous high
* We can avoid the false signal by just holding position until we get stop out... is it worth? ( Compare with regular Action Zone strategy )
The Result ;
* Some assets gave better backtest result with this tweak strategy.
* But some assets perform worse than original action zone...
* After tried with Thai Stock, this strategy is no match with the original action zone.
Conclusion;
* You can try this strategy to see the result by yourself.
========================
inwCoin Action Zone Ignore 1st Red Candle Strategy ( ชื่อยาวไปไหน )
ก็ไม่มีอะไรมากครับ เอา Action Zone ตัวธรรมดามาทดสอบคอนเซ็ปที่ลุงโฉลกได้สอนไว้ ว่า
" ถ้า Action Zone เขียว แล้วแดงแรก ให้เราไม่สนมันไปก่อน"
ผมก็เลยลองเขียน backtest ขึ้นมาดู เพราะอยากรู้ว่า วิธีนี้มันจะเวิร์คหรือไม่เวิร์ค
หลังจากลองทดสอบกับ หุ้นไทย จำนวน 200 กว่าตัว ก็พบว่า...
วิธีนี้ ยังไงก็ยังได้ผลกำไรแพ้ Action Zone Quick Exit ครับ
คือมันจะมีบางตัวนะ ที่ได้กำไร ชนะ Action Zone ธรรมดา แต่หลายๆ ตัว และส่วนใหญ่ด้วย ที่ขาดทุนแล้ว ขาดทุนหนัก
ตอนนี้ ถ้าให้พูดตรงๆ ตัวกลยุทธ inwCoin Break Previous High ยังให้ผลโดยรวม ที่ค่อนข้างดีอยู่ครับ
ใครอยากเอาไปลองเล่น ก็ลองไปใส่กราฟดูได้ครับ

Zulu Kilo 4HR Strategy - LIVE BETA TESTING***MANDATORY READING SO YOU DONT LOSE MONEY ON A POSITION***
I will be posting a video soon on my TV channel to explain exactly what you're about to read below so you can visually understand the process.
PLEASE NOTE THE FOLLOWING IMPORTANT CONDITIONS:
-The script DOES repaint since it looks for specific EMA conditions to meet position thresholds so there are some implications that MUST be observed BEFORE entering into a position.
-This script MUST be used in conjunction with at minimum 3 other indicators before entering the position it calls for you to enter, OR exiting a currently held position. Details on the bottom.
-The 3 recommended indicators that MUST be used in conjunction to verify position entry are: MACD, RSI and STOCH indicators.
-Do NOT change any of the settings in the script as it will not indicate the correct divergence/convergence for when to look for opening a position.
The three indicators I recommend in conjunction are all FREE indicators available openly on Tradingview Indicators:
(PLEASE NOTE THAT THE BELOW INDICATORS ARE NOT MINE, I GIVE ALL CREDIT TO THEIR ORIGINAL PUBLISHERS. THEY ARE *NOT* PART OF THIS SCRIPT.)
1) "Smooth Chande Trend Score w/ Signal line by CryptoRythms" (This is a volume weighed MACD indicator that shows convergence and divergence)
2) "STOCH_VX3" (This is a really smart and useful Stochastic indicator)
3) "CM_RSI Plus EMA" (This is an RSI trend indicator with an EMA reference line for added clarity of trend direction)
How to correctly use the Zulu Kilo indicator:
1) The time frame it is encoded for is the 4 hour time frame and that is what MUST be used to correctly identify a potential position entry/exit.
2) Getting into an initial position (when NOT currently in any position):
TWO OPTIONS:
A) ENTER INTO AN EXISTING SIGNAL
-IF indicator is showing an existing SHORT entry, the 3 other indicators must ALL be aligned crossing DOWN or trending downwards.
-IF indicator is showing a LONG entry, the 3 other indicators must ALL be aligned crossing UP or trending upwards.
B) ENTER INTO NEXT SIGNAL GENERATED
-Wait for indicator to generate a Short/Long position on a candle, DO NOT enter into that position until ALL 3 bottom indicators converge to pointing up (for a Long entry), or pointing down (for a Short entry).
-VERY IMPORTANT: It is NOT enough for the 3 bottom indicators to cross into a buy/sell until that 4 hr candle has closed with all 3 indicators trending up (for long) or trending down (for Short).
-I REPEAT **DO NOT** get into the indicated long/short position until the 4 hr candle has closed on the bottom three indicators as crossing up or down. There will be numerous times where on current 4hr candle, the 3 bottom indicators will cross into a buy/sell signal. That 4hr candle's price action CAN change until the current 4hr candle closes. IT IS NOT ENOUGH to get into any position indicated by my indicator unless the current 4hr candle where the bottom 3 indicators converge/cross up or down CLOSES the candle.
3) Exiting a position (Taking profit and entering new position):
-If you are in an existing position, please note that fake Long/Sell signals will be generated by the script. So when do you take profit from current position and enter the next position?
Scenario:
You are currently in a LONG position. Price goes up, there is price consolidation happening and a SHORT signal is generated. DO NOT immediately take profit and close your existing Long position yet. Unless, ALL 3 bottom indicators converge and cross downwards AFTER the current 4hr candle is confirmed, you will stay in your long position. You will ONLY exit and take profit / Stop Loss from your LONG position and go into a SHORT is when all 3 bottom indicators cross downwards on a 4hr candle close and confirm pointing/crossing down.
The exact inverse if you're in a SHORT position... If a LONG pops up while in a SHORT position, do NOT exit the SHORT immediately. Only exit the short, take profit, and then enter a long if all three indicators close on a 4hr candle where the 3 indicators are crossing up. If that does not happen, the long signal will disappear eventually, and you continue in the short position until another LONG signal pops up, repeat the same process.
***VERY IMPORTANT***
I cannot stress this enough!
I need all of the strategy followers to understand that the ONLY way you would ever enter into a signaled position is when a 4hr candle closes where the bottom 3 indicators are ALL crossing/pointing up (for a LONG) or ALL crossing/pointing down (for a SHORT).

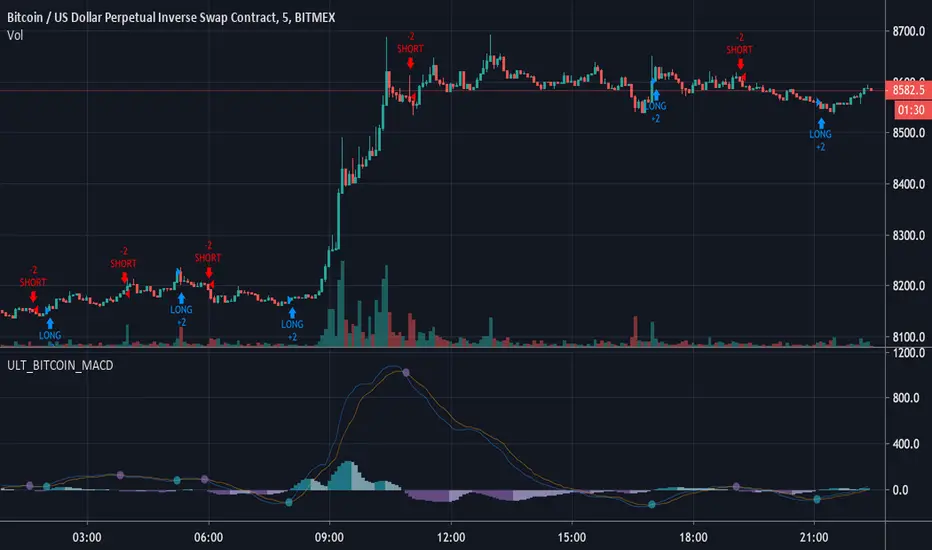
ULT_BITCOIN_MACDUltimate Bitcoin MACD aggregates macd, signal, and histograms across all USD bitcoin exchanges. The result is the most accurate look at bitcoin price action.
WARNING:
1. can have long load times to aggregate data
2. Only functional on USD based bitcoin assets
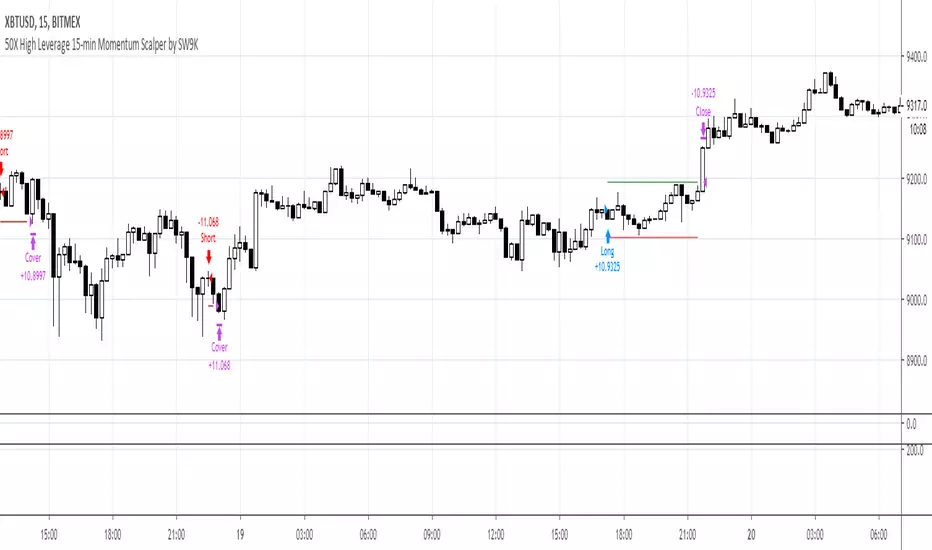
15MEX Momentum ScalperAlpha product project in development. Uses a combination of MACD and T3-CCI with tweaked settings to catch directional momentum and scalp a small move. Strategy is quantity of trades over quality of trades to build profits.
Use this strategy for 15-min Bitmex scalping on XBT contracts only. Recommend 100k contract size or less; backtested with 100k contracts.
Market enter, then use post-only limit exits and stop losses.
Setting is pre-optimized for 0.5% tp target and 0.5% sl of entry price. Recommend default 3 bars as basis for confirming recent MACD crossover as well as default 0.618 Fibonacci ratio as the T3-CCI basis.
Default risk level setting is approximately 2-3 trades a day. You can double the amount to 4-5 trades a day by enabling Aggressive mode. This may lead to larger profits and more entries, but with more frequent stop losses.
Future version will include trailing TPs/stops. Still undergoing optimization and refinement.
Vortex Ocillator - backtestingbacktesting strategy for the vortex oscilator indicator, slightly modified on this version so that the buy and sell signals work with the backtesting and are consistant
original idea i posted by accident
the script with alerts
not intended to be financial advice, strategy is for made for testing
Biffy

I AM Div3rgentIchimuko+MACD+William+CCi+Bollinger+4EMA,4SMA +ATR +pivot + strategy
When background is green William or cci or BOTH are under their boundaries (Good to Buy)
When background is red William or cci or BOTH are over their boundaries (Good to sell)
When Macd strategy tell u can buy
When it says close u can sell
Use ichimuko it is the best trend analyzer
U also can use EMA & SMA And ATR in option(touch Setting bottom)
,...
Hope u all EnJoY

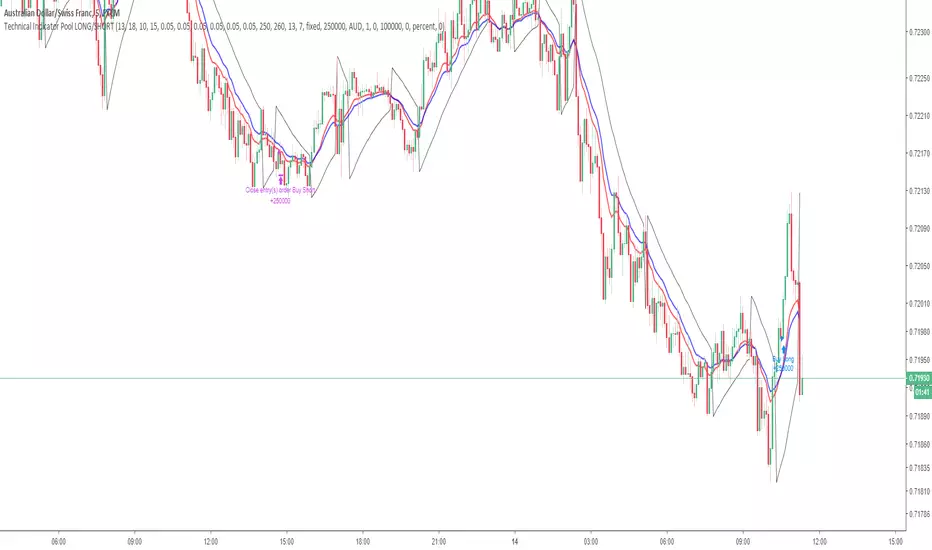
Technical Indicator PoolThis is for Bundle holders who want to use the Technical Indicator Pool for scalping binary options.
Understanding the Technical Indicator Pool
The Technical Indicator Pool is a strategy that operates on the premise that when many technical indicators project the same sentiment, they are concurrently more precise. The technical indicator pool contains five indicators
1. Small MACD Moving Average (SFMA) (10,15)
2. Large MACD Moving Average (LFMA) (13,18)
3. Parabolic Stop and Reverse (PSAR) (0.05, 0.05, 0.05)
4. Relative Strength Index (RSI) (14, 70, 30)
5. H/L Pivot (13)
When all five indicators project the same sentiment within a defined period (known as BarPeriod), an order is placed in the direction of sentiment.
Note:
Due to the nature of the indicator pool, such as the moving averages within the MACD and RSI as well as the High/Low Pivot, false positives may occur before the bar has closed within the time stamp.
This point of reference is to be used in combination with an arsenal of trading tools and should not be used as direct investment advice.
Option strategies should always include stop losses.
This strategy operates using a lot size of 2.5.
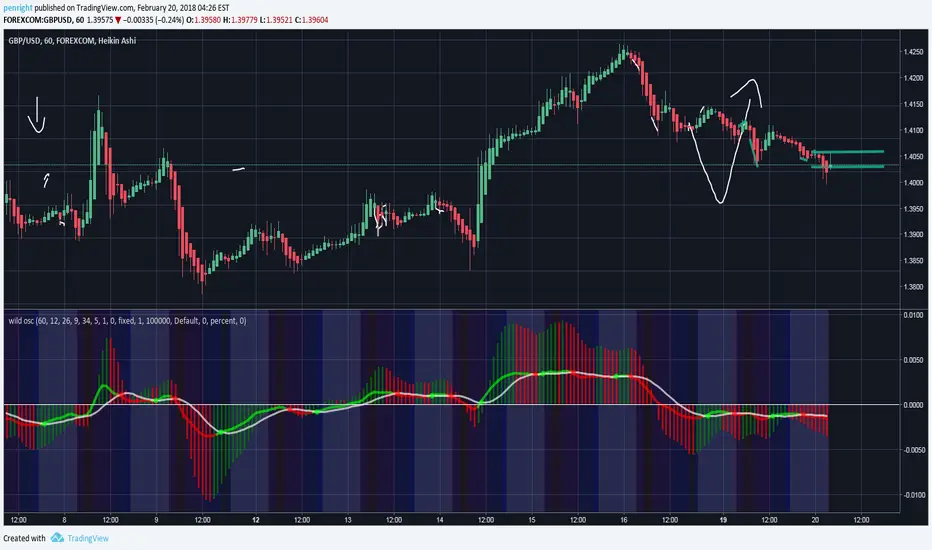
Petes Wild OscillatorThis oscillator is a combo if different goodies i find useful (Maybe you will too) This is a color changing MACD combined with the Awesome Oscillator and also shows the colored sessions as well (Like London session, Asain, NY and Aussie) All MACD and session settings can be changed in the Format tab. I also writtin a decent strategy script for this as well but wanna see if people find it useful before i post garbage lol. I also had colored bars based on if CCI was over 0 but i took it out as this is just a oscillator. Any feedback is always welcomed!
Cowabunga System from babypips.comPlease do read the information below as well, especially if you are new to Forex.
The Cowabunga System is a type of Mechanical Trading System that filters trades based on the trend of the 4 hour chart with EMAs and some other familiar indicators (RSI, Stochastics and MACD) while entering trades base on 15 minute chart.
I have coded (quite amateurishly) the basic system onto a 15 minute chart (the 4 hour settings are coded as well). The author says the system is to be traded off the 15 minute chart with the 4 hour chart only as a reference for trend direction.
4 Hour Chart Settings
5 EMA
10 EMA
Stochastics (10,3,3)
RSI (9)
Then we move onto the 15 minute chart, where he gives us the trade entry rules.
15 Minute Chart Settings
5 EMA
10 EMA
Stochastics (10,3,3)
RSI (9)
MACD (12,26,9)
Entry Rules - long entry rules used, obviously reverse these for shorting.
1. EMA must cross above the 10 EMA.
2. RSI must be greater than 50 and not overbought.
3. Stochastic must be headed up and not be in overbought territory.
4. MACD histogram must go from negative to positive OR be negative and start to increase in value.
What I did.
1. Set the RSI and Stochastic levels to avoid entries when they indicate overbought conditions for long and oversold conditions for short (80 and 20 levels).
2. Users can input specific times they want to backtest.
3. User's can configure profit targets, trailing stops and stops. Default is set it to was 100 pips profit target with a 40 pip trailing stop. (Note, when you are changing these values, please note that each pip is worth 10, so 100 pips is entered as 1000.)
The Cowabunga System from babypips.com is another popular and active system. The author, Pip Surfer, continues to post wins and losses with this system. It shows there is a lot of honesty and integrity with this system if the author keeps up to date even 10 years later and is not afraid of sharing the times the system causes losses.
As an example of this, here is post he shared just last week . It's almost like a journal, he gives specific times and reasons why he entered, lets the readers know when he was stopped out, etc. I think that what he does is equally important as his system.
To read more about this system, visit the thread on babypips.com, click here.

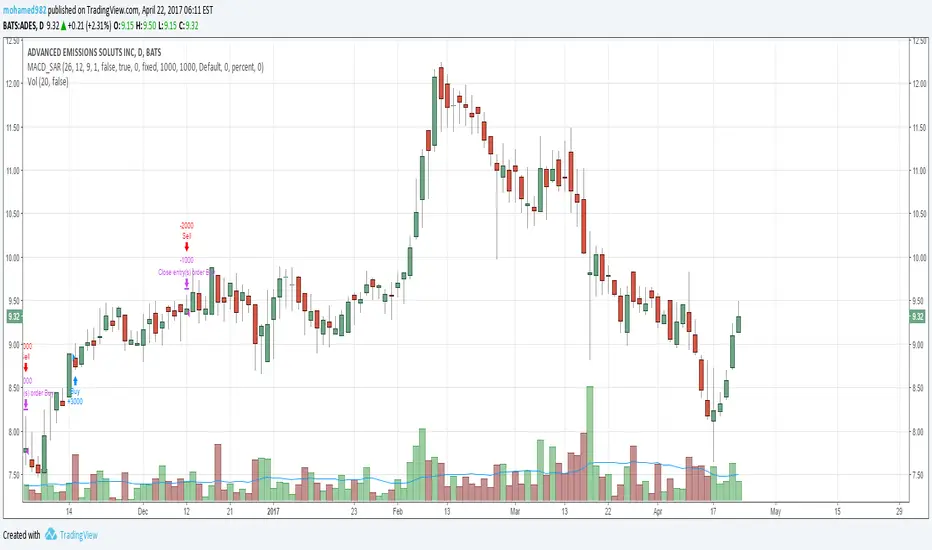
MACD_SARParSar and MACD strategy depends on the crosses of PARSAR indicator above/below the closing price and is filtered by the MACD indicator. it yields good profits on stocks. however, it doesn't work very well for Forex if you want to use it on forex please apply it to higher time frame starting from 4H.
Penguin Volatility State StrategyThe Penguin Volatility State Strategy is a comprehensive technical analysis framework designed to identify the underlying "state" or "regime" of the market. Instead of just providing simple buy or sell signals, its primary goal is to classify the market into one of four distinct states by combining trend, momentum, and volatility analysis.
The core idea is to trade only when these three elements align, focusing on periods of volatility expansion (a "squeeze breakout") that occur in the direction of a confirmed trend and are supported by strong momentum.
Key Components
The strategy is built upon two main engines
The Volatility Engine (Bollinger Bands vs. Keltner Channels)
This engine detects periods of rapidly increasing volatility. It measures the percentage difference (diff) between the upper bands of Bollinger Bands (which are based on standard deviation) and Keltner Channels (based on Average True Range). During a volatility "squeeze," both bands are close. When price breaks out, the Bollinger Band expands much faster than the Keltner Channel, causing the diff value to become positive. A positive diff signals a volatility breakout, which is the moment the strategy becomes active.
The Trend & Momentum Engine (Multi-EMA System)
This engine determines the market's direction and strength. It uses:
A Fast EMA (e.g., 12-period) and a Slow EMA (e.g., 26-period): The crossover of these two moving averages defines the primary, underlying trend (similar to a MACD).
An Ultra-Fast EMA (e.g., 2-period of ohlc4): This is used to measure the immediate, short-term momentum of the price.
The Four Market States
By combining the Trend and Momentum engines, the strategy categorizes the market into four visually distinct states, represented by the chart's background color. This is the most crucial aspect of the system.
💚 Green State: Strong Bullish
The primary trend is UP (Fast EMA > Slow EMA) AND the immediate momentum is STRONG (Price > Fast EMA).
Interpretation: This represents a healthy, robust uptrend where both the underlying trend and short-term price action are aligned. It is considered the safest condition for taking long positions.
❤️ Red State: Strong Bearish
Condition: The primary trend is DOWN (Fast EMA < Slow EMA) AND the immediate momentum is WEAK (Price < Fast EMA).
Interpretation: This represents a strong, confirmed downtrend. It is considered the safest condition for taking short positions.
💛 Yellow State: Weakening Bullish / Pullback
Condition: The primary trend is UP (Fast EMA > Slow EMA) BUT the immediate momentum is WEAK (Price < Fast EMA).
Interpretation: This is a critical warning signal for bulls. While the larger trend is still up, the short-term price action is showing weakness. This could be a minor pullback, a period of consolidation, or the very beginning of a trend reversal. Caution is advised.
💙 Blue State: Weakening Bearish / Relief Rally
Condition: The primary trend is DOWN (Fast EMA < Slow EMA) BUT the immediate momentum is STRONG (Price > Fast EMA).
Interpretation: This signals that a downtrend is losing steam. It often represents a short-covering rally (a "bear market rally") or the first potential sign of a market bottom. Bears should be cautious and consider taking profits.
How the Strategy Functions
The strategy uses these four states as its foundation for making trading decisions. The entry and exit arrows (Long, Short, Close) are generated based on a set of rules that can be customized by the user. For instance, a trader can configure the strategy to
Only take long trades during the Green State.
Require a confirmed volatility breakout (diff > 0) before entering a trade.
Use the "RSI on Diff" indicator to ensure that the breakout is supported by accelerating momentum.
Summary
In essence, the Penguin Volatility State Strategy provides a powerful "dashboard" for viewing the market. It moves beyond simple indicators to offer a contextual understanding of price action. By waiting for the alignment of Trend (the State), Volatility (the Breakout), and Momentum (the Acceleration), it helps traders to identify higher-probability setups and, just as importantly, to know when it is better to stay out of the market.
License / disclaimer
© waranyu.trkm — MIT License. Educational use only; not financial advice.

AI-JX Strategy### 🤖 Core Features
AI-JX v3.3 is an AI-powered comprehensive trading strategy system developed with PineScript v6, integrating multiple advanced technical analysis tools and machine learning algorithms.
### 📊 Main Functional Modules 1. AI Learning System
- Adaptive Parameter Optimization : Automatically learns and adjusts trading parameters
- Three Strategy Modes : Conservative (ranging markets), Aggressive (trending markets), Balanced (universal)
- Dynamic Weight Adjustment : Intelligently allocates weights to different strategies based on market conditions
- Learning Memory Mechanism : Records historical trading data for continuous strategy optimization 2. Technical Indicator System
- SuperTrend Indicator : ATR-based trend following system
- Heikin Ashi Smoothing : Reduces market noise for clearer trend signals
- Standard Deviation Channels : Multi-level support and resistance analysis
- Trend Distribution Profile : Visualizes price distribution and trend strength
- Multi-Timeframe Analysis : Comprehensive analysis across 5m, 15m, and 1h timeframes 3. Intelligent Signal Generation
- Traditional Signals : Classic buy/sell signals based on SuperTrend
- AI Smart Signals : Comprehensive scoring system combining RSI, MACD, and ATR
- False Breakout Detection : Identifies and filters fake breakout signals
- Price Confirmation Mechanism : Ensures signal validity and reliability 4. Risk Management System
- Dynamic Stop Loss/Take Profit : Long 3% TP/1.5% SL, Short 2:1 risk-reward ratio
- Slippage Monitoring : Real-time market slippage risk assessment
- Volatility Filtering : Adjusts trading strategy based on ATR
- Position Management : Smart capital allocation and risk control 5. Visualization Panels
- Statistics Panel : Displays key data like trade count, win rate, current strategy
- AI Learning Panel : Shows strategy weights and learning progress
- Prediction Panel : Real-time AI analysis and trading recommendations
- Chart Markers : Clear buy/sell signals and trend line displays 6. Alert System
- Multiple Alert Types : Buy, sell, take profit, and stop loss notifications
- Personalized Messages : Fun "WangWang" themed alert messages
- Real-time Notifications : Precise alerts with maximum one per bar frequency
### 🎯 Key Advantages
- AI-Driven : Machine learning optimization for better performance
- Multi-Strategy : Adapts to different market conditions automatically
- Risk-Controlled : Comprehensive risk management with dynamic adjustments
- User-Friendly : Intuitive interface with detailed visualization panels
- Highly Customizable : Extensive parameter settings for different trading styles

Gann Fan Strategy [KedarArc Quant]Description
A single-concept, rule-based strategy that trades around a programmatic Gann Fan.
It anchors to a swing (or a manual point), builds 1×1 and related fan lines numerically, and triggers entries when price interacts with the 1×1 (breakout or bounce). Management is done entirely with the fan structure (next/previous line) plus optional ATR trailing.
What TV indicators are used
* Pivots: `ta.pivothigh/ta.pivotlow` to confirm swing highs/lows for anchor selection.
* ATR: `ta.atr` only to scale the 1×1 slope (optional) and for an optional trailing stop.
* EMA: `ta.ema` as a trend filter (e.g., only long above the EMA, short below).
No RSI/MACD/Stoch/Heikin/etc. The logic is one coherent framework: Gann price–time geometry, with ATR as a scale and EMA as a risk filter.
How it works
1. Anchor
* Auto: chooses the most recent *confirmed* pivot (you control Left/Right).
* Manual: set a price and bar index and the fan will hold that point (no re-anchoring).
* Optional Re-anchor when a newer pivot confirms.
2. 1×1 Slope (numeric, not cosmetic)
* ATR mode: `1×1 = ATR(Length) × Multiplier` (adapts to volatility).
* Fixed mode: `ticks per bar` (constant slope).
Because slope is numeric, it doesn’t change with chart zoom, unlike the drawing tool.
3. Fan Lines
Builds classic ratios around the 1×1: 1/8, 1/4, 1/3, 1/2, 1/1, 2/1, 3/1, 4/1, 8/1.
4. Signals
* Breakout: cross of price over/under the 1×1 in the EMA-aligned direction.
* Bounce (optional): touch + reversal across the 1×1 to reduce whipsaw.
5. Exits & Risk
* Take-profit at the next fan line; Stop at the previous fan line.
* If a level is missing (right after re-anchor), a fallback Risk-Reward (RR) is used.
* Optional ATR trailing stop.
Why this is unique
* True numeric fan: The 1×1 slope is calculated from ATR or fixed ticks—not from screen geometry—so it is scale-invariant and reproducible across users/timeframes.
* Deterministic anchor logic: Uses confirmed pivots (with your L/R settings). No look-ahead; anchors update only when the right bars complete.
* Fan-native trade management: Both entries and exits come from the fan structure itself (with a minimal ATR/EMA assist), keeping the method pure.
* Two entry archetypes: Breakout for momentum days; Bounce for range days—switchable without changing the core model.
* Manual mode: Lock a session’s bias by anchoring to a chosen swing (e.g., day’s first major low/high) and keep the fan constant all day.
Inputs (quick guide)
* Auto Anchor (Left/Right): pivot sensitivity. Higher values = fewer, stronger anchors.
* Re-anchor: refresh to newer pivots as they confirm.
* Manual Anchor Price / Bar Index: fixes the fan (turn Auto off).
* Scale 1×1 by ATR: on = adaptive; off = use ticks per bar.
* ATR Length / ATR Multiplier: controls adaptive slope; start around 14 / 0.25–0.35.
* Ticks per bar: exact fixed slope (match a hand-drawn fan by computing slope ÷ mintick).
* EMA Trend Filter: e.g., 50–100; trades only in EMA direction.
* Use Bounce: require touch + reverse across 1×1 (helps in chop).
* TP/SL at fan lines; Fallback RR for missing levels; ATR Trailing Stop optional.
* Transparency/Plot EMA: visual preferences.
Tips
* Range days: larger pivots (L/R 8–12), Bounce ON, ATR Multiplier \~0.30–0.40, EMA 100.
* Trend days: L/R 5–6, Breakout, Multiplier \~0.20–0.30, EMA 50, ATR trail 1.0–1.5.
* Match the TV Gann Fan drawing: turn ATR scale OFF, set ticks per bar = `(Δprice between anchor and 1×1 target) / (bars) / mintick`.
Repainting & testing notes
* Pivots require Right bars to confirm; anchors are set after confirmation (no look-ahead).
* Signals use the current bar close with TradingView strategy mechanics; real-time vs. bar-close can differ slightly, as with any strategy.
* Re-anchoring legitimately moves the structure when new pivots confirm—by design.
⚠️ Disclaimer
This script is provided for educational purposes only.
Past performance does not guarantee future results.
Trading involves risk, and users should exercise caution and use proper risk management when applying this strategy.

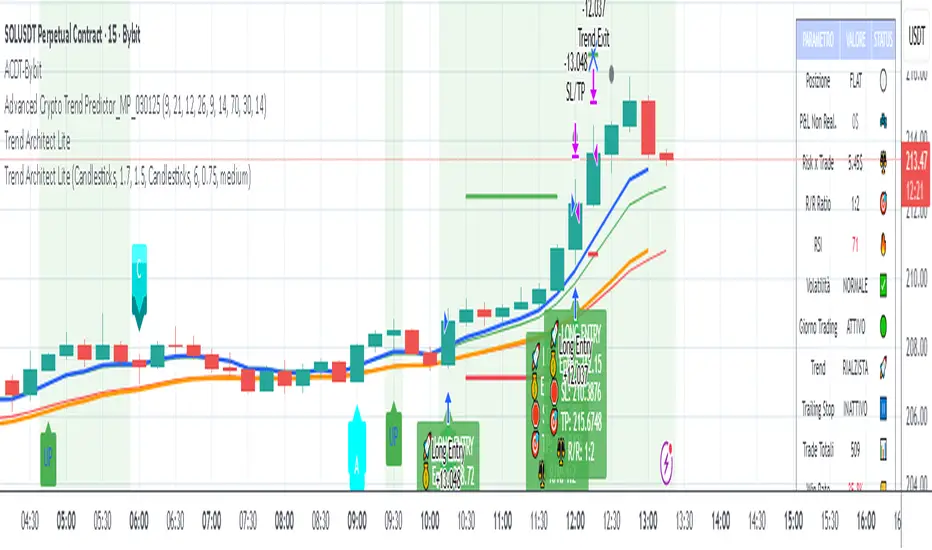
Advanced Crypto Day Trading - Bybit Optimized mapercivEMA RSI ATR MACD trading script strategy with filters for weekdays
Advanced MA Cross Strategy with ConfluenceOverview
A trend-following strategy that combines moving average crossovers with multiple technical confluence factors to identify high-probability long entries. This system is designed for traders seeking a disciplined, multi-faceted approach to market analysis with built-in risk management.
Core Strategy Logic
The strategy generates buy signals when a fast moving average crosses above a slow moving average, but only when multiple technical conditions align simultaneously. This confluence-based approach significantly reduces false signals and improves trade quality by ensuring multiple market dynamics support the directional bias.
Key Features
🎯 Multi-MA Support
5 Moving Average Types: EMA, SMA, WMA, HMA, VWMA
Customizable Periods: Flexible fast, slow, and trend filter lengths
Slope Validation: Ensures both MAs are trending upward before entry
📊 Seven-Point Confluence System
Volume Confirmation - Requires above-average trading volume
RSI Filter - Avoids overbought/oversold market conditions
MACD Alignment - Confirms momentum direction and strength
ADX Trend Strength - Validates trending market conditions
Bollinger Bands Position - Price positioning within volatility bands
Stochastic Momentum - Additional oscillator confirmation
Long-term Trend Filter - Ensures proper MA hierarchy (Fast > Slow > Trend)
🛡️ Advanced Risk Management
ATR-Based Dynamic Stops - Volatility-adjusted stop losses
Trailing Stop Logic - Protects profits as trades move favorably
Clear Exit Signals - Systematic position closure on MA cross-under
📈 Visual Intelligence
Real-Time Confluence Dashboard - Live monitoring of all filter conditions
Color-Coded Background - Visual confirmation when all factors align
Professional Signal Markers - Clear entry/exit visualization
MA Hierarchy Indicators - Trend structure validation
⚙️ Fully Customizable
Every parameter is user-adjustable, allowing traders to:
Modify MA lengths for different timeframes
Adjust confluence filter sensitivity
Customize risk management parameters
Enable/disable individual filters as needed
Strategy Advantages
✅ Reduced False Signals - Multiple confirmation layers filter out low-quality setups
✅ Trend Following - Designed to capture sustained directional moves
✅ Risk-Aware - Built-in stop loss and position sizing
✅ Transparent Logic - Real-time display of all decision factors
✅ Adaptable - Works across multiple timeframes and instruments
✅ Professional Grade - Institutional-quality technical analysis
Best Use Cases
Trending Markets: Excels in sustained directional price movements
Medium to Long-term Swing Trading: Optimized for multi-day to weekly holds
Risk-Conscious Trading: Ideal for traders prioritizing capital preservation
Educational Tool: Perfect for learning confluence-based analysis
Recommended Settings
Timeframes: 4H, Daily, Weekly for optimal signal quality
Instruments: Works on all liquid markets (Forex, Stocks, Crypto, Commodities)
Risk Management: 1-2% risk per trade recommended
Important Notes
⚠️ Long-Only Strategy: Designed specifically for upward price movements
⚠️ Confluence Dependent: All filters must align for signal generation
⚠️ Trending Market Bias: Performance may be limited in sideways markets
Disclaimer: This strategy is for educational and informational purposes only. Past performance does not guarantee future results. Always conduct your own analysis and consider your risk tolerance before trading.

MTF FVG Confluence v6 — JSON Alerts via alert()This strategy combines multi-timeframe confluence with candlestick analysis and fair value gaps (FVGs) to generate structured long/short entries. It aligns Daily and 4H EMA trends with 1H MACD momentum, then confirms with engulfing candles and FVG zones for precision entries. Risk management is built-in, featuring stop-loss, 3R take-profit targets, and optional break-even logic, with dynamic JSON alerts for webhook automation.
Categories:
Candlestick analysis
Chart patterns
Cycles

EMA MACD - 5-20Based on Crossover and Big timeframe EMA Support and resistance this strategy is developed.
