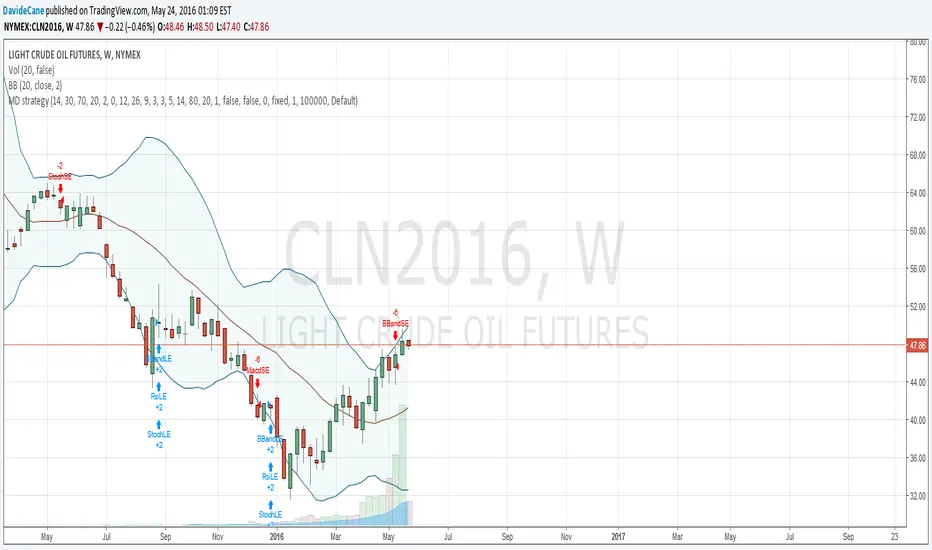
Multi-Indicator Entry/ExitMultiple indicator entry/exit strategy.
BBs wrapped around MACD, utilizing RSI & OBV as confirmations.
Recherche dans les scripts pour "macd"

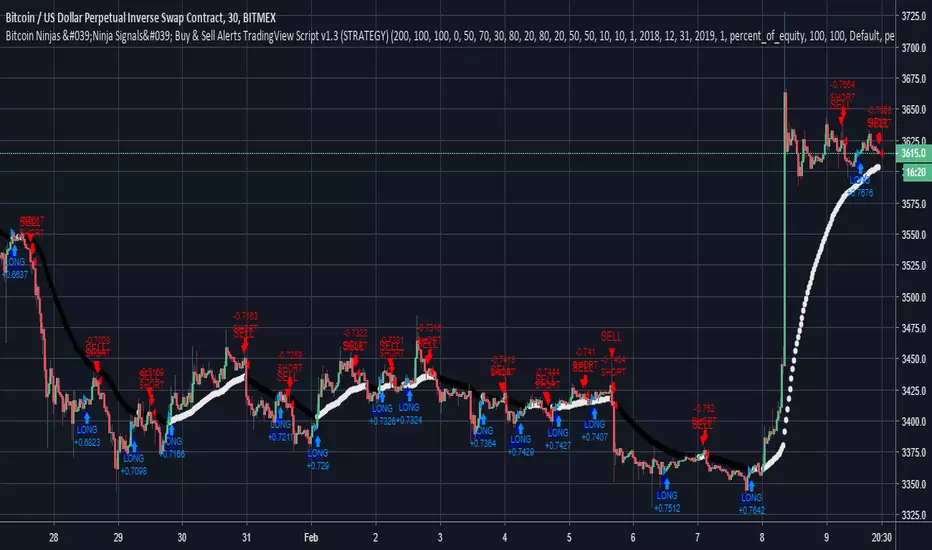
BitcoinNinjas Ninja Signals Buy Sell Alert Trading Strategy v2.0Bitcoin Ninjas 'Ninja Signals' Buy/Sell Alerts & Backtesting TradingView Script v2.0
(for Cryptocurrencies, Forex, GunBot, ProfitTrailer, automatic trading software, and more)
'Ninja Signals' v2.0 (SCRIPT)
'Ninja Signals' v2.0 (STRATEGY)
'Ninja Signals' v1.0 (SCRIPT)
'Ninja Signals' v1.0 (STRATEGY)
-Allows users to easily set automated buy and sell alerts on TradingView for use with automatic and manual trading of cryptocurrencies, Forex securities, and more (alerts are compatible with automatic trading software such as GunBot, ProfitTrailer, and more).
-Synthesizes many powerful indicators [e.g. Relative Strength Index (RSI), stochastic RSI, Money Flow Index (MFI), Moving Average Convergence Divergence (MACD), etc.) into one super script to generate very precise buy and sell signals in almost any market condition.
-Buy arrows (blue) and sell arrows (red) can be changed or hidden for ease of viewing.
-No lag EMA trendline featuring trend-reversal color-coding (white uptrend, black downtrend).
-Adjustable ‘calibration’ setting allows users to customize the script to work for any currency or security available through TradingView, on any exchange, simply by adjusting a number.
-Complete with backtesting strategy version of script which allows users to test various buy and sell strategies based on the alerts the script generates (see info and screenshots below).
-Backtesting strategy incorporates a user-defined adjustable date range, so users can estimate the script’s performance over specific periods of time, such as the last day, week, or month.
-Backtesting strategy utilizes a minimum protective gain setting to help you never sell for a loss. Simply adjust your minimum profit (%) per trade, and the test results will update.
-Backtesting strategy allows for pyramid buying to test various average down / double up buying strategies. Simply adjust the number of pyramid buys and the quantity of each buy.
- Free 7-day trial available for TradingView users who join our free BitcoinNinjas community.
-Free 24/7 support via BitcoinNinjas Telegram GunBot support group with script purchase.
-Fully compatible with GunBot automatic trading software (TradingView plugin is required).
-Special discount available for traders who purchase GunBot automatic trading software and the GunBot TradingView plugin from BitcoinNinjas, allowing for fully automatic trading.
-Contact us via Email or Telegram for more information, to request additional / custom screenshots, or to start your free trial.
DISCLAIMER: By using this BitcoinNinjas document or ‘Ninja Signals’ planning script, you agree to the BitcoinNinjas 'Terms of Use', as presented on our website (www.BitcoinNinjas.org) and as stated here. No sharing, copying, reselling, modifying, or any other forms of use are authorized for our documents, script / strategy, and the information published with them. This informational document and planning script / strategy is strictly for individual use and educational purposes only. This is not financial or investment advice. Investments are always made at your own risk and are based on your personal judgement. BitcoinNinjas is not responsible for any losses you may incur. Please invest wisely.

Bitcoin Ninjas 'Ninja Signals' Buy & Sell Alert Trading StrategyBitcoin Ninjas 'Ninja Signals' Buy/Sell Alerts & Backtesting TradingView Script
(for Cryptocurrencies, Forex, GunBot, ProfitTrailer, automatic trading software, and more)
Main Script:
-Allows users to easily set automated buy and sell alerts on TradingView for use with automatic and manual trading of cryptocurrencies, Forex securities, and more (alerts are compatible with automatic trading software such as GunBot, ProfitTrailer, and more).
-Synthesizes many powerful indicators [e.g. Relative Strength Index (RSI), stochastic RSI, Money Flow Index (MFI), Moving Average Convergence Divergence (MACD), etc.) into one super script to generate very precise buy and sell signals in almost any market condition.
-Buy arrows (blue) and sell arrows (red) can be changed or hidden for ease of viewing.
-No lag EMA trendline featuring trend-reversal color-coding (white uptrend, black downtrend).
-Adjustable ‘calibration’ setting allows users to customize the script to work for any currency or security available through TradingView, on any exchange, simply by adjusting a number.
-Complete with backtesting strategy version of script which allows users to test various buy and sell strategies based on the alerts the script generates (see info and screenshots below).
-Backtesting strategy incorporates a user-defined adjustable date range, so users can estimate the script’s performance over specific periods of time, such as the last day, week, or month.
-Backtesting strategy utilizes a minimum protective gain setting to help you never sell for a loss. Simply adjust your minimum profit (%) per trade, and the test results will update.
-Backtesting strategy allows for pyramid buying to test various average down / double up buying strategies. Simply adjust the number of pyramid buys and the quantity of each buy.
-Free 7-day trial available for TradingView users who join our free BitcoinNinjas community.
-Free 24/7 support via BitcoinNinjas Telegram GunBot support group with script purchase.
-Fully compatible with GunBot automatic trading software (TradingView plugin is required).
-Special discount available for traders who purchase GunBot automatic trading software and the GunBot TradingView plugin from BitcoinNinjas, allowing for fully automatic trading.
-Contact us via Email or Telegram for more information, to request additional / custom screenshots, or to start your free trial.
Screenshot (Script)
Screenshot (Backtesting Strategy)
Screenshot (Adjustable Calibration, Minimum Profit Per Trade, & Date Range)
Screenshot (Optional Pyramid / Average Down Buying)
Screenshot (Customizable Buy/Sell Arrows & Trend Reversal Line)
DISCLAIMER: By viewing and/or using this TradingView script, you agree to the BitcoinNinjas 'Terms of Use', as presented on our website ( BitcoinNinjas.org ) and as stated here. No sharing, copying, reselling, modifying, or any other forms of use, are authorized for this document. This document is strictly for individual use and informational purposes only. This is not financial or investment advice. Investments are always made at your own risk, and are based on yo
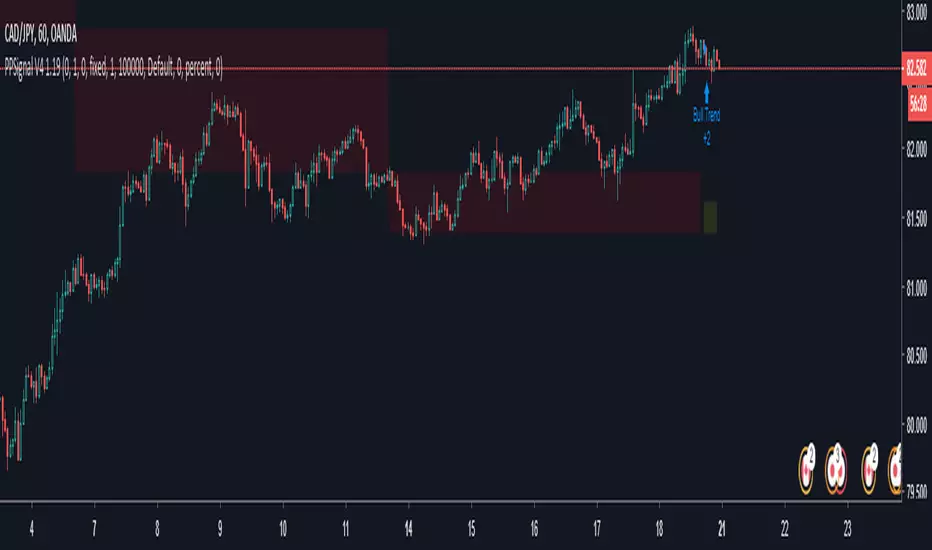
PPSignal System Algorithm Introduction
System Algorithm based on historical price probabilities and volumes. We recommend use financial stock, bond, crypts, indices, futures and Forex market (GBPUSD, EURUSD, USDJPY, USDCAD, AUDUSD, USOIL, XAUUSD, SOYUSD, DXY, SPY, SP1!, bitcoin) with defined trends above 50 or 100 and 200 simple moving averages idem if you want trade downtrend financial assets.
Use projections and retracements Fibonacci, MACD and RSI or Stoch oscillator and figures charters Head and shoulder, triangles and double bottom, double top, etc.
This system will notify you of the probability of success. The profit will be defined for yourself and according to your investor profile.
There are stocks and other assets with high returns but the system does not know exactly. Check in the Strategy tester section and then net profit.
We have other tools that support to PPsignal system, we will publish them shortly.
Define system parameters
As it is a system that is based on past data we recommend using the most historical data weekly (W) but you an use day historical data or 3 o 2 hs.
Candle color: you can choose if you want a trend color for candles or not, in the chart propieties menu detach the border option.
PPsignal it's a very simple system with which you will have a great support when it is a good time for enter in the marker and out.
we await your comments.
Eng. Oscar Alejandro Peruchena
Quants Mathematical and Market Analyst
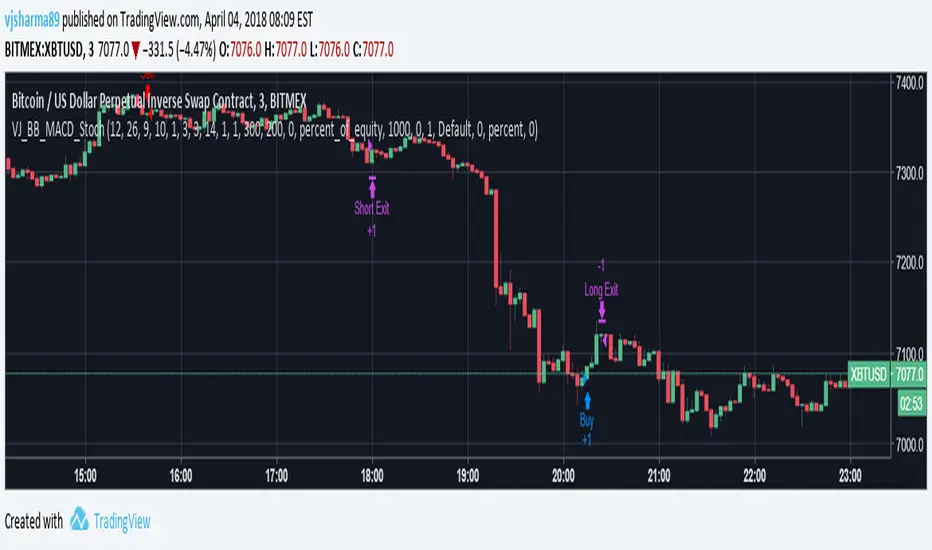
VJSHARMA_BB_MACD_Stoch_Short_Trade_Strategy_V2This script has the same working behind it except for some minor tweaks.
These tweaks enable the script to generate more signals than the previous version but with a loss of 4% accuracy.
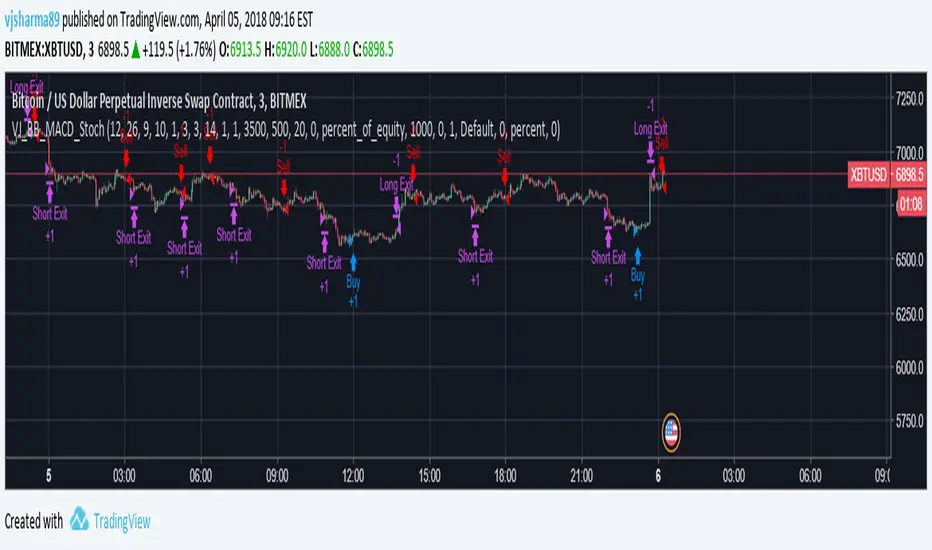
VJSHARMA_BB_MACD_Stoch_Short_Trade_StrategyThis strategy was developed keeping in mind the accuracy of signals. Due to which the time-frame had to be small as in longer timeframe, the probability of a particular movement decreases. The best application of this strategy is with Margin Trading as the signals achieved have really high accuracy.
To get the best out of this strategy, keep in mind the following
1. Choose 3 min time frame
2. Changing the stoploss and trailing stop settings could/would interfere with the accuracy of the trades.
3. Pyramiding affects the profitability of trades.
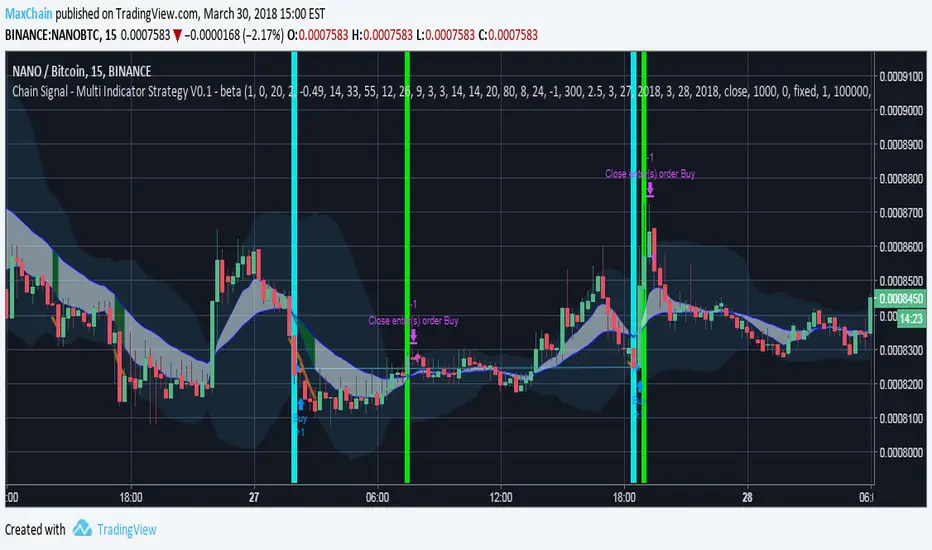
MaxChain Signals - Multi Indicator Strategy V0.1 - betaScript is under Construction:
Multiple Buy Strategies:
- RSI
- Stoch RSI
- MACD
- LOWBB
- EMAGAIN
Multiple Sell Strategies:
- RSI
- HIGHBB
- GAIN
Future Scope:
- Enable Trailing
- Smart DCA Strategies
- Williams Indicators
- Volume Indicators (longtrend / acutal trend)
- Signal Alerts for direct Buy Orders
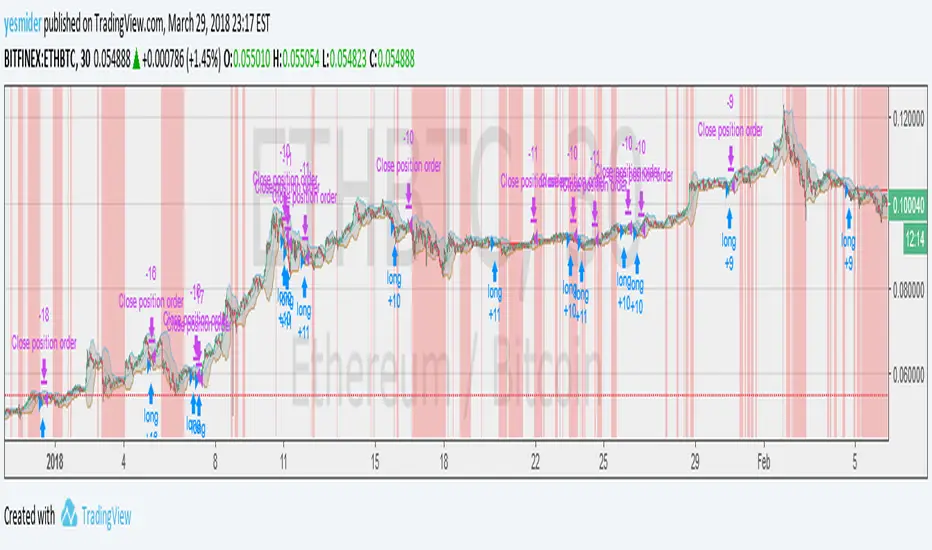
profit_trailer_basktesting_v3I rewrite the code of v2.
There are some differences between v2:
1. PT 2.0 support multi-strategy up to 5. => the script have A...E buy inputs.
Not support new strategies now, I'm not sure how they work in PT 2.0, I will add them if the wiki complete.
you may find the options in setting, but they are placeholders.
I will not add the indicators for RSI, MACD, and STOCH RSI, please use the built-in indicator in Tradingview. There is no way to change overlay state of a script in pine script as I know or you can pm me if you know about it.
2. Trailing is disabled now.
I have no idea how it works in multi-strategy, I will enable it if the PT 2.0 release.
3. Now you can set indicator period in the setting, the unit of it is minute different from PT itself.
the entry price of orders still depending on your chart resolution, so I recommend you set the chart resolution same as the main strategy you want.
Like SOM trigger in V2, there is data range limit depend on the resolution you choose.
4. DCA is rewriting now.
And I will release an Anderson only version if I have time to complete it.
5. Add rebuy timer and stop loss timer. the value of it is candles. it will look back N candles on the chart.
Feel free to donate if you think my scripts are useful.
BTC:17eguEeVVnLmYK9iDKQNxBQmKWNENH4bGj
ETH:0xb172BBc4CDAB7F334243A312A46FB8492674A914
BCH:qpy0zulq9s4pcqu3hd2m8h8h7tfm83jz7qle0690c4
Ichimoku + Daily-Candle_X + Gaussian Smooth + MacDI take no credit for this script. I swapped the Hull moving average used the original program made by SeaSide420 for a gaussian smooth function made by jjaskulowski. This script seems to consistently outperform the original strategy for the long condition. I'm mainly focused on crypto, so I removed the "short" option because most crypto exchanges don't have this function as of right now.

PPO StrategyPPO strategy, similar to MACD but with percentage
Buy when PPO cross over a threshold, ex 0.4
Sell when cross under ...
You may use it in 2h time frame or more ... to get strong signal
Feel free to help improve the strategy

PPO StrategyPPO strategy, similar to MACD but with percentage
Buy when PPO cross over a threshold, ex 0.4
Sell when cross under ...
You may use it in 2h time frame or more ... to get strong signal


Test1 based on Awesome and MACD oscillatorIf you know how to set stop-loss and take-profit limit based on prices, not tick, please comment.
Thanks!!


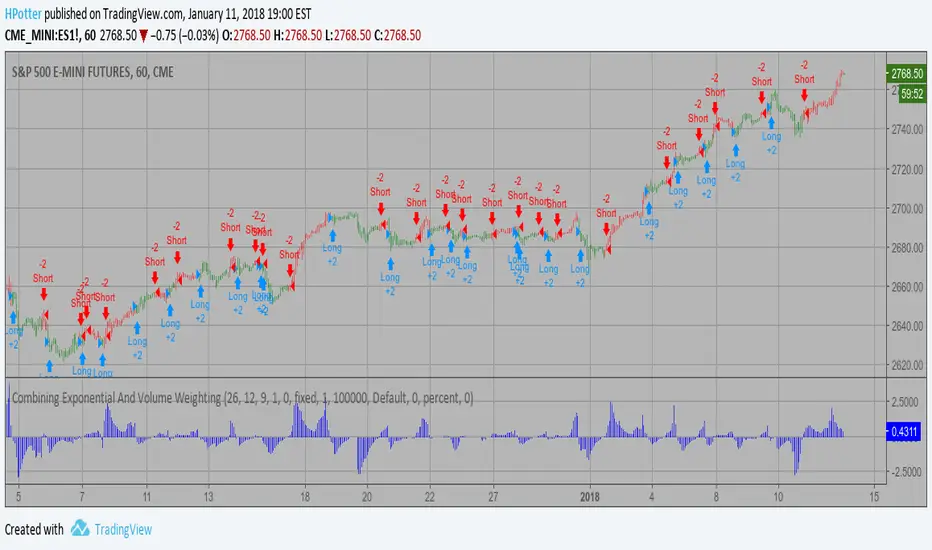
Combining Exponential And Volume Weighting Backtest The related article is copyrighted material from Stocks & Commodities 2009 Oct
You can change long to short in the Input Settings
WARNING:
- For purpose educate only
- This script to change bars colors.
Dolor Aqua v1.0 http://tvautotrader.comBased on my old indicator which had a great opportunity to detect the perfect bottom to start a long trade.
This strategy is using open candle values so it doesn't repaint trade signals!
The receipt is a mix of classic indicators like RSI, MACD, moving averanges, money flows and s/r borders. On different timeframes have different profit chance (65-90%) and big p. ratio
Compatible with TradingView Auto-Trader Bot
tvautotrader.com

MA Tester Need Help please ;)Hello,
I'm new in scripts.
I build this one based on the MACD Strategy one but it look like mine don't plot buy and sell arrows on my chart, why?
thanks for help

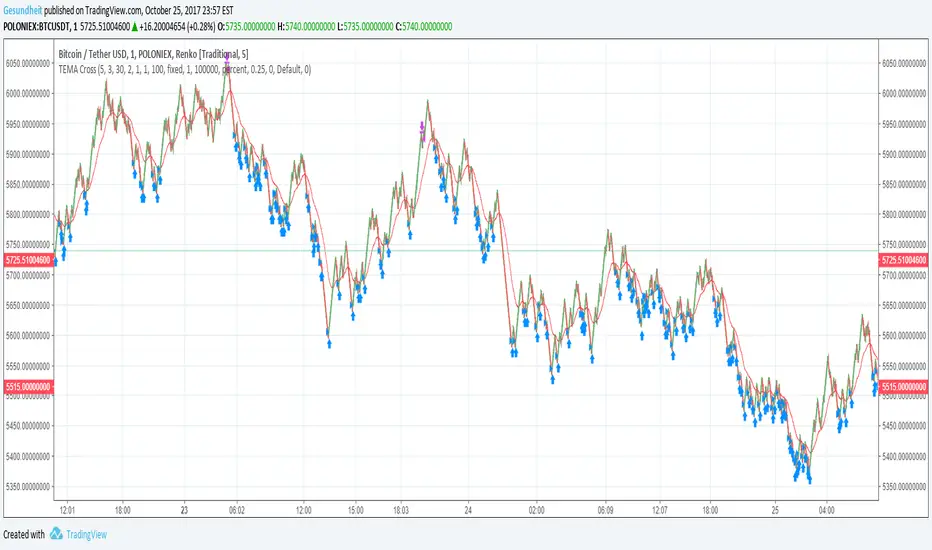
TEMA Cross on Renko CandlesRenko candles filter out noise by plotting a fixed change in price rather than a fixed time frame.
Strategies like MACD or MA cross can give a lot of false signals when the price is wavy, but not actually going anywhere. This is especially a problem with small time frames.
Since it's so easy to identify trends on a Renko plot, this strategy uses a simple moving average cross idea. Instead of an EMA, we use a TEMA ( triple exponential moving average ) because that version does not lag as much.
We also will avoid buying when the price is above a longer-term smoothed moving average. This means we will hopefully reduce bags, but we will also miss some trades.
Also included are
avg_protection -- if >0 only buy when it will bring down our average price, else buy whenever the TEMA crosses over the short-term SMA
gain_protection -- if >0 only sell when we meet out min_gain %, otherwise sell whenever TEMA crosses under the short-term SMA
I've been setting my Renko candles to a fixed range instead of ATR, and I use increments of roughly 0.1% in the example chart.
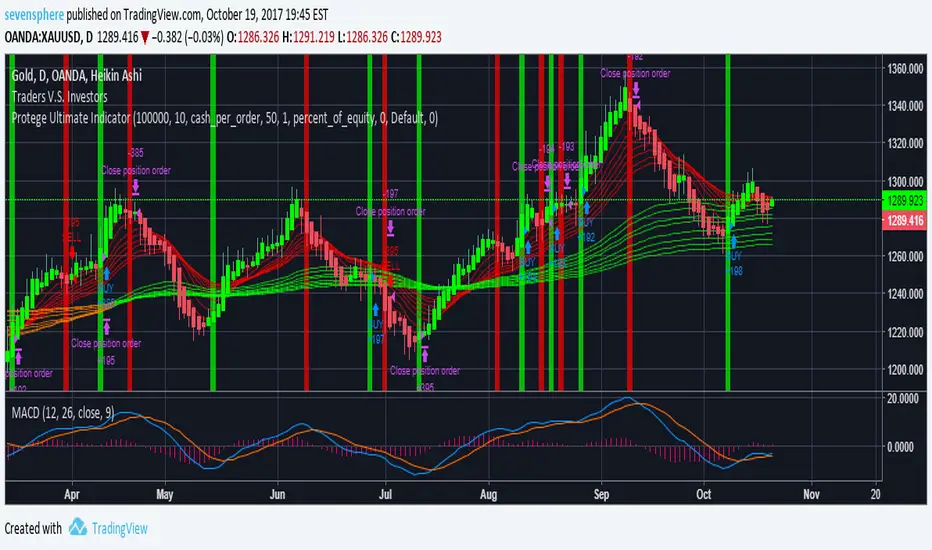
PUI - Protege Ultimate IndicatorEach lines is a potential trade. Some trade are already filtered because its a trend script.
I suggest you to use the following :
- Heikin ashi candle
- Daily chart or 4h chart minimum
- When the 2 lines of the macd are over 0 (long) or under 0 (short) and you get a trigger, i see the best trades with it.
- Use in combo with Investors V.S. Traders to track investors and get the best results.
Important :
- When you are in profit with this tool, you need to move your stop.
- The stop must be over the last heikin ashi candle top for a short.
- The stop must be under the last heikin ashi candle bottom for a long.
Extra :
If you use GodMode in tradingview:
- when you see the yellow dots on the top, you need to take the short on the next red line.
- when you see the yellow dots at the bottom, you need to take the long at the next green line.
Good luck friend!
Percentage Volume Oscillator (PVO) Backtest The Percentage Volume Oscillator (PVO) is a momentum oscillator for volume.
PVO measures the difference between two volume-based moving averages as a
percentage of the larger moving average. As with MACD and the Percentage Price
Oscillator (PPO), it is shown with a signal line, a histogram and a centerline.
PVO is positive when the shorter volume EMA is above the longer volume EMA and
negative when the shorter volume EMA is below. This indicator can be used to define
the ups and downs for volume, which can then be use to confirm or refute other signals.
Typically, a breakout or support break is validated when PVO is rising or positive.
You can change long to short in the Input Settings
WARNING:
- For purpose educate only
- This script to change bars colors.

BB Indicator [Alpha]Currently working on some custom Bollinger Bands indicator strategy. I would say this is in its alpha stage as I'm trying to tune it for a more profitable strategy.
I'm trying to combine the squeezes to other indicators like the RSI and MACD and seeing how it affects the buy/sell patterns.
Please do not use this strategy as it is not ready yet and I'm still testing it out.
Thank you and stay tuned!

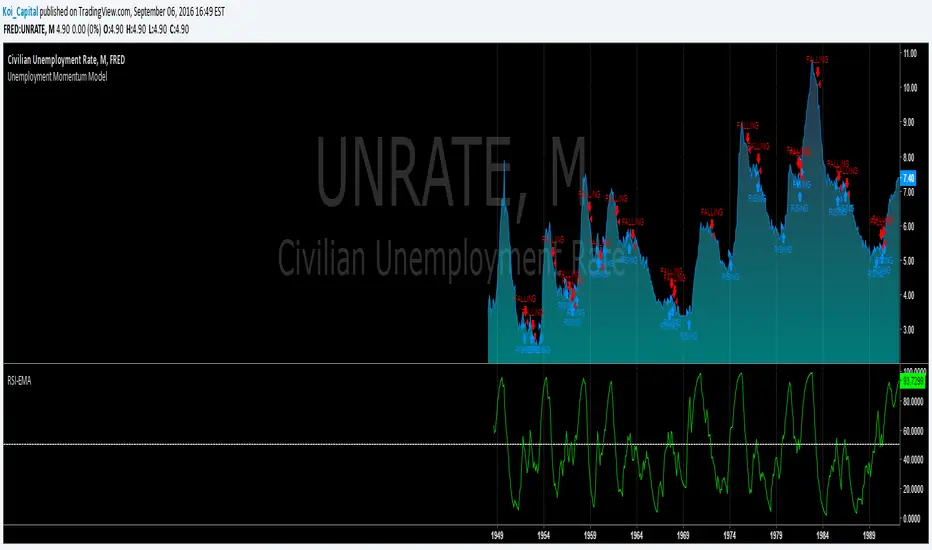
Unemployment Momentum ModelThis model uses a Smoothed RSI to measure the momentum of the Civilian Unemployment Rate as published by FRED. The behavior of the unemployment rate makes it ideal for applying momentum-based timing techniques because it tends to rise sharply in a short time period and then declines gradually over a longer period. Using other basic momentum-based timing techniques also works well (e.g., EMA crossover, MACD, ROC, etc.)
Please note that you cannot trade the unemployment rate directly. This model is meant to help you understand the state of the current economy in the context of unemployment.