The Brain Trust Presets Strategies [BTC / ETH] [PrismBot] [Lite]This strategy contains 9 different timeframe strategies (2 strategy types with pre-adjusted filter options for the different timeframes) tailored to BTC ( Bitcoin ) and ETH ( Ethereum ) on Binance. While I've listed these prebuilt strategies for specific timeframes, they are versatile enough to be checked and tested on other timeframes, and exchanges as well. I have been careful to avoid any curvefitting or overfitting. Included is useful default order settings, but we wanted to ensure you, the user, has control over the order settings for your own equity and trading.
These strategies are created, tailored, tested, and actively used by me.
It is up to you to do your own due diligence when testing these strategies on your exchange, and for your use, and PrismBot bears no responsibility for losses from the use of these strategies.
These strategies employ a variety of methods. Notable inclusions are other live strategies of mine including but not limited to:
ADX + MACD
RSI
Consolidations
Bull Bear Power
Volume Calculations
Open Interest Data
All of these setups include trend trading methods intended to maximize profitability in strong trending markets, and filters deployed to prevent failures in consolidation, though nothing is failproof.
You can control your leverage, quantity calculations, and other order settings. However, all other strategy input parameters are controlled by the strategy selectors.
Some strategies use 1.5 to 1 Risk to Reward ratio while others use 1:1.
How we execute trades for each strategy:
For 10m and 45m
we use a variety of settings for a Normalized MACD and ADX indicator. The thesis is we detect Normalized MACD crossovers at specific values and only allow trading of the strategy when the ADX is above a specific value.
For 15m, 1H, and 45m
we utilize the RSI crossovers of overbought and oversold and use the RSI moving average to filter trades. The thesis is we detect overbought for long and oversold for short.
For each strategy we use additional filters such as Bull Bear Power, Volume Flow, and Open Interest calculations to simply validate a trade.
Automatic Mode
In automatic mode, we detect your timeframe and current coin chart to decide one of the strategies from our database. If you want to manually select a different strategy or try the strategies on different cryptocurrencies, you can disable automatic mode entirely.
Recherche dans les scripts pour "macd"

MACD_Long_OnlyI created this indicator to calculate the gains that can be made purely by going long on the market. For exchanges without the ability to short, the standard MACD strategy is unable to accurately calculate the profit/loss from entering and exiting a position, as it includes profit/loss from actively shorting the market, which may either not be possible, or be undesirable for a specific asset.

MACD Willy StrategyThis strategy is mainly developed for scalping / intraday trading. It could potentially be used to identify entry/exit signals for short term options trading. It performs decently well on popular stocks when used on time frames between 5 min to 15 min using regular session bar data. It combines 3 popular indicators, EMA, MACD, and William %range, to generate both long and short signals.
EMA:
Default is 200 EMA line.
MACD:
Default is 12/26 lengths for fast/slow signal inputs.
William %R - Smoothed (Published):
This is a custom indicator that generates two moving average lines from the original William %R line.
How it works:
Entry conditions:
1. Long/short entries when bar closes above/below EMA line
2. Long/short entries when MACD line is above/below signal line (histogram > 0 for long, < 0 for short)
3. Long/short entries when William %R fast MA line is above/below slow MA line
Exit conditions:
1. Exit long when MACD line is below signal line, vise versa for exit short
2. Exit long when William %R fast MA line is below slow MA line, vise versa for exit short
3. Exit long when William %R fast MA line must in below the overbought (-20) limit, exit short when above the oversold (-80) limit.
***Note that parameters are NOT optimized for any particular stocks / instruments.
Enjoy~~!!

MACD/EMA/SMA/Ichimoku Confluence StrategyThis strategy uses a number of chart indicators to provide a Bullish/Bearish signal. Using a combination of the 200 SMA, the 20 EMA, the MACD and the Ichimoku cloud, the strategy logic will adjust the amount of confluence required between the indicators depending on how bullish or bearish the chart is looking. The logic looks for the following:
- Are we above or below the 200 SMA?
- Are we above or below the 20 EMA?
- Have we had a bullish MACD cross?
- Where are we in relation to the Ichimoku cloud?
If the coin is below the 200 SMA, then the strategy will only give a buy signal if the coin closes a candle above the 20 EMA AND the MACD is bullish and either the Ichimoku cloud is green, or the coin is above the Ichimoku cloud (regardless of colour).
If the coin is above the 200 SMA, Then the strategy will give a buy signal if the coin closes a candle above the 20 EMA AND the MACD is bullish and the coin is either IN the cloud (not necessarily above it) or the cloud is green.
The reverse is true for a sell signal, i.e. when the coin is above the 200 SMA it must close a candle below the Ichimoku cloud and be bearish in relation to the 20 EMA and MACD. If it is below the 200 SMA, then the strategy will give a sell signal if the the EMA/MACD conditions are true and the coin enters the cloud.
This strategy gives a fairly conservative signal for entry and exit points, but is fairly successful across a number of time frames, both short term and long term. As with all my strategies, I only include LONG entries and closes, not SHORT entries (as I find they make for inaccurate backtesting).
Please feel free to like, share, critique and suggest any improvements to this strategy. All feedback, positive and negative, is appreciated.

PASS: Price Action Support StrategyPASS is dedicated to all Intraday Traders.
This is based on Secret of Pivot Boss book by Frank Ochoa. Suitable for Intraday Trading.
It is combination of two Price action theory and one indicator mainly known as Floor Pivots, Camarilla Pivots and MACD.
MACD gives the better entry & exit levels for Day Trading whereas the other two Price action theory give the "levels/zones" where actions can be expected during live market hours.
You can view Daily time frame cpr/support/resistance.
You can also view Previous Day,Week,Month High/Low.
You can also turn on/off as per your wish and adjust the colors as per your preferences.
Happy Trading !!


MBY_Trade1HBITFINEX:ETHUSD
Hi.
This is MBY_LAB.
This indicator is a paid indicator.
The color of the moving average reflects MACD.
The signal line in the middle of the screen is the Ichimoku baseline.
And you can also trade through the Bollinger Band at the same time, and you can turn it off when you need it.
You can see the Fibonacci resistance line and supporting line at a glance.
We have set the background color to distinguish between bearish and burlish.
Please use strategy test in 1 hour time frame.
Please give me a message.

Adaptive MA Scalping StrategyAdaptive MA Scalping Strategy
The Adaptive MA Scalping Strategy is an innovative trading approach that merges the strengths of the Kaufman's Adaptive Moving Average (KAMA) with the Moving Average Convergence Divergence (MACD) histogram. This combination results in a momentum-adaptive moving average that dynamically adjusts to market conditions, providing traders with timely and reliable signals.
How It Works
Kaufman's Adaptive Moving Average (KAMA): Unlike traditional moving averages, KAMA adjusts its sensitivity based on market volatility. It becomes more responsive during trending markets and less sensitive during periods of consolidation, effectively filtering out market noise.
MACD Histogram Integration: The strategy incorporates the MACD histogram, a momentum indicator that measures the difference between a fast and a slow exponential moving average (EMA). By adding the MACD histogram values to the KAMA, the strategy creates a new line—the momentum-adaptive moving average (MOMA)—which captures both trend direction and momentum.
Signal Generation:
Long Entry: The strategy enters a long position when the closing price crosses above the MOMA. This indicates a potential upward momentum shift.
Exit Position: The position is closed when the closing price crosses below the MOMA, signaling a potential decline in momentum.
Cloud Calculation Detail
The MOMA is calculated by adding the MACD histogram value to the KAMA of the price. This addition effectively adjusts the KAMA based on the momentum indicated by the MACD histogram. When momentum is strong, the MACD histogram will have higher values, causing the MOMA to adjust accordingly and provide earlier entry or exit signals.
Performance on Stocks
This strategy has demonstrated excellent performance on stocks when applied to the 1-hour timeframe. Its adaptive nature allows it to respond swiftly to market changes, capturing profitable trends while minimizing the impact of false signals caused by market noise. The combination of KAMA's adaptability and MACD's momentum detection makes it particularly effective in volatile market conditions commonly seen in stock trading.
Key Parameters
KAMA Length (malen): Determines the sensitivity of the KAMA. A length of 100 is used to balance responsiveness with noise reduction.
MACD Fast Length (fast): Sets the period for the fast EMA in the MACD calculation. A value of 24 helps in capturing short-term momentum changes.
MACD Slow Length (slow): Sets the period for the slow EMA in the MACD calculation. A value of 52 smooths out longer-term trends.
MACD Signal Length (signal): Determines the period for the signal line in the MACD calculation. An 18-period signal line is used for timely crossovers.
Advantages of the Strategy
Adaptive to Market Conditions: By adjusting to both volatility and momentum, the strategy remains effective across different market phases.
Enhanced Signal Accuracy: The fusion of KAMA and MACD reduces false signals, improving the accuracy of trade entries and exits.
Simplicity in Execution: With straightforward entry and exit rules based on price crossovers, the strategy is user-friendly for traders at all experience levels

XAUUSD 10-Minute StrategyThis XAUUSD 10-Minute Strategy is designed for trading Gold vs. USD on a 10-minute timeframe. By combining multiple technical indicators (MACD, RSI, Bollinger Bands, and ATR), the strategy effectively captures both trend-following and reversal opportunities, with adaptive risk management for varying market volatility. This approach balances high-probability entries with robust volatility management, making it suitable for traders seeking to optimise entries during significant price movements and reversals.
Key Components and Logic:
MACD (12, 26, 9):
Generates buy signals on MACD Line crossovers above the Signal Line and sell signals on crossovers below the Signal Line, helping to capture momentum shifts.
RSI (14):
Utilizes oversold (below 35) and overbought (above 65) levels as a secondary filter to validate entries and avoid overextended price zones.
Bollinger Bands (20, 2):
Uses upper and lower Bollinger Bands to identify potential overbought and oversold conditions, aiming to enter long trades near the lower band and short trades near the upper band.
ATR-Based Stop Loss and Take Profit:
Stop Loss and Take Profit levels are dynamically set as multiples of ATR (3x for stop loss, 5x for take profit), ensuring flexibility with market volatility to optimise exit points.
Entry & Exit Conditions:
Buy Entry: T riggered when any of the following conditions are met:
MACD Line crosses above the Signal Line
RSI is oversold
Price drops below the lower Bollinger Band
Sell Entry: Triggered when any of the following conditions are met:
MACD Line crosses below the Signal Line
RSI is overbought
Price moves above the upper Bollinger Band
Exit Strategy: Trades are closed based on opposing entry signals, with adaptive spread adjustments for realistic exit points.
Backtesting Configuration & Results:
Backtesting Period: July 21, 2024, to October 30, 2024
Symbol Info: XAUUSD, 10-minute timeframe, OANDA data source
Backtesting Capital: Initial capital of $700, with each trade set to 10 contracts (equivalent to approximately 0.1 lots based on the broker’s contract size for gold).
Users should confirm their broker's contract size for gold, as this may differ. This script uses 10 contracts for backtesting purposes, aligned with 0.1 lots on brokers offering a 100-contract specification.
Key Backtesting Performance Metrics:
Net Profit: $4,733.90 USD (676.27% increase)
Total Closed Trades: 526
Win Rate: 53.99%
Profit Factor: 1.44 (1.96 for Long trades, 1.14 for Short trades)
Max Drawdown: $819.75 USD (56.33% of equity)
Sharpe Ratio: 1.726
Average Trade: $9.00 USD (0.04% of equity per trade)
This backtest reflects realistic conditions, with a spread adjustment of 38 points and no slippage or commission applied. The settings aim to simulate typical retail trading conditions. However, please adjust the initial capital, contract size, and other settings based on your account specifics for best results.
Usage:
This strategy is tuned specifically for XAUUSD on a 10-minute timeframe, ideal for both trend-following and reversal trades. The ATR-based stop loss and take profit levels adapt dynamically to market volatility, optimising entries and exits in varied conditions. To backtest this script accurately, ensure your broker’s contract specifications for gold align with the parameters used in this strategy.

Moving Average Crossover Swing StrategyMoving Average Crossover Swing Strategy
**Overview:**
The basic concept of this strategy is to generate a signal when a faster/shorter length moving average crosses over (for Longs) or crosses under (for Shorts) a medium/longer length moving average. All of which are customizable. This strategy can work on any timeframe, however the daily is the timeframe used for the default settings and screenshots, as it was designed to be a multi-day swing strategy. Once a signal has been confirmed with a candle close, based on user options, the strategy will enter the trade on the open of the next candle.
The crossover strategy is nothing new to trading, but what can make this strategy unique and helpful, is the addition of further confirmation points, ATR based stop loss and take profit targets, optional early exit criteria, customizable to your needs and style, and just about everything visual can be toggled on/off. This strategy is based on a Trend (MA) indicator and a Momentum (MACD) indicator. While a Volume-based indicator is not shown here, one could consider using their favorite from that category to further compliment the signal idea.
It should be noted that depending on the time frame, direction(s) chosen, the signal options, confirmation options, and exit options selected, that a ticker may not produce more than 100 trades on the back test. Depending on your style and frequency, one could consider adjusting options and/or testing multiple tickers. It should also be noted that this strategy simply tests the underlying stock prices, not options contracts. And of course, testing this strategy against historical data does not assume that the same results will occur in future price action.
Shoutout given to Ripster's Clouds Indicator as pieces of that code were taken and modified to create both the Cloud visualization effects, and the Moving Average Pair Plots that are implemented in this strategy.
BASIC DEFAULTS
All can be changed as normal
Initial capital = 10,000
Order Sizing = 25% of equity (use the "Inputs" tab to modify this)
Pyramiding = 0
Commission = 0.65 USD per order
Price Verification = 1 tick
Slippage = 1 tick
RISK MANAGMENT
You will notice two different percentage options and ATR multipliers. This strategy will adjust position sizing by not exceeding either one of those % values based on the ATR (Average True Range) of the symbol and the multipliers selected, should the stock hit the stop loss price.
For Example, lets assume these values are true:
Account size = $10,000,
Max Risk = 1% of account size
Max Position Size = 25% of the account size
Stock Price = 23.45
ATR = 3.5
ATR Stop Loss Multiplier = 1.4
Then the formulas would be:
ACCT_SIZE * MaxRisk_% = 10000 * .01 = $100 (MaxCashRisk)
-----
MaxCashRisk / (ATR * ATR_SL_MULTIPLIER) = 100 / (3.5 * 1.4) = 20.4 Shares based on Max Cash Risk
-----
(ACCT_SIZE * MaxEquity_%) / STOCK_PRICE = (10000 * .25) / 23.45 = 106.61 Shares based on Max Equity Allocation
The minimum value of each of those options is then used, which in this case would be to purchase 20 shares so as not to exceed the max dollar risk should the stock reach the stop loss target. Likewise, if the ATR were to be much lower, say 0.48 cents, and all else the same, then the strategy would purchase the 106 shares based on Max Equity Allocation because the Max Cash Risk would require 149.25 shares.
MOVING AVERAGE OPTIONS
Select between and change the length & type of up to 5 pairs (10 total) of moving averages
The "Show Cloud-x" option will display a fill color between the "a" and "b" pairs
All moving averages lines can be toggled on/off in the "Style" tab, as well as adjusting their colors.
Visualization features do not affect calculations, meaning you could have all or nothing on the chart and the strategy will still produce results
SIGNAL CHOICES
Choose the fast/shorter length MA and the medium/longer length MA to determine the entry signal
CONFIRMATION OPTIONS
Both of these have customizable values and can be toggled on/off
A candle close over a slower/much longer length moving average
An additional cross-over (cross-under for Shorts) on the MACD indicator using default MACD values. While the MACD indicator is not necessary to have on the chart, it can help to add that for visualization. The calculations will perform whether the indicator is on the chart or not.
EARLY EXIT CRITERIA
Both can be toggled on/off with customizable values
MA Cross Exit will exit the trade early if the select moving averages cross-under (for longs) or cross-over (for shorts), indicating a potential reversal.
Max Bars in Trades will act as a last-resort exit by simply calculating the amount of full bars the trade has been open, and exiting on the opening of the next bar. For example: the default value is 8 bars, so after 8 full bars in the trade, if no other exit has been triggered (Stop Loss, Take Profit, or MA Cross(if enabled)), then the trade will exit at the opening of the 9th bar.
Finally, there is a table displaying the amount of trades taken for each side, and the amount & percent of both early exits. This table can be turned off in the "Style" tab
ADDITIONAL PLOTS
MACD (Moving Average Convergence/Divergence):
- The MACD is an optional confirmation indicator for this strategy.
- Plotting the indicator is not necessary for the strategy to work, but it can be helpful to visually see the status and position of the MACD if this feature is enabled in the strategy
- This helps to identify if there is also momentum behind the entry signal

MACD + MA HTF Strategy - Dynamic SmoothingMACD + MA HTF Strategy - Dynamic Smoothing
The MACD alone generally gives too many false signals and is therefore often used in combination with different indicators. The basic idea to combine the MACD with a moving average on a higher time frame is a commonly used technique to only enter Longs in a uptrend and only Shorts in a downtrend while trading on lower timeframe charts. However, the main issue in many strategy scripts is that the HTF indicator is not visible on lower timecharts. With this strategy example I used the Dynamic Smoothing code to visualise the HTF MA filter to display on you lower timechart. This way it is easier to optimize the strategy settings to the instrument chart.
Orginality and Usefulness - Dynamic Smoothing
Visualizing a higher time frame on a lower timechart often gives jagged lines on your chart. As the calculation is done on less bars, compared to the bars you have open on your timechart. The dynamic smoothing factor is derived by taking the ratio of minutes of the higher time frame to the current time frame. This ensures the moving average remains fluid and consistent across different time frames, eliminating 'jagged' lines on your chart. This new MA value is then used as HTF filter on top of the MACD entry settings. Always make sure the time chart is equal or lower than the timeframe settings in the configuration settings. The intention of the script is to visualise the higher time frame confirmations while trading on a lower timechart.
Code example how to achieve Dynamic Smoothing:
// Get minutes for current and higher timeframes
// Function to convert a timeframe string to its equivalent in minutes
timeframeToMinutes(tf) =>
multiplier = 1
if (str.endswith(tf, "D"))
multiplier := 1440
else if (str.endswith(tf, "W"))
multiplier := 10080
else if (str.endswith(tf, "M"))
multiplier := 43200
else if (str.endswith(tf, "H"))
multiplier := int(str.tonumber(str.replace(tf, "H", "")))
else
multiplier := int(str.tonumber(str.replace(tf, "m", "")))
multiplier
// Get minutes for current and higher timeframes
currentTFMinutes = timeframeToMinutes(timeframe.period)
higherTFMinutes = timeframeToMinutes(TimeFrame_Trend)
// Calculate the smoothing factor
dynamicSmoothing = math.round(higherTFMinutes / currentTFMinutes)
MA_Value_Smooth = ta.sma(MA_Value_HTF, dynamicSmoothing)
Complete Strategy
The MACD and HTF moving average is used to determine when to enter a new position. However a strategy should consider more factors than only the timing of entering a trade. To complete the strategy I included:
an option to choose from different MA types per indicator
a Risk Management Tool
a Take Profit Logic
a Trailing stop loss
a Hard Stoploss
a visual representation of TP and SL
This is merely an example how to structure a strategy and many different setups are possible.
The features in this script are explained below:
Different MA types
The script supports various MA types like EMA, SMA, DEMA, TEMA, WMA and HMA. You can select the MA type and different timeframe to your liking.
Risk Management Tool
Traders can choose to allocate their position size based on a percentage of equity or a fixed number of contracts. This feature ensures prudent risk management and helps traders align their position sizes with their risk tolerance. In the strategy -0.5 is equal to 50% of equity and 1.5 is 150% of equity used. Make sure to align the % of equity with your maxdrawn results with backtesting. Personally I don't want higher max drawdowns than 15%. For the strategy results the script considers 0.05 commission rate on each trade, to stay conservative. For a more detailed explanation I refer to my earlier published tradingviewblog about risk management:
Take Profit Logic
The take profit logic in this script is designed for optimization, offering three distinct exit levels. Traders can customize these levels based on their risk appetite. The script allows adjustment of both the percentage take profit level and the position size, catering to individual trading strategies and objectives. The default settings closes 33% of the position when TP target is hit. The TP levels are simply calculated by inputting a % of of the entryprice.
Trailing Stop and Hard Stoploss
To mitigate downside risks and protect profits, the script incorporates a well-thought-out trailing stop mechanism based on the Average True Range (ATR). This dynamic trailing stop adapts to market volatility, allowing traders to secure gains while letting profitable positions run. Additionally, to prevent significant losses, a fixed stop loss is implemented, providing an added layer of protection.
Visual Representation of Take Profit and Stoploss Levels
For enhanced visualization, take profit and stoploss levels are displayed on the chart. Take profit levels are depicted with green lines, providing a clear indication of potential exit points. Conversely, the trailing stop loss is presented by the red line, serving as visual cues for risk management. Visualizing indicators makes is easier to optimize settings to your liking.
Ideal Settings and Accessibility
This script is intended to be used on lower timeframe charts like 10 to 30 minutes. You can Align the MACD entry settings equal to your opened timechart or use a slightly higher timeframe. For the MA trend filters, higher timeframe settings such as 30 min, 1 hour, 4 hours, or 1 day are recommended for trading the trend.
Disclaimer
Trading involves significant risk and may not be suitable for all investors. The information provided in this script is for educational purposes only and should not be considered as financial advice. Past performance is not indicative of future results. By using this script, you acknowledge that you understand and accept these risks.

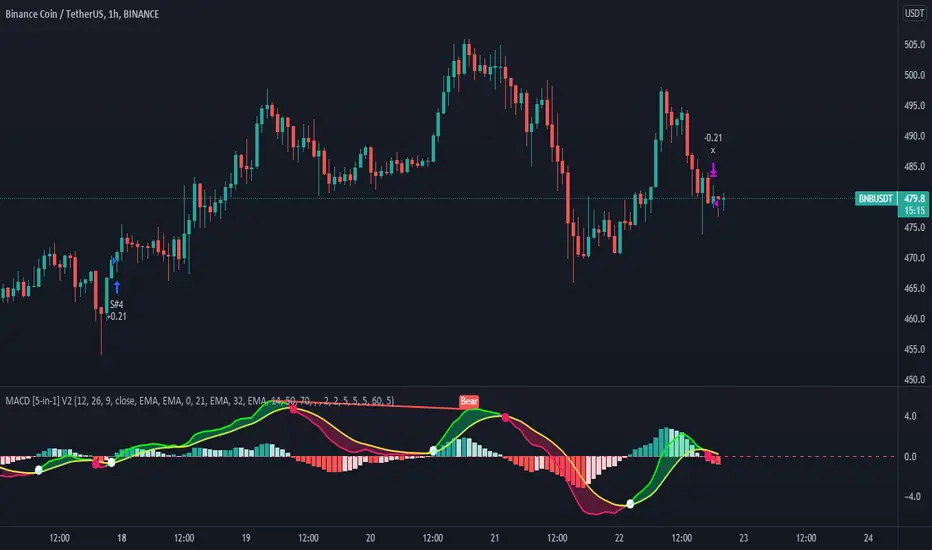
MACD 5 iN 1 [Pro-Tool]introducing MACD Which has different indicators inside,
And not only that, five different strategies have also been included in this indicator.
Strategy №1:👉 MACD Crossover Signal Line
Strategy №2:👉 MACD Crossover + MACD Overbought Section (for ignore false Crossover signals)
Strategy №3:👉 MACD Crossover + Market Close should b greater tha MOVING AVERAGE
Strategy №4:👉 MACD Crossover + Market Close should b greater tha MOVING AVERAGE ZONE
Strategy №5:👉 MACD Crossover + RSI Close should b greater tha 50 Level (or whatever level you choose)
also 5 types of MOVING AVERAGE you can choose
1: Simple Moving Average ( SMA )
2: Exponential Moving Average ( EMA )
3: Weighted Moving Average ( WMA )
4: Volume Weighted Moving Average ( VWMA )
5: Relative Moving Average (RMA)
and you can customize MACD Colors + Widths + Signals and MACD lines, and also can Hide or Unhide Histogram / Cross Sign / MACD Zone Color
hope so you like it, 🥰
Investing and trading in cryptocurrencies is very risky, as anything can happen at any time.
***NOT FINANCIAL, LEGAL, OR TAX ADVICE! JUST OPINION! I AM NOT AN EXPERT! I DO NOT GUARANTEE A PARTICULAR OUTCOME I HAVE NO INSIDE KNOWLEDGE! YOU NEED TO DO YOUR OWN RESEARCH AND MAKE YOUR OWN DECISIONS! THIS IS JUST EDUCATION & ENTERTAINMENT! USE ALTCOIN DAILY AS A STARTING OFF POINT!
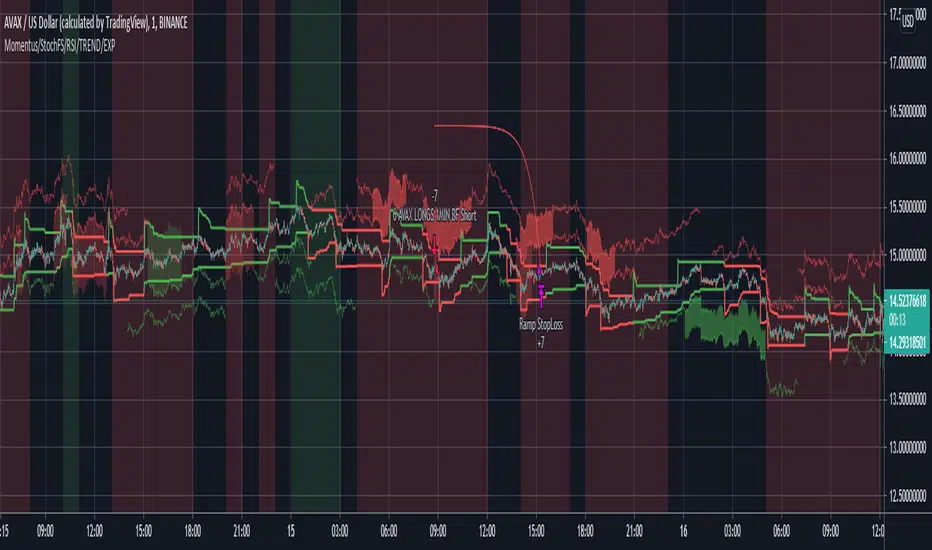
MACD/RVSI/Stoch/RSI/EXP(Drawdown)I have been trying for several months to get a script to work on the 1min and this one gives some good backtest results. This script will also work on higher timeframes however, I've not extensively tested on higher timeframes. My aim was to get results on about 20 crypto coins then run the 1min bots in parallel looking for small frequent profits across all the coins. If you would like me to try and fit backtest results to any coin or pair on any timeframe please do get in touch anytime.
It's based on several indicators which are combined and then a newish way for the stop loss to implement based on an exponential rising which limits the time in each trade unless the price moves in the direction of the trade. The other useful feature is drawdown minimization which previously made all of my 1minute bot attempts non-practical due to differences between backtesting and actually running the bot(s) live.
Its possible at the top to paste in strategy comments which can be used through web-hooks for auto trading bots. Leaving these blank just defaults to the pre-programmed comments that provide some indication of why a trade was exited.
It is possible to select for Short and/or Long trades. Note however, that there are exponential markers on the charts for both long and short trades in any setting. I found that this way the bot worked well with regards to timing.
The next part of the user interface settings gets a bit tricky so try and use the sample parameters provided below. For example, select a crypto coin then try some of the options below until a reasonable backtest result in obtained (or select the best from the parameter groups tested) then move down the settings interface to optimise with the remaining settings.
So 'Use MACD/RVSI', 'RSI clause' and 'Use Stochastic' are set to true for the below sample settings (1min timeframe).
MACD/RVSI Confluence Resolution (1min, 2min, 5min, 10min, 1hour)
Timeframe RSI (1min, 2min, 3min, 15min, 1hour)
FastStoch, SlowStoch (1min, 45min: 5min, 30min: 1min, 1hour: 5min, 1hour)
Eg. for FTX:ETHPERP (MACD/RVSI Confluence Resolution=1hour, Timeframe RSI= 1min, FastStoch = 1min, SlowStoch = 45min)
Setting the timings is tricky - there is a lot going on. Have a look at the chart and select/deselect the options. The MACD/RVSI Confluence Resolution shows red and green vertical regions on the chart background. The Timeframe RSI colors the candle bodies red and green. These go green if the RSI crossed over 31% or red in the RSI crossed under 69%. The MACD/RVSI Confluence Resolution is explained in more detail in one of my other scripts. Then the Slow Stoch colors above and below the price action with red or green lines depending if on an uptrend or downtrend (approximately). Where there is also an up/down trend on the faster timeframe stoch there are vertical shaded fill regions between the slow stop above/below lines.
With all the above conditions selected to represent the data (looking at strategy backtest results whilst adjusting) there is a reasonable approximation to a credible trade.
So once an ok backtest result is obtained by selecting timing settings. Its ontot the Stop Ramp Settings. This is an exponential line which rises rapidly after a period of time thus exiting the trade or going upwards with the trade. It kind of limits the maximum time a trade will stay in position which forms part of the timing aspect of this bot. Look at the chart exponential red lines and adjust the settings, along with the backtest results to select a good timing.
Then its the Drawdown Catcher and the Take Profit Setting. Start with the drawdown catcher disabled i.e. set to zero. Put in a conservative Take Profit, for example if a Take Profit at 6% gives the best backtest results, go for 4% to account for differences between backtest results and actual live bot performance.
Then start to increase the Drawdown Catcher. This shades a lime region where the bot will not enter a trade. I found that with most trades using this bot, if the price action moved in the direction of the trade (long or short) at the onset - this gave most of the good results (high probability of positive trade). Also if a trade entered at the start price and when south, the accumilated drawdown from these failing trades made all previous 1min bot attempt non=profitable in practice (even with good backtest results). The exp timing and also this drawdown reduction strategies seem to be the thing which makes this approach credible.
Try to go for settings that give a very high change of positive trade. For example, an 85% profitable trades will probably provide say 55% positive trades in practice as its always highly possible to just fit the parameters to the exact position/trade timings - and in reality going forwards these don't play out the same. Also a Profit Factor of 2 is about the minimum I would accept - again this provides for example a Profit Factor of 1.2 in practive.
However all being said - I think its possible with this bot on the 1min across lots of coins - with regularly updating settings - to make profits. (Not financial advice)
Please do get in touch if you would like me to fit this bot to anytimeframe to any trade.
MoonFlag PhD
Rob Booker Reversal Tabs StrategyRob Booker Reversal Tabs Strategy is an updated version of Rob Bookers Reversal Tab study: Rob Booker Reversal Tabs
While the original is a Pinescript study, this version can be switched between strategy and indicator mode.
Rob Bookers script generates reversal signal based on MACD and Stochastics, it is not a true reversal system, default pyramiding value is set to 5.
Inputs determine MACD and Stochastics settings. The only additional input is the "Strategy Mode" checkbox.
This script works well on its own for some tickers, but like any reversal pattern generating scripts, traders will profit from looking at overall price action and trend strength before making a trade.
From the original:
A simple reversal pattern indicator that uses MACD and Stochastics.
Created by Rob Booker and programmed by Andrew Palladino.
Please note that I only updated the original to V5 and edited it to be a strategy, which was a grand total of 5 minutes of work. I updated it because I wanted to see how the script performs as a strategy and I'm publishing it in case others would like to use it. I take no credit whatsoever for the original and WILL take this version down if Rob Booker or his Team ask me to or decide to release their own strategy version of the original.
Check out Rob Bookers scripts and ideas on his Tradingview account: robbooker

5 Minute Scalping StrategyTaking entrys based on the 1 minute timeframe MACD
only taking longs when all emas are in the correct order and there is a bigger than usual MACD downtick and the RSI is above 51
only taking shorts when all emas are in the opposite order and there is a bigger than usual uptick on the MACD and the RSI is bellow 49
bigger than usual ticks are defined by bollinger bands around the Macd and the ticks have to be higher than 35 and lower than -10
you can change whatever setting you like to make the strategy more profitible. pls share when you find a more profitible setting than me
the stoploss doesnt work correct if it would be hit in the same candle you enter the trade. pls share when you have a solution for this
the stratagy is profitible when i backtested it for the last month, but i dont know how it will play out in the future, so you enter the signals at your own risk

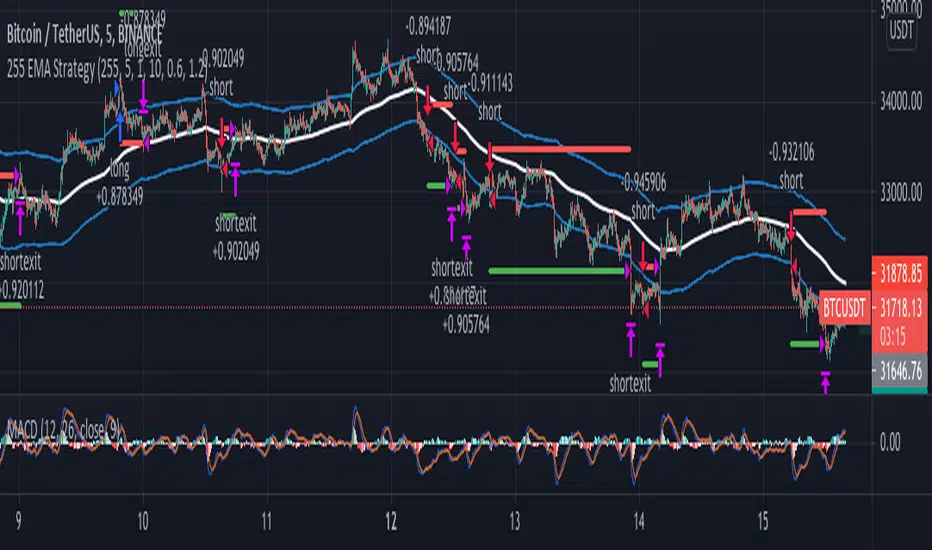
255 EMA Strategy//--- From 15 Trading Examples by Trader Alyx ---
// Seems like this strategy works better if we reverse the EMA filter logic.
// "Description: This basic scalping strategy allows you to enter the market based upon sentiment
// provided by the EMA, set at 255 periods. When price is trading below the 255 EMA, you would
// look to enter a LONG BUY positions, and when price is trading above the 255 EMA, you would
// look to enter a SELL SHORT position. The MACD lagging indicator will show you clear signals for
// when to do this. When the MACD lines cross in a bullish manner and price is below the 255
// EMA, buy. When the MACD lines cross in a bearish manner and price is above the 255 EMA,
// sell.
// NOTE: Make sure that price is trading away from the 255EMA before entering a LONG or SHORT
// position. As you can see in the chart below, the clearest signs for trade entry were presented
// when price was trading AWAY from the 255EMA"
MACd+200EMAIndicator used:
MACD default values.
EMA 200
How the script works:
When MACD line Crosses the signal line below the 0 histogram value while candles are above 200EMA a buy signal generated .
When signal line Crosses the MACD line below above 0 histogram value while candles are below 200EMA a buy signal generated .
Default SL and TP:
By default I have set TP =20 pips and SL=20pips
How to manage the trades:
You can manage the trades according to your own rules.
This script shows only the BUY and SELL signal generation and EXIT points when the trade reach 20 pips profit or loss

MACD Trendprediction Strategy V1A trend following indicator based on the MACD and EMA. In this case, signals are not generated by crossing the signal lines as with the MACD, but as soon as the distance between the signal lines increases or decreases. A profit factor of 1.6-3.5 is achieved.
Ein Trendfolge-Indikator, auf der Basis des MACD und EMA. Dabei werden Signale nicht wie bei dem MACD per Kreuzung der Signallinien generiert, sondern sobald ein der Abstand der Signallinien zu oder abnimmt.

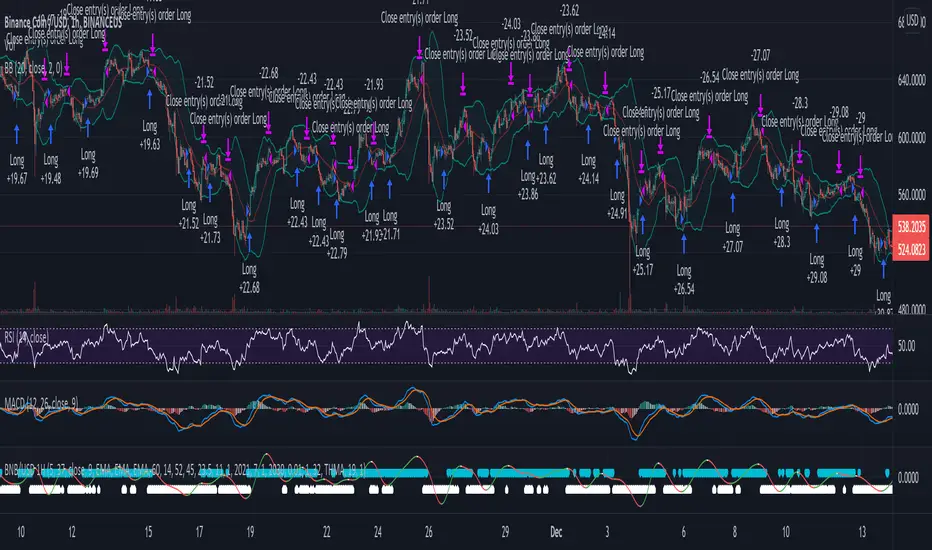
3commas BNB/USD 1H Strategy*** DISCLAIMER ***
This script is speculative - it uses a highly aggressive model and may not make you money. It has worked well for me so far but you need to do your own DD and make your own decisions. I accept no liability for anything that happens as a result of using this script. Use this at your own caution.
My first published work! I took a few concepts I found in other scripts, tweaked them to match what I had in mind, added some ideas of my own and then added 3commas hooks. Essentially this script is a variable MACD indicator with linear regression and a lot of curve smoothing. It will buy and sell like any other MACD indicator, though it won't exactly match the MACD line you will see on regular MACD indicators due to the smoothing and linear regression. The stop loss should prevent the biggest losses though you will still lose some rounds as this is very aggressive. The parameters I have set up here work best for BNB however feel free to experiment with other coins. The linear regression is set high by default which is what I've found works best for BNB/USD.
Charts should be set to BNB/USD 1HR. I used Binance.us as I was building this but you should have success using other exchanges that offer BNB as well.
This script is set up to use with a 3commas DCA bot though you need access to the entire script in order for that to happen. You can add it and manually place orders or use alarms to test. If you want full access so you can set your 3commas alerts, message me and we can figure something out!
SmoothOps v1 - StrategyThe purpose of this script was to fine tune an indicator on BTCUSDT. I think the results speak for themselves.
This is a script that uses the MACD to predict future price movement. The original MACD signal lags too much for my taste so I went searching for something that could give signals sooner. I decided a smooth macd would help filter out noise and grabbing the highest values and lowest values over the past number of bars. I spent several days backtesting different settings and combinations of signals to arrive at what you see now. This strategy has been fine tuned for BTC/USDT on Binance, so I suggest you only use it for that. Any other coin/pair and exchange will need a new backtest since the data will be different. This is not a generalized indicator like everything else. It's specifically good at one thing: prediction BTCUSDT on Binance.
Use this in combination with the Study version so you can visually see what is happening when you change settings.
How to use:
Use only on BTCUSDT Binance
Set the preset to the timeframe you want. I HIGHLY suggest only using the 1h timeframe. It gives the best profit over time
Set the preset to custom if you want to try using your own settings.
You can change the source input if you want. ohlc4 usually works best for 1h
Change the date range if you want to do a specific timeframe.
Change the stop loss % if you want, but I didn't find much of a difference when using it on 1h

MACD + Stochastic + RSI (Long + Short)My strategy uses a combination of three indicators MACD Stochastic RSI .
The Idea is to GO LONG when ( MACD > Signal and RSI > 50 and Stochastic > 50) occures at the same time
and GO SHORT when ( MACD < Signal and RSI < 50 and Stochastic < 50)
This strategy works well on futures and stocks especially during market breaking up after consolidation
The best results are on Daily charts , so its NOT a scalping strategy. But it can work also on 1H charts.
The strategy does not have any stops and profit targets, so we can take all the market can give us at the moment.
The exit point only when MACD goes under/over Signal line
Its Preformance is quite stable.
So, use it, trade it.
If it will help you to imprive your trading results, please donate me
BTC: 12kd1F8buWisUBdq27BBwRkUvzW7Ey3og5

MACD + Stochastic + RSI StrategyMy strategy uses a combination of three indicators MACD Stochastic RSI.
The Idea is to buy when (MACD > Signal and RSI > 50 and Stochastic > 50) occures at the same time
This strategy works well on stocks and cryptos especially during market breaking up after consolidation
The best results are on Daily charts, so its NOT a scalping strategy. But it can work also on 1H charts.
The strategy does not have any stops and profit targets, so we can take all the market can give us at the moment.
The exit point only when MACD goes under Signal
Its Preformance is quite stable.
So, use it, trade it.
If it will help you to imprive your trading results, please donate me
BTC: 12kd1F8buWisUBdq27BBwRkUvzW7Ey3og5
