Polychromatic Momentum IndicatorPolychromatic Momentum is a generalized Momentum study considering a number of Momentum values controlled by the length input. The greatest weight is given to the most recent Momentum value, while the precedent values are given lesser weight. Each Momentum value is assigned weight equal to inverse square root of Momentum distance (number of bars prior to the current bar). Then the sum of the weighted Momentum values is divided by the sum of the square roots.
Recherche dans les scripts pour "momentum"

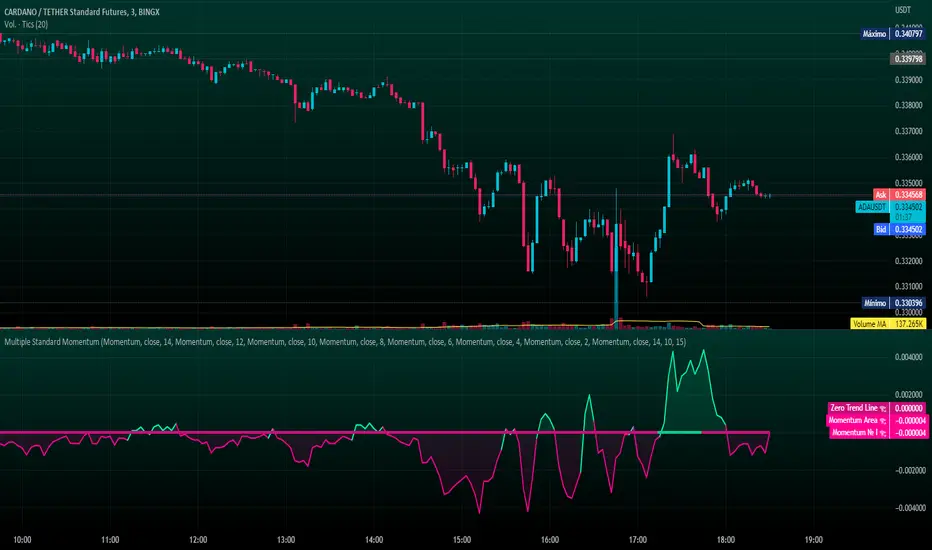
Multiple Standard MomentumMultiple Standard Momentum
The momentum indicator is a technical indicator that measures the speed and strength of the price movement of a financial asset. This indicator is used to identify the underlying strength of a trend and predict potential changes in price direction.
The calculation of the momentum indicator is based on the difference between the current price and the price of a previous period. The result is displayed on a chart, which can be positive or negative, depending on whether the current price is higher or lower than the price of the previous period. The indicator can be used on any time frame, but is generally used on short-term charts.
To use the momentum indicator , you look for two types of signals:
🔹 Crossover Signal – When the indicator crosses the zero line, it can signal a change of direction in the price trend.
🔹 Divergence – When the asset price moves in one direction and the indicator moves in the opposite direction, a divergence can be identified. This divergence may indicate a possible trend reversal.
COMPOSITION AND MODE OF USE OF THE INDICATOR
🔹 This indicator displays multiple Momentum levels on a single chart, allowing you to view multiple Momentum lines. Each level is represented on the chart where it can be hidden or shown as desired for better market analysis.
🔹 In addition, a zero trend line (also known as a horizontal trend line) has been added. The zero trend line is a horizontal line that indicates the point at which the current price equals the opening price, which allows users to draw a custom zero trend line on the chart using different colors and time periods of calculation.
* Highest performing custom setup for the Zero Trend Line. For Operations of:
- One Minute: Trend Line Time Frame = Five Minutes.
- Three Minutes: Trend Line Time Frame = Fifteen Minutes.
- Five Minutes: Trend Line Time Frame = Thirty Minutes.
- Fifteen Minutes: Trend Line Time Frame = Sixty Minutes.
Rules For Trading
🔹 Bullish:
* The Zero Trend Line must be in Green Color.
* When the Momentum Line Crosses the Zero Line from Bottom to Top.
🔹 Bearish:
* The Zero Trend Line must be in Red Color.
* When the Momentum Line Crosses the Zero Line from Top to Bottom.
In addition, parameters were defined to activate or deactivate the graphic signal taking into account the previous requirement (Bullish and Bearish):
🔹 Long or Buy = ▲
🔹 Short or Sell = ▼
This script can be used in different markets such as forex, indices, and cryptocurrencies for analysis and trading. However, it is important to note that no trading strategy is guaranteed to be profitable, and traders should always conduct their own research and risk management.
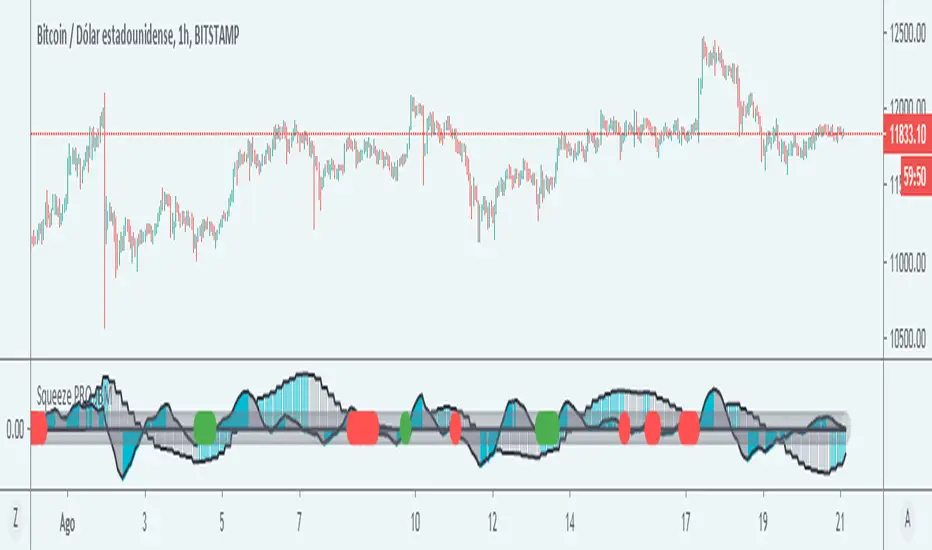
SQUEEZE MOMENTUM PRO - JBMCredits
I am not the author of the original script from which this indicator was based, the script was based on the Squeeze Momentum Indicator by the author LazzyBear
Description
The squeeze momentum PRO is a modification of an existing script that allows you to see the market movements in the form of waves, this indicator allows you to use two squeezes in a chart, the first corresponding to the current timeframe and the second to a greater timeframe. In this way it allows to operate in the direction of the greater temporality but with the impulse of the current movement of the graph.
Its main characteristic is that it provides a signal to the trader in the form of a symbol on the starter, when the indicator shows a green alert it means that both indicators are in a bullish direction so there is a probability that the price will rise, while a red symbol indicates that both temporalities show a bearish direction, so a bearish movement is more likely
The greater temporality is calculated by multiplying the current temporality, for example 1 hour, multiplied by 4, then the greater squeeze temporality will give the momentum of the 4-hour temporality, that the greater momentum will always be four times greater than the current temporality, although this can be changed in the settings.
The signals are not completely reliable so it must be used in conjunction with other indicators or analysis that allows the trader to filter the signals in a better way.
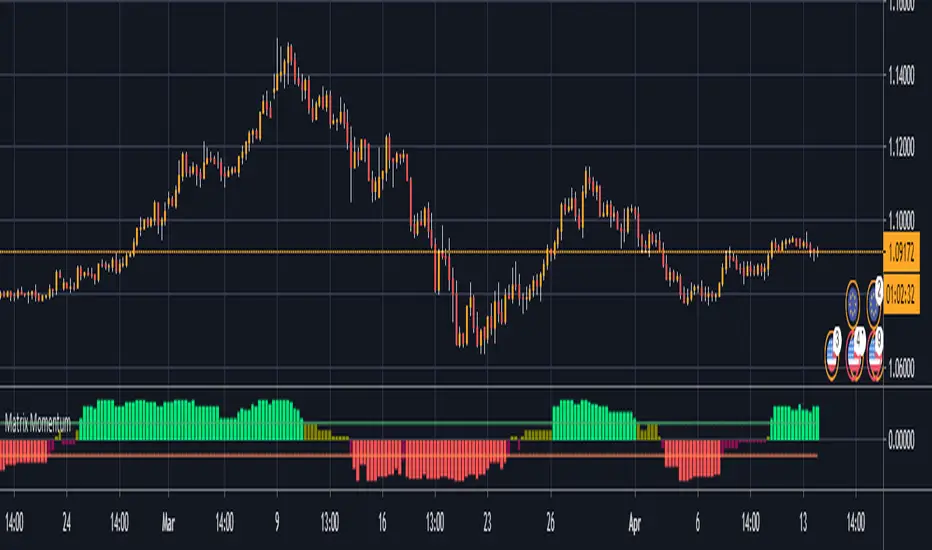
matrix momentum packageThis indicator gives a score to the momentum of a market in a percentage term based on a combination of measurements, this can be used on any time frame, on any instrument to identify if the current trend has enough momentum to see it carry on further this will help eliminate fomo and also help you to identify reversals in the chart at the right time so you can eliminate exposure to a market about to reverse, there is 4 levels to this indicator you have a strong bullish trend denote by green bars the weaker bullish trend denoted by the olive coloured bars, a weak bearish trend which is given in maroon bars and a strong bearish trend which gives red bars you will also note the 2 horizontal boundary lines these are not overbought and oversold bounds like in most indicators but actually indicate whether there is sufficient momentum in the market as the idea is that in strong momentum you want it to be above or below this line to give you confidence there is momentum available to ride
Prometheus' Momentum SMAThis is a price momentum indicator that calculates the change in price momentum over time with a simple moving average to use as a potential profit taking mechanism.
The lookback period is for calculating the momentum plot on the chart. It measures the closing price between the current candle and the candle X periods ago. (orange line)
The indicator also has a simple moving average of the momentum plotted on the chart. (gray line with background fill)
Future versions will include multitimeframe signals and alertconditions.

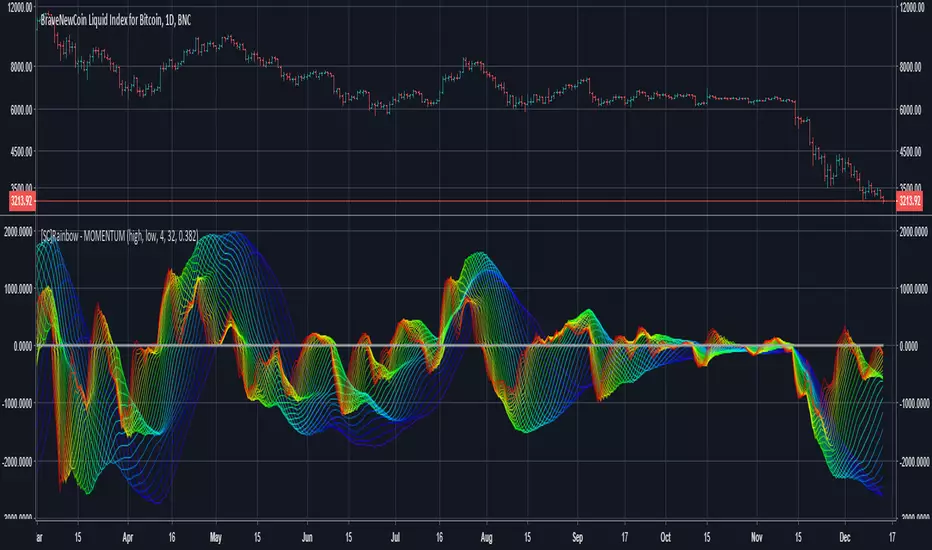
[SC]Rainbow - MOMENTUMThis indicator calculates and displays 31 momentum lines between "min period" and "max period".
Positive momentum is calculated using the high value.
negative momentum is calculated using the low value.
smooth factor is used for smoothing values.
"ema(ema(momentum value, momentum period*smooth factor), momentum period*smooth factor)"
EMA Ribbon + ADX MomentumHere's a description for your TradingView indicator publication:
The EMA Ribbon + ADX Momentum indicator combines exponential moving averages (EMA) with the Average Directional Index (ADX) to identify strong trends and potential trading opportunities. This powerful tool offers:
🎯 Key Features:
EMA Ribbon (10, 21, 34, 55) for trend direction
ADX integration for trend strength confirmation
Clear visual signals with color-coded backgrounds
Real-time trend status display
Strength metrics with exact percentage values
📊 How It Works:
EMA Ribbon: Four EMAs form a ribbon pattern that shows trend direction through their stacking order
ADX Integration: Confirms trend strength when above the threshold (default 25)
Visual Signals:
Green background: Strong bullish trend
Red background: Strong bearish trend
Gray background: Neutral or weak trend
📈 Trading Signals:
STRONG BULL: EMAs properly stacked bullish + high ADX + DI+ > DI-
STRONG BEAR: EMAs properly stacked bearish + high ADX + DI- > DI+
BULL/BEAR TREND: Shows regular trend conditions without strength confirmation
NEUTRAL: No clear trend structure
🔧 Customizable Parameters:
ADX Length: Adjust trend calculation period
ADX Threshold: Modify strength confirmation level
ADX Panel Toggle: Show/hide the ADX indicator panel
💡 Best Uses:
Trend following strategies
Entry/exit timing
Trade confirmation
Market structure analysis
Risk management tool
This indicator helps traders identify not just trend direction, but also trend strength, making it particularly useful for both position entry timing and risk management. The clear visual signals and real-time metrics make it suitable for traders of all experience levels.
Note: As with all technical indicators, best results are achieved when used in conjunction with other forms of analysis and proper risk management.

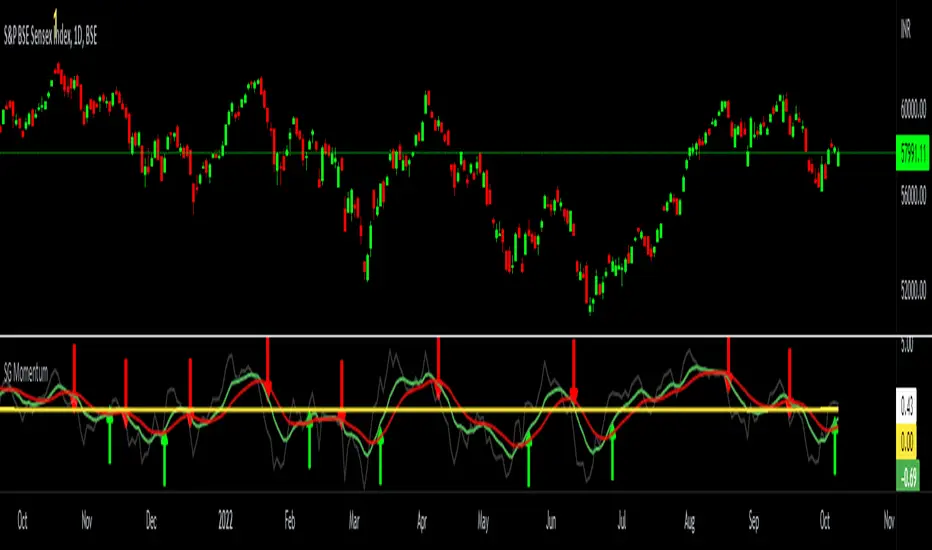
SG MomentumHello All,
I have made a momentum indicator based on the distance from exponential moving average. This captures both buy and sell cycles effectively. The logic is to calculate the distance of closing price from an exponential moving average ( I use 13 period - You are free to choose any other period) - this is the dim grey line which you can toggle off too. Then I smoothen this by calculating a 9-period EMA of the same (the green line). I further slow it down by another 9-period EMA of the same ( the red line). Now when the green lines crosses the red line from below 0 it signifies a new bull cycle and vice versa for bear cycle. This works across all timeframes. I have marked few signals in the below chart for your reference.
Inside Bar Momentum Alerts v1Alerts for Inside Bar Momentum Strategy
Purple Diamonds show IBs
triangles at top show long alerts
triangles at bot show short alerts


Alpha Protocol v2 [High Precision] - Trend Following & Momentum Description: This strategy is designed for swing traders operating in the NSE (National Stock Exchange) or other high-volume equity markets. It utilizes a classic Trend Following approach filtered by institutional liquidity requirements and momentum confirmation.
The Core Philosophy: The "Alpha Protocol" is built on the premise that the strongest moves occur when price action aligns with the primary trend, supported by volume and volatility contraction. It aims to capture the "meat" of the move while strictly limiting downside risk.
Technical Architecture:
Trend Filter: The strategy only takes long positions when the 50-DMA is above the 200-DMA, and the 200-DMA slope is positive (rising).
Momentum triggers:
RSI (14): Must be in the bullish zone (55-75) but not overheated.
MACD: Requires a bullish crossover or positive histogram expansion.
ADX: Must be > 20 to ensure we are not trading in a choppy/sideways market.
Liquidity Filter: To ensure realistic execution, the script requires a minimum daily turnover (Price * Volume) of ₹5 Crores (configurable).
Price Action: Entries are triggered on a breakout of the 20-day high, confirmed by a strong close in the upper 30% of the daily range.
Risk Management (Hard Coded):
Stop Loss: Placed at the recent 10-day Swing Low.
Circuit Breaker: If the Swing Low is more than 5% away from the entry price, the trade is ignored (Capital Protection Rule).
Profit Target: Dynamic 1:2 Risk-Reward Ratio.
Instructions for Use:
Timeframe: Daily (D) is recommended.
Universe: Liquid Mid-caps and Large-caps (Nifty 500).
Alerts: This script is alert-compatible. Use the "Alert() function calls" option to receive precise Entry, Stop, and Target prices on your device.
Disclaimer: This script is for educational and backtesting purposes only. Past performance does not guarantee future results.

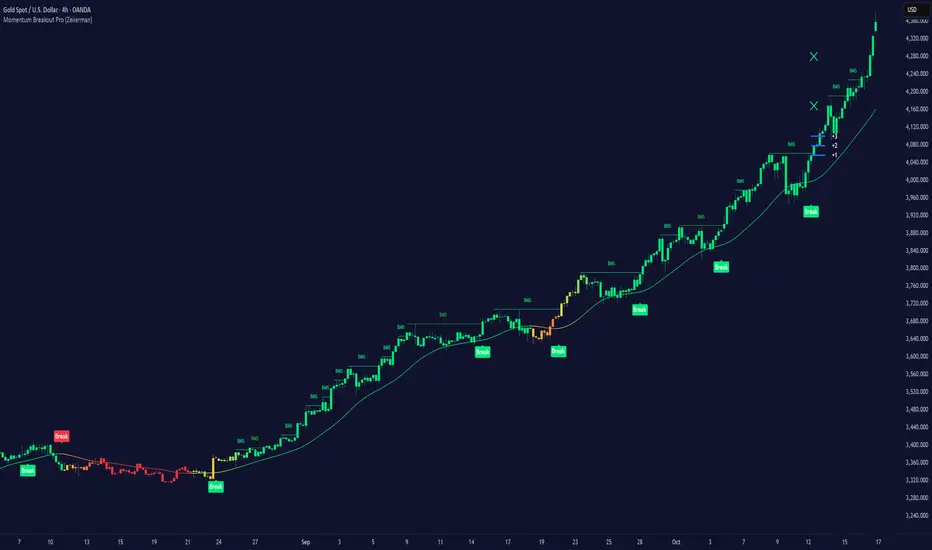
Momentum Breakout Pro (Zeiierman)█ Overview
Momentum Breakout Pro (Zeiierman) is a breakout-focused quantitative system engineered to identify only the strongest momentum expansions in the market. Instead of reacting to price movement, it reconstructs a refined momentum signal, evaluates its strength and persistence, and validates each breakout against the broader market context. Only when momentum pressure aligns with structural direction, trend state, candle behavior, and spacing requirements will a breakout be considered qualified.
The result is a clean and context-aware signal flow that removes noise and highlights only the breakouts with the highest probability of continuation. Traders receive precise Break signals at qualified points, adaptive trend lines, candle-based trend visualization, structure levels, and volatility-driven confirmation markers. Internally, the system operates as a layered confirmation model designed to enforce directional consensus and filter out the shallow or unreliable moves that typically weaken breakout strategies.
In short, Momentum Breakout Pro offers a refined breakout selection system that focuses on quality over quantity, designed for traders who want clean and well-supported breakout signals backed by structured technical logic.
⚪ Why This One Is Unique
Momentum Breakout Pro’s uniqueness comes from its multi-layered confirmation process. The internal momentum reconstruction ensures that only sustained directional pressure is considered meaningful. Optional filters such as Dynamic Trend, SuperTrend, Average Trend, VWAP, and Market Structure provide an adjustable decision stack, allowing traders to decide how strict or flexible the validation should be. Breakouts are released only when the enabled components agree.
█ Main Features
⚪ Breakout Signals
The Breakout Signals are the core feature of the indicator. They help traders identify high probability breakouts that are more likely to follow through. With built-in confirmation levels, it becomes much easier to judge whether a breakout is strong or likely to fail. Combined with the suggested take profit points, traders can quickly find confirmed breakout opportunities with realistic first profit targets.
⚪ Breakout Filters
The indicator includes multiple filters that align each breakout with the current trend, structure, and momentum. This is essential for identifying only the strongest and most reliable breakout setups.
⚪ Dynamic Trend
The Dynamic Trend is a volatility-aware long-term trend filter. It removes noise and adapts to sharp volatility swings, staying focused on the true underlying trend direction. This helps traders avoid false signals and remain aligned with the broader market drift.
⚪ Moving Average
A standard moving average with a user-defined length. Simple, effective, and easy to understand. It acts as a clean trend filter for both beginners and advanced traders.
⚪ Super Trend
A Super Trend filter that restricts breakout signals to appear only in the direction of the active SuperTrend. This adds an additional layer of directional confirmation.
⚪ VWAP
VWAP (Volume Weighted Average Price) is a powerful anchor, especially on lower timeframes. It serves as a dynamic support or resistance level and a highly reliable trend filter.
⚪ Candle Coloring
The candle coloring engine tracks how long the price has moved in one direction and translates that persistence into a graded bull, mid, or bear color spectrum. This helps traders quickly understand trend strength, confirm momentum, and allow the market enough space to move before a larger breakout occurs.
⚪ Momentum
The momentum filter identifies bursts of momentum and highlights the strongest correlations between price and movement strength. It filters out weak breakouts that are not backed by real momentum, improving accuracy significantly.
⚪ Market Structure
Trading with the current market structure is crucial. This filter ensures that breakout signals appear only when they align with the existing structure, helping traders stay on the right side of the market.
█ How to Use
⚪ Breakouts
Use this tool to identify high-quality breakouts. To increase accuracy, combine the breakout signals with the trend, structure, and momentum filters. When these elements align, the probability of a successful breakout increases significantly.
⚪ Confirmation Levels
The indicator includes three confirmation levels that adapt based on current market volatility.
These levels help you judge the strength of the breakout:
When the three levels are tight and close to the price, it indicates strong conditions. Price is more likely to break through all levels quickly and confirm the breakout.
When the levels are spread out and far from the price, the breakout becomes weaker. Price must travel too far to confirm the move, which lowers the probability of a clean follow-through.
What you want to see is a breakout where all three confirmation levels are penetrated within the next few candles. That is the ideal scenario, indicating a confirmed breakout with a higher chance of continuation in that direction.
⚪ Take Profit Strategy
The indicator includes built-in take profit levels, which act as your first two targets after a confirmed breakout:
Once Take Profit 1 is hit, move your stop loss to break even.
When Take Profit 2 is hit, move your stop loss to the first take profit level.
From there, allow the position to run until the candle coloring shifts, signaling that momentum may be slowing or reversing.
This approach helps you secure profits early, reduce risk, and stay in the trade for larger moves when the trend is strong.
█ Setting Realistic Expectations: Win-Rate and Risk–Reward
Research on breakout systems, trend-following strategies, and directional volatility all show the same behavioral pattern. Win rates tend to be moderate, while risk and reward are positively skewed. Most breakout attempts are tested quickly by the market and may result in small losses or breakeven trades. The real edge comes from the smaller group of breakouts that expand into multi-stage moves and generate significantly larger gains. This is a well-established characteristic of momentum-driven price dynamics.
Momentum Breakout Pro is designed to work within this framework. It is not built to win on every signal, but to highlight conditions that historically align with stronger follow-through. The tool provides structure levels, confirmation lines, and initial target markers to help traders measure extension and manage risk objectively. Actual results will vary depending on the filters enabled, the markets traded, and how stops and exits are managed. However, the overall expectation remains consistent with established breakout research: frequent smaller outcomes combined with fewer but more impactful winners.
█ How It Works
⚪ Breakout System
The breakout system detects emerging directional expansions by transforming price movement into a stabilized signal curve. It evaluates localized impulse strength, directional bias, and short-term acceleration to determine when the price is exerting statistically meaningful pressure in one direction. When this pressure breaches the system’s internal thresholds, a breakout candidate is registered.
Calculation: Price is processed through a multi-stage smoothing pipeline to construct a normalized signal curve. The script analyzes the curve’s gradient and micro-momentum characteristics within a compact evaluation window. A breakout event is triggered when these combined directional metrics exceed the system’s momentum-pressure threshold.
⚪ Momentum Confirmation
To prevent weak or premature breakouts, the system verifies that momentum behavior aligns with the directional expansion. This ensures that only breakouts supported by sustained impulse strength are considered.
Calculation: The script evaluates the strength, stability, and directional consistency of momentum over the developing move. Instead of reacting to isolated shifts, it assesses whether momentum maintains a coherent and persistent trajectory that reinforces the breakout direction. A breakout is confirmed only when momentum structure and directional pressure are synchronized.
⚪ Confirmation Levels
Once a breakout is detected, three confirmation levels indicate how far the price must travel to confirm the breakout's strength.
Calculation: The levels are spaced using a volatility-adjusted distance formula. A breakout is considered strong when the price clears all three levels within a short time window.
⚪ Targets
Targets provide simple reference points for early take profits and risk management.
Calculation: The distance to a nearby structural or volatility-based reference is measured, then projected outward as proportional 1R / 2R style levels.
-----------------
Disclaimer
The content provided in my scripts, indicators, ideas, algorithms, and systems is for educational and informational purposes only. It does not constitute financial advice, investment recommendations, or a solicitation to buy or sell any financial instruments. I will not accept liability for any loss or damage, including without limitation any loss of profit, which may arise directly or indirectly from the use of or reliance on such information.
All investments involve risk, and the past performance of a security, industry, sector, market, financial product, trading strategy, backtest, or individual's trading does not guarantee future results or returns. Investors are fully responsible for any investment decisions they make. Such decisions should be based solely on an evaluation of their financial circumstances, investment objectives, risk tolerance, and liquidity needs.
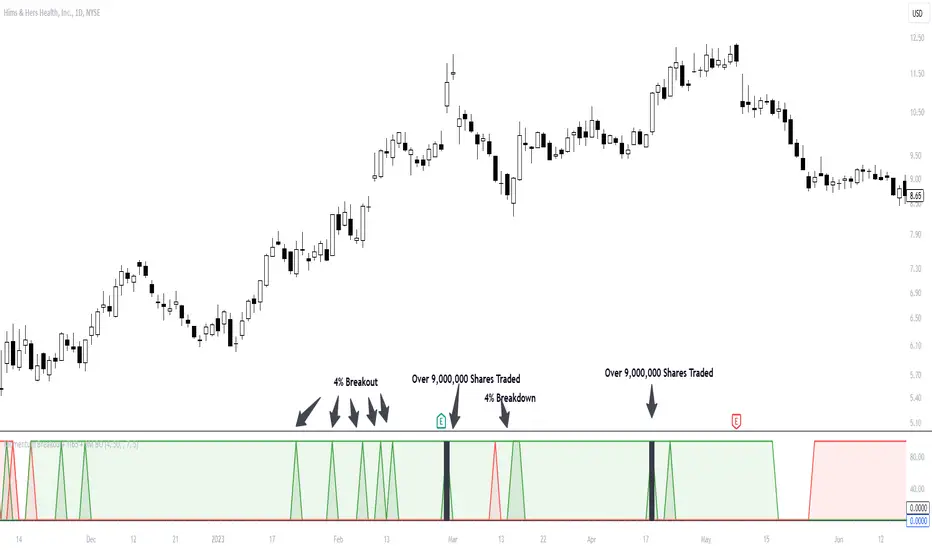
Ollie_allcaps Momentum IndicatorMomentum is created when a security makes a large move on higher-than-average volume. Momentum shows the rate of change in price movement over a period of time to help investors determine the strength of a trend.
This indicator will create a green spike once price advances 4% and is trading above the 50-day average trading volume. However, if the stock begins to breakdown (-4% or greater on above average volume), a red spike will be created.
These green and red spikes represent a change in momentum that occurs in the selected security.
This indictor should be used in 2 ways:
1: What are the charecteristics of this stock? Does it breakdown shortly after a momentum spike? or does the security trend in orderly manner after a momentum spike?
2: Investers should use this indicator to determine the strength of a momentum breakout in real time. Has the stock made a large move, but with no significant volume?
Customization:
The Percentage move, and average daily volume can be changed as well as colors.
Alerts:
If you wish to set an alert, this indicator allows you to create an alert when the selected stock meets your desired criteria.
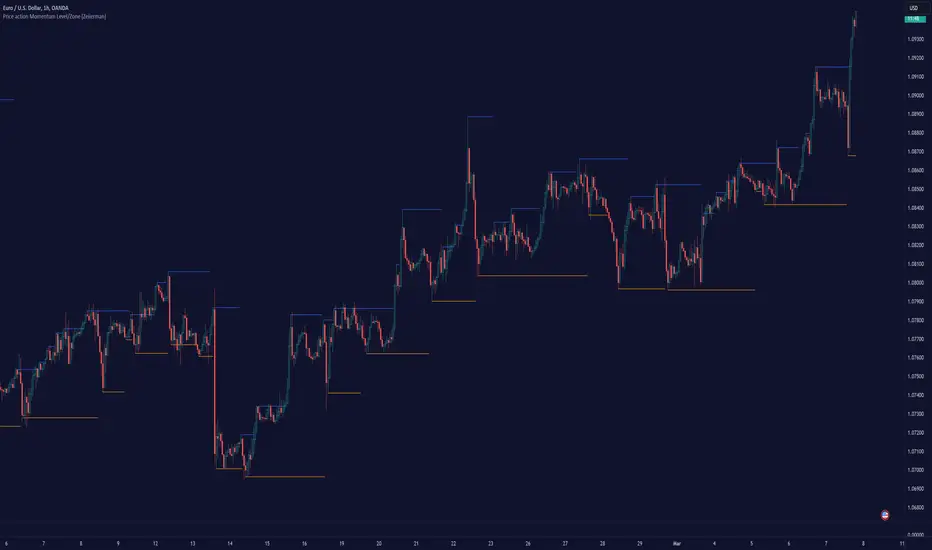
Price action Momentum Level/Zone (Expo) Price action Momentum Levels/Zones (Expo) indicator identifies relatively stronger Up and Down Momentum. This is visualized by a Zone, or Levels or with Barcolors depending on which settings are used.
When the market has relatively stronger momentum it can be a sign that the sellers or buyers are exhausted and the market has to pause, make a pullback, or make a trend shift.
HOW TO USE
1. Use the indicator to identify relatively stronger momentum.
2. Use the indicator to identify pullbacks or trend shifts.
3. Use the indicator to buy/short-sell breakouts of the zones.
4. Use the indicator to buy/short-sell when the price re-test the zones.
INDICATOR IN ACTION
4 hour chart
I hope you find this indicator useful , and please comment or contact me if you like the script or have any questions/suggestions for future improvements. Thanks!
I will continually work on this indicator, so please share your experience and feedback as it will enable me to make even better improvements. Thanks to everyone that has already contacted me regarding my scripts. Your feedback is valuable for future developments!
ACCESS THE INDICATOR
• Contact me on TradingView or use the links below
-----------------
Disclaimer
Copyright by Zeiierman.
The information contained in my scripts/indicators/ideas does not constitute financial advice or a solicitation to buy or sell any securities of any type. I will not accept liability for any loss or damage, including without limitation any loss of profit, which may arise directly or indirectly from the use of or reliance on such information.
All investments involve risk, and the past performance of a security, industry, sector, market, financial product, trading strategy, or individual’s trading does not guarantee future results or returns. Investors are fully responsible for any investment decisions they make. Such decisions should be based solely on an evaluation of their financial circumstances, investment objectives, risk tolerance, and liquidity needs.
My scripts/indicators/ideas are only for educational purposes!
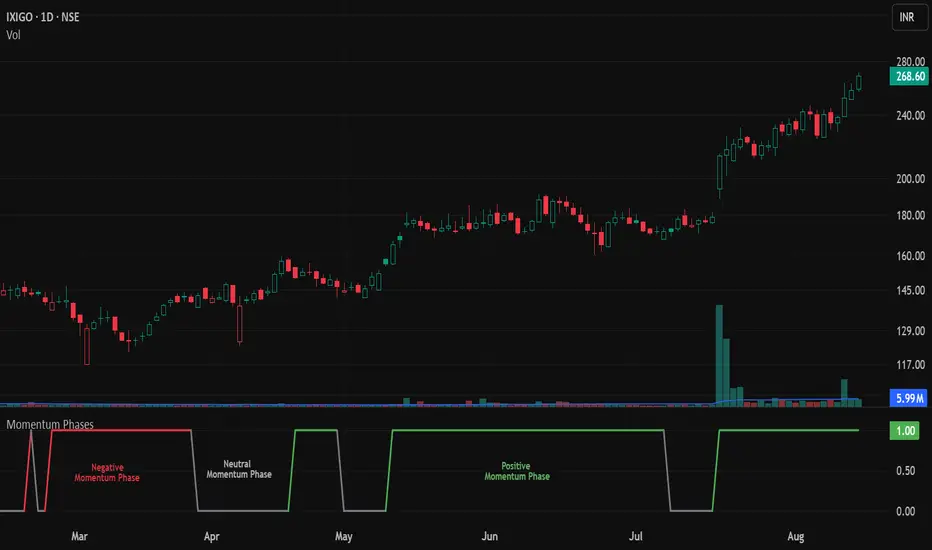
Momentum Phases📌 Overview
The Momentum Phases indicator helps traders quickly identify periods of strong bullish or bearish momentum based on the relationship between a short‑term and a long‑term Moving Average (SMA).
It helps traders visually distinguish between Positive 🟢 , Negative 🔴 , and Neutral ⚪ phases by plotting a dynamically colored state line and generating optional alerts when a phase change occurs.
🧠 How It Works
⦿ SMA Calculation
The indicator calculates two SMAs:
Short SMA (default: 7 periods)
Long SMA (default: 65 periods)
Both SMA lengths can be adjusted by the user.
// SMA calculations
smaShort = ta.sma(close, shortLen)
smaLong = ta.sma(close, longLen)
⦿ Momentum Ratio
A ratio is calculated:
ratio = smaShort / smaLong
This ratio measures how far the short‑term trend has diverged from the long‑term trend.
⦿ Threshold Levels
Positive Threshold (default: 1.05) — indicates short SMA is at least 5% above the long SMA.
Negative Threshold (default: 0.95) — indicates short SMA is at least 5% below the long SMA.
These thresholds are user‑adjustable.
⦿ Momentum States
Positive Momentum: Ratio ≥ Positive Threshold (default: 1.05) → Short SMA is at least 5% above Long SMA.
Negative Momentum: Ratio ≤ Negative Threshold (default: 0.95) → Short SMA is at least 5% below Long SMA.
Neutral: Ratio between the two thresholds.
⦿ State Line Plot
The indicator plots a flat state line at 1.0 when in positive or negative momentum, and 0.0 when in neutral.
The state line’s color changes dynamically:
Green 🟢 Positive Momentum: Ratio ≥ Positive Threshold (default: 1.05) – Short SMA is at least 5% above Long SMA.
Red 🔴 Negative Momentum: Ratio ≤ Negative Threshold (default: 0.95) – Short SMA is at least 5% below Long SMA.
Gray ⚪ Neutral: Ratio between the two thresholds.
📈 How to Use
Trend Confirmation: Use the state line color to quickly confirm the prevailing momentum.
Green 🟢: Consider focusing on long setups
Red 🔴: Consider focusing on short setups
Gray ⚪: Consider staying neutral or waiting for stronger signals
Trade Filtering: Filter trades in your existing strategy so they only align with the detected momentum phase.
Early Warnings: Enable phase change alerts to get notified when market conditions shift.
⚙️ Customization
SMA Periods: Adjust short and long SMA lengths to suit your trading timeframe.
Thresholds: Tighten (closer to 1.00) for more frequent signals, or widen for fewer but stronger signals.
🔔 Alerts
🟢 Positive Momentum START – Stock/Security shifts into positive momentum.
⚪ Positive Momentum END – Positive momentum ends (neutral state).
🔴 Negative Momentum START – Market shifts into negative momentum.
⚪ Negative Momentum END – Negative momentum ends (neutral state).
Momentum Phase Change – Any shift between Positive, Negative, or Neutral.
🎯 Add this indicator to your chart to track momentum phases like a pro — know exactly when trends start, end, or stall.
Freebird Flow MomentumHello, TradingView Comm;
This is a simple "3-Speed" Momentum Flow Tracker.
It is designed to give traders early signal to shifts of Buy/Sell Momentum-over-Time at all timeframes for the purpose of targeting accurate entry/exit on the micro, while still maintaining full integrity and viability while macro timeframe charting.
This indicator adds in a separate pane by default.
It can, and was designed to however, be combined with your Price Chart. IF you choose to do so:
- Fixed Center Alignment + Price Pan "Bonus": '0.00'-line acts as a "Net" indicator. When Zero line above median of pane, Sellers are the "Net" winners of the candles in view, and vice versa. The distance from center indicates Magnitude of Net Imbalance.
Recommended Opacity Settings:
- Histogram: 20-25%
- Cloud: 33-40%
Relative Strength and MomentumRelative Strength and Momentum Indicator
Unlock deeper market insights with the Relative Strength and Momentum Indicator—a powerful tool designed to help traders and investors identify the strongest stocks and sectors based on relative performance. This custom indicator displays essential information on relative strength and momentum for up to 15 different symbols, compared against a benchmark index, all within a clear and organized table format.
Key Features:
1. Customizable Inputs: Choose up to 15 symbols to compare, along with a benchmark index, allowing you to tailor the indicator to your trading strategy. The 'Lookback Period' input defines how many weeks of data are analyzed for relative strength and momentum.
2. Relative Strength Calculation: For each selected symbol, the indicator calculates the Relative Strength (RS) against the chosen benchmark. This RS is further refined using an exponential moving average (EMA) to smooth the results, providing a more stable trend overview.
3. Momentum Analysis: Momentum is determined by analyzing the rate of change in relative strength. The indicator calculates a momentum rank for each symbol, based on its relative strength’s improvement or deterioration.
4. Percentile Ranking System: Each symbol is assigned a percentile rank (from 1 to 100) based on its relative strength compared to the others. Similarly, momentum rankings are also assigned from 1 to 100, offering a clear understanding of which assets are outperforming or underperforming.
5. Visual Indicators:
a. Green: Signals improving or stable relative strength and momentum.
b. Red: Indicates declining relative strength or momentum.
c. Aqua: Highlights symbols performing well on both relative strength and momentum—ideal candidates for further analysis.
6. Two Clear Tables:
a. Relative Strength Rank Table: Displays weekly rankings of relative strength for each symbol.
b. Momentum Table: Shows momentum trends, helping you identify which symbols are gaining or losing strength.
7. Color-Coded for Easy Analysis: The tables are color-coded to make analysis quick and straightforward. A green color means the symbol is performing well in terms of relative strength or momentum, while red indicates weaker performance. Aqua marks symbols that are excelling in both areas.
Use Case:
a. Sector Comparison: Identify which sectors or indexes are showing both relative strength and momentum to pick high-potential stocks. This allows you to align with broader market trends for improved trade entries.
b. Stock Selection: Quickly compare symbols within the same sector to find the stronger performers.

Momentum Memory Indicator
The Momentum Memory Indicator (MMI) is a custom tool designed to predict future price movements based on the historical momentum of an asset. By calculating the Rate of Change (ROC) and then averaging it over a specified "memory" period, the MMI provides a prediction that reflects both recent and slightly older momentum data. The prediction is visualized as a histogram, with colors indicating the direction of the momentum.
**Parameters:**
1. **Rate of Change Period (ROC Period):** This parameter sets the period for the Rate of Change calculation, which measures the momentum of the asset. The default value is 14.
2. **Memory Period:** This parameter determines the period over which the average momentum is calculated. By considering momentum over this "memory" period, the indicator aims to provide a more stable and reliable prediction. The default value is 5.
**Logic:**
1. **Rate of Change (Momentum):** The ROC is calculated based on the asset's closing prices over the specified ROC period. It provides a measure of how much the price has changed over that period, indicating momentum.
2. **Average Momentum:** The average momentum is calculated by taking a simple moving average (SMA) of the ROC values over the memory period. This smoothens out the momentum data and provides a more stable value for prediction.
3. **Prediction:** The prediction is calculated by adjusting the current closing price based on the average momentum. This gives an estimate of where the price might be in the next period, assuming the momentum continues.
4. **Prediction Color:** The color of the prediction histogram is determined by the direction of the average momentum. A positive momentum results in a green histogram, while a negative momentum results in a red histogram.
**Plots:**
1. **Prediction (Histogram):** Represents the predicted price movement based on the average momentum. The direction and magnitude of the histogram bars provide insights into the expected price change. The color of the bars (green or red) indicates the direction of the momentum.
Momentum Bias Index [AlgoAlpha]Description:
The Momentum Bias Index by AlgoAlpha is designed to provide traders with a powerful tool for assessing market momentum bias. The indicator calculates the positive and negative bias of momentum to gauge which one is greater to determine the trend.
Key Features:
Comprehensive Momentum Analysis: The script aims to detect momentum-trend bias, typically when in an uptrend, the momentum oscillator will oscillate around the zero line but will have stronger positive values than negative values, similarly for a downtrend the momentum will have stronger negative values. This script aims to quantify this phenomenon.
Overlay Mode: Traders can choose to overlay the indicator on the price chart for a clear visual representation of market momentum.
Take-profit Signals: The indicator includes signals to lock in profits, they appear as labels in overlay mode and as crosses when overlay mode is off.
Impulse Boundary: The script includes an impulse boundary, the impulse boundary is a threshold to visualize significant spikes in momentum.
Standard Deviation Multiplier: Users can adjust the standard deviation multiplier to increase the noise tolerance of the impulse boundary.
Bias Length Control: Traders can customize the length for evaluating bias, enabling them to fine-tune the indicator according to their trading preferences. A higher length will give a longer-term bias in trend.

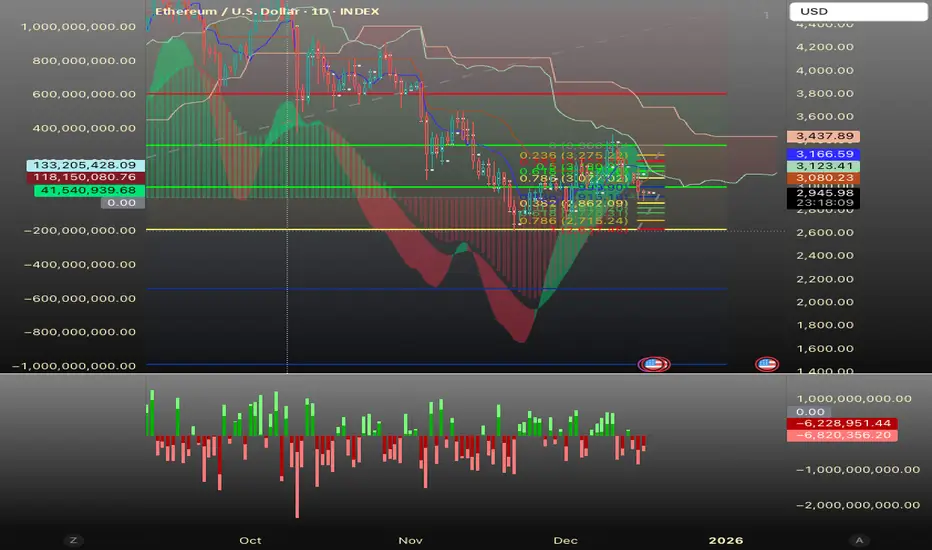
Momentum Variance OscillatorWhat MVO measures:
-PV (Price-Volume) Oscillator – how far price is from a volatility-scaled basis, then weighted by relative volume.
- > 0 = bullish pressure; < 0 = bearish pressure.
-|PV| larger ⇒ stronger momentum.
-Signal line (EMA of PV) – a smoother track of PV; crossings flag momentum shifts.
-Zero line gradient – instantly shows direction (greenish bull / reddish bear) and strength (paler → stronger).
-Extreme bands (±obLevel) – “hot zone” thresholds; being beyond them = exceptional push.
-Variance histogram – MACD-like view (PV minus slower PV-EMA) to see thrust building vs. fading.
-(Optional) Bar coloring & background tint – paints price bars and/or the panel on key events so you can read the regime at a glance.
-Auto-Tune – searches a grid of (obLevel, weakLvl) pairs and (optionally) auto-applies the best, ranked by CAGR vs. drawdown.
Core signals & how to trade them:
1) Define the regime:
-Bullish regime: PV above 0 and/or PV above Signal; zero line is in bull gradient.
-Bearish regime: PV below 0 and/or PV below Signal; zero line is in bear gradient.
-Action: Prefer trades with the regime (avoid fading strong color/strength unless you have a clear reversal setup).
2) Entries:
Momentum entry:
-Long: PV crosses above Signal while PV > 0.
-Short: PV crosses below Signal while PV < 0.
Breakout/acceleration:
-Long add-on: PV crosses above +obLevel (extreme top) and holds.
-Short add-on: PV crosses below −obLevel (extreme bottom) and holds.
-Histogram confirm: Growing bars in your direction = thrust improving; shrinking/flip = thrust stalling.
3) Exits / risk:
-Soft exit / tighten stops: PV loses the extreme and re-enters inside, or histogram fades/turns against you.
-Hard exit / reverse: Opposite PV↔Signal crossover and PV crosses the zero line.
-Weak zone filter: If |PV| < weakLvl, treat signals as lower quality (smaller size or skip).
4) Practical setup - Suggested defaults (good starting point):
-Signal length: 26
-Volume power: 0.50
-obLevel (extreme): 2.00
-weakLvl: 0.75
-Show histogram & dots: On
-Auto-Tune (recommended)
-Turn Auto-Select Best ON. MVO will scan obLevel 1.50→3.00 (step 0.05) and weakLvl 0.50→1.00 (step 0.05), then use the top-ranked pair (CAGR/(1+MDD)).
-If you want to see the top combos, enable the Optimizer Table (Top-3).
5) Visual options
-Bar Colors: Regime+Strength – bars follow the zero-line gradient (great for quick read).
-Extremes – paint only when beyond ±obLevel.
-Cross Signals – paint only on the bar that crosses an extreme.
-Background on breach: A one-bar tint when PV crosses an extreme.
6) Example playbook:
Long setup:
-Zero line shows bull gradient and PV > 0.
-PV crosses above Signal (entry).
-If PV drives above +obLevel, consider add-on; trail under the last minor swing or use ATR.
-Exit/trim on PV crossing below Signal or histogram turning negative; flatten on a drop through 0.
Short setup mirrors the above on the bear side.
7) Tips to avoid common traps:
-Don’t fade strong extremes without clear confirmation (e.g., PV re-entering inside + histogram flip).
-Respect the weak zone: if |PV| < weakLvl, signals are fragile—size down or wait.
-Align with structure: higher-timeframe trend and SR improve expectancy.
-Instrument personality matters: use Auto-Tune or re-calibrate obLevel/weakLvl across assets/timeframes.
8) Alerts you can set:
-Bull Signal X – PV crossed above Signal
-Bear Signal X – PV crossed below Signal
-Bull Baseline X – PV crossed above 0
-Bear Baseline X – PV crossed below 0

Momentum Index [BigBeluga]The Momentum Index is an innovative indicator designed to measure the momentum of price action by analyzing the distribution of positive and negative momentum values over a defined period. By incorporating delta-based calculations and smoothing techniques, it provides traders with a clear and actionable representation of market momentum dynamics.
🔵 Key Features:
Delta-Based Momentum Analysis:
Calculates the momentum of price by comparing its current state to its value from a defined number of bars back.
Inside a loop, it evaluates whether momentum values are above or below zero, producing a delta value that reflects the net momentum direction and intensity.
Double EMA Smoothing:
Smooths the raw delta-based momentum values with a double EMA filter, reducing noise and providing a clearer trend signal.
tmi(len) =>
sum = 0.0
sum1 = 0.0
above = 0.0
below = 0.0
src_ = src - src
for i = 0 to len
sum := sum + (src_ > nz(src_ ) ? 1 : -1)
sum1 := sum1 + (sum > 0 ? 1 : -1)
sum1 := emaEma(sum1, 10)
for i = 1 to len
above := above + (sum1 > 0 ? 1 : 0)
below := below + (sum1 > 0 ? 0 : 1)
Directional Momentum Signals:
Generates momentum shift signals and displays them on both the oscillator and the main chart:
- △ Aqua Triangles: Represent upward momentum shifts.
- ▽ Red Triangles: Represent downward momentum shifts.
Dynamic Gradient Display:
Highlights momentum zones with gradient fills:
- Aqua shades for positive momentum (above zero).
- Red shades for negative momentum (below zero).
Dashboard Display:
A dashboard summarizing the count of momentum values above and below zero for the defined period (Sentiment Length e.g. 100), helping traders assess market sentiment at a glance.
🔵 How It Works:
The indicator takes price momentum as its source and evaluates the number of momentum values above and below zero within a defined period.
The delta calculation aggregates this information, providing a net representation of the prevailing market momentum.
A double EMA filter is applied to the delta values, smoothing the momentum line and enhancing signal clarity.
Momentum shifts are highlighted with visual signals on the oscillator and price chart, while the gradient display provides a visual representation of intensity.
🔵 Use Cases:
Momentum Tracking: Identify whether market momentum is predominantly bullish or bearish.
Signal Confirmation: Use chart-based signals to confirm potential trend reversals or continuation.
Analyze Market Strength: Leverage the dashboard to quickly assess the distribution of momentum over the chosen period.
Overbought/Oversold Conditions: Utilize gradient zones to detect areas of momentum extremes and possible price exhaustion.
Momentum Index offers a refined approach to analyzing momentum dynamics, combining delta-based calculations with smoothing techniques and intuitive visuals, making it an essential tool for traders looking to anticipate market movements effectively.

Momentum Shift [Bigbeluga]
This indicator identifies momentum shifts using a smoothed momentum calculation. It plots dynamic shift zones consisting of five levels that expand or contract based on price action. When momentum rises, the indicator creates an upward shift zone, and when momentum falls, it generates a downward shift zone. The shift zones dynamically react to price, stopping extension when a level is crossed.
🔵Key Features:
Smoothed Momentum Calculation:
➣ Utilizes a Hull Moving Average (HMA) to smooth momentum and reduce noise.
➣ Identifies momentum shifts with crossovers between the current momentum value and its previous state.
➣ Uses a gradient color scheme to highlight momentum strength.
Dynamic Shift Zones:
➣ When momentum rises, the indicator plots an upper shift zone with five incremental levels.
➣ When momentum falls, a lower shift zone is formed with five descending levels.
➣ Each level within the shift zone represents a progressively stronger momentum shift.
Level Extension Control:
➣ Shift zones stop extending once a level is crossed by price.
➣ Levels closer to price act as key momentum resistance or support zones.
➣ If price retraces after a shift, the remaining levels stay intact for further reference.
Momentum Direction Indications:
➣ Labels (▲ and ▼) appear at momentum shift points to indicate rising or falling momentum.
🔵Usage:
Momentum-Based Entries: Identify momentum shifts early by using shift zones as confirmation for trade entries.
Trend Continuation & Exhaustion: Observe which shift levels price respects—if momentum shift zones hold, the trend may continue; if they break, momentum may reverse.
Dynamic Support & Resistance: Use the five-level shift zones as temporary support and resistance areas that adapt to momentum shifts.
Momentum Strength Analysis: If price moves through multiple shift levels in one direction, it signals strong momentum in that direction.
Momentum Shift is a powerful tool for traders looking to analyze momentum shifts with structured visual zones. By combining smoothed momentum calculations with dynamic shift zones, this indicator provides a clear view of market momentum and helps traders navigate price action effectively.
