Binary Options Pro Helper By Himanshu AgnihotryThe Binary Options Pro Helper is a custom indicator designed specifically for one-minute binary options trading. This tool combines technical analysis methods like moving averages, RSI, Bollinger Bands, and pattern recognition to provide precise Buy and Sell signals. It also includes a time-based filter to ensure trades are executed only during optimal market conditions.
Features:
Moving Averages (EMA):
Uses short-term (7-period) and long-term (21-period) EMA crossovers for trend detection.
RSI-Based Signals:
Identifies overbought/oversold conditions for entry points.
Bollinger Bands:
Highlights market volatility and potential reversal zones.
Chart Pattern Recognition:
Detects double tops (sell signals) and double bottoms (buy signals).
Time-Based Filter:
Trades only within specified hours (e.g., 9:30 AM to 11:30 AM) to avoid unnecessary noise.
Visual Signals:
Plots buy and sell markers directly on the chart for ease of use.
How to Use:
Setup:
Add this script to your TradingView chart and select a 1-minute timeframe.
Signal Interpretation:
Buy Signal: Triggered when EMA crossover occurs, RSI is oversold (<30), and a double bottom pattern is detected.
Sell Signal: Triggered when EMA crossover occurs, RSI is overbought (>70), and a double top pattern is detected.
Timing:
Ensure trades are executed only during the specified time window for better accuracy.
Best Practices:
Use this indicator alongside fundamental analysis or market sentiment.
Test it thoroughly with historical data (backtesting) and in a demo account before live trading.
Adjust parameters (e.g., EMA periods, RSI thresholds) based on your trading style.
Recherche dans les scripts pour "pro"

MTF RSI+CMO PROThis RSI+CMO script combines the Relative Strength Index (RSI) and Chande Momentum Oscillator (CMO), providing a powerful tool to help traders analyze price momentum and spot potential turning points in the market. Unlike using RSI alone, the CMO (especially with a 14-period length) moves faster and accentuates price pops and dips in the histogram, making price shifts more apparent.
Indicator Features:
➡️RSI and CMO Combined: This indicator allows traders to track both RSI and CMO values simultaneously, highlighting differences in their movement. RSI and CMO values are both plotted on the histogram, while CMO values are also drawn as a line moving through the histogram, giving a visual representation of their relationship. The often faster-moving CMO accentuates short-term price movements, helping traders spot subtle shifts in momentum that the RSI might smooth out.
➡️Multi-Time Frame Table: A real-time, multi-time frame table displays RSI and CMO values across various timeframes. This gives traders an overview of momentum across different intervals, making it easier to spot trends and divergences across short and long-term time frames.
➡️Momentum Chart Label: A chart label compares the current RSI and CMO values with values from 1 and 2 bars back, providing an additional metric to gauge momentum. This feature allows traders to easily see if momentum is increasing or decreasing in real-time.
➡️RSI/CMO Bullish and Bearish Signals: Colored arrow plot shapes (above the histogram) indicate when RSI and CMO values are signaling bullish or bearish conditions. For example, green arrows appear when RSI is above 65, while purple arrows show when RSI is below 30 and CMO is below -40, indicating strong bearish momentum.
➡️Divergences in Histogram: The histogram can make it easier for traders to spot divergences between price and momentum. For instance, if the price is making new highs but the RSI or CMO is not, a bearish divergence may be forming. Similarly, bullish divergences can be spotted when prices are making lower lows while RSI or CMO is rising.
➡️Alert System: Alerts are built into the indicator and will trigger when specific conditions are met, allowing traders to stay informed of potential entry or exit points based on RSI and CMO levels without constantly monitoring the chart. These are set manually. Look for the 3 dots in the indicator name.
How Traders Can Use the Indicator:
💥Identifying Momentum Shifts: The RSI+CMO combination is ideal for spotting momentum shifts in the market. Traders can monitor the histogram and the CMO line to determine if the market is gaining or losing strength.
💥Confirming Trade Entries/Exits: Use the real-time RSI and CMO values across multiple time frames to confirm trades. For instance, if the 1-hour RSI is above 70 but the 1-minute RSI is turning down, it could indicate short-term overbought conditions, signaling a potential exit or reversal.
💥Spotting Divergences: Divergences are critical for predicting potential reversals. The histogram can be used to spot divergences when RSI and CMO values deviate from price action, offering an early signal of market exhaustion.
💥Tracking Multi-Time Frame Trends: The multi-time frame table provides insight into the market’s overall trend across several timeframes, helping traders ensure their decisions align with both short and long-term trends.
RSI vs. CMO: Why Use Both?
While both RSI and CMO measure momentum, the CMO often moves faster with a value of 14 for example, reacting to price changes more quickly. This makes it particularly effective for detecting sharp price movements, while RSI helps smooth out price action. By using both, traders get a clearer picture of the market's momentum, particularly during volatile periods.
Confluence and Price Fluidity:
One of the powerful ways to enhance the effectiveness of this indicator is by using it in conjunction with other technical analysis tools to create confluence. Confluence occurs when multiple indicators or price action signals align, providing stronger confirmation for a trade decision. For example:
🎯Support and Resistance Levels: Traders can use RSI+CMO in combination with key support and resistance zones. If the price is nearing a support level and RSI+CMO values start to signal a bullish reversal, this alignment strengthens the case for entering a long position.
🎯Moving Averages: When the RSI+CMO signals a potential trend reversal and this is confirmed by a crossover in moving averages (such as a 50-day and 200-day moving average), traders gain additional confidence in the trade direction.
🎯Momentum Indicators: Traders can also look for momentum indicators like the MACD to confirm the strength of a trend or potential reversal. For instance, if the RSI+CMO values start to decrease rapidly while both the RSI+CMO also shows overbought conditions, this could provide stronger confirmation to exit a long trade or enter a short position.
🎯Candlestick Patterns: Price fluidity can be monitored using candlestick formations. For example, a bearish engulfing pattern with decreasing RSI+CMo values offers confluence, adding confidence to the signal to close or short the trade.
By combining the MTF RSI+CMO PRO with other tools, traders ensure that they are not relying on a single indicator. This layered approach can reduce the likelihood of false signals and improve overall trading accuracy.

F.B_Vortex Indicator ProThe "F.B_Vortex Indicator Pro" is a technical analysis tool designed to identify trends in financial markets. It calculates two Vortex Indicators (VI) based on price movements, considering positive and negative price changes.
The smoothed VI+ line represents the smoothed negative trend, while the smoothed VI+ line represents the smoothed positive trend.
The crossing of the smoothed VI+ line above the smoothed VI+ line could indicate a potential bullish trend.
Conversely, the crossing of the smoothed VI+ line above the smoothed VI+ line suggests a possible bearish trend.
The "Smoothed VI-" line is also displayed.
When the Smoothed VI- line is above both the smoothed VI+ line and the smoothed VI+ line, it may signal a transition to a bearish main trend or indicate an expected one.
When the Smoothed VI- line is below both the smoothed VI+ line and the smoothed VI+ line, it may indicate a transition to a bullish main trend or suggest an expected one.
Adjustments can be made using input parameters such as length and smoothing periods to tailor the indicator to specific market conditions.

Support & Resistance PROHi Traders!
The Support & Resistance PRO
A simple and effective indicator that helped me a bunch!
This indicator will chart simple support and resistance zones on 2 time frames of your choice.
It uses a 30 day lookback period and will find the last high and low.
Each zone is built from the highest/lowest closure, and the highest/lowest wick, creating a liquid zone between the 2.
It is perfect for people trading support and resistance, watching key areas, scalping zones and much more!
*You can change the time frames you are looking at and the lookback period.
*The example in the picture is looking at the Daily and Weekly zones on BTC.

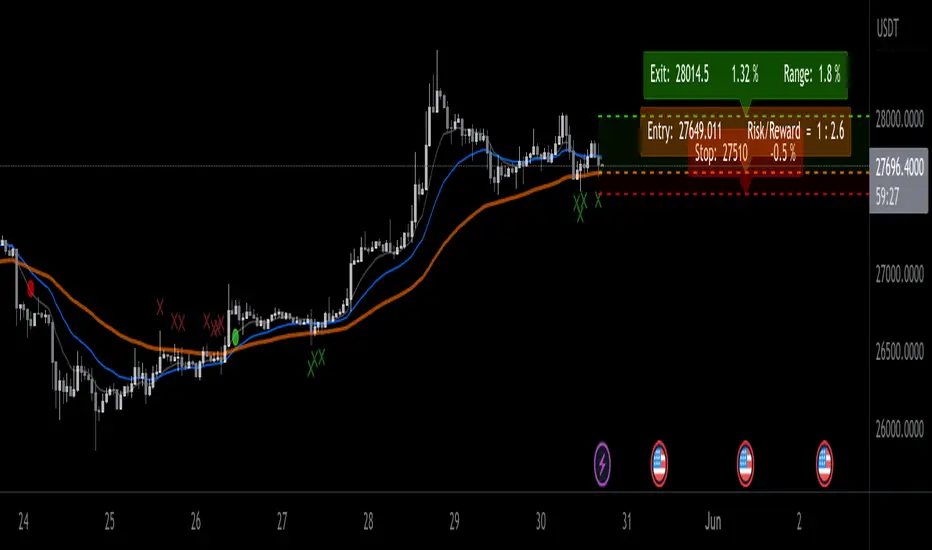
EMA ProHi Traders!
This Improved EMA Cross Pro Indicator does a few things that Ease Up Our Charting.
Personally it Saved me Tons of Time searching for structure highs / lows, measuring ranges and distances from my entry to stop or take profit.
It's like having most of your trade in front of you, charted for you.
Works Across Assets & Time Frames.
The Functions
1. Signals EMA Crosses - green for Bull Cross & Red for Bear Cross
2. Signals Touches to the 55 EMA
a. In a Bull Cross it will only signal touches and closes Above the 55
b. In a Bear Cross it will only signal touches and closes Under the 55
3. Plots Current Horizontals:
a. The current position of the 55
b. The last High & Low
4. Calculation:
a. % from the 55 to the High & Low
b. Risk / Reward Ratio ("Bad Risk Management" message appears if ratio is not favorable)
c. Over Range between the Low and the High
5. Labels - Current prices for all horizontals marked as Entry, Exit & Stop
Notes:
* This Indicator is Interchanging between bull and bear crosses, it recognizes the trend and adapts its high and low output.
* You Can and Should make your personal changes. everything can be changed in the settings inputs.
* You can Turn On & Off most functions in the settings inputs.
BYBIT:BTCUSDT.P
Litt Internals ProThe Litt Internal Pro is based on the four major U.S. Equity Indexes. This is to not be used for any other markets. If you need more information on any of the indexes, you can google or watch YouTube videos on what they are. Typically if we are looking for to be long we want to see all four of the indexes green and have buy ratings. If we are looking to be short we want to see all four of the indexes red and have sell ratings. If you see Overbought or Oversold ratings it may be best to wait for a pullback to get long or not take the trade at all.
For the stocks that you trade, you should know what index they are in. The reason for this is that you can still take trades if not all four indexes are aligned the same color. For example, maybe small caps (IWM) are on a hot streak and seeing buying momentum from institutions meanwhile tech (QQQ), is being sold. If you held a long in a company that is in IWM then you could be more comfortable holding your long position. Meanwhile, if you held a long position in a stock that is in QQQ then you might want to cut your loss or take profit. There are multiple different use cases for this indicator so it is best to look for outside resources on more information on the indexes and what stocks are in each index. This can be a very powerful tool to see sector rotation by hedge funds and institutions.

Scalp ProScalp Pro is a scalping tool that uses the MACD mechanism. MACD lines are smoothed using fibonacci numbers and pi numbers. In this way, the noise on the signal is reduced. A " BUY " signal is generated when the lines cross upwards. If the lines cross down, a " SELL " signal is generated. The logic is very simple and the Indicator is very useful.
I wish you many profitable trades.

Boom Hunter ProBoom Hunter Pro is the ultimate indicator for targeting perfect long entries and epic shorts. Boom Hunter comes with a super fast oscillator that uses Ehlers Early Onset Trend (EOT). This is the Center Of Gravity Oscillator (COG) with a super smoothing filter and a roofing filter. This indicator is tuned for 1 hour charts but can be used on any time frame.
Colored bars can be turned on to assist in finding an entry. Purple signifies a drag and potential dump.
Fibonacci lines can be turned on to track price action and find entries/exit.
This indicator follows the same rules as COG. For more information please see my COG HOWTO here:

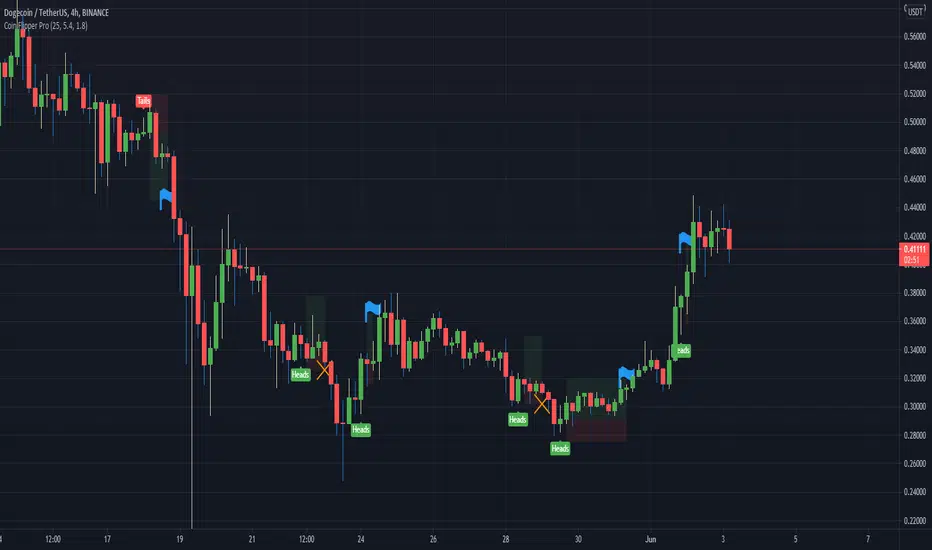
Coin Flipper Pro with strategy testerConverted the script "Coin Flipper Pro" into a Strategy. The same random "Coin Flip" trading fun with new features. Now users can run back test on the random trades and see how adjusting the risk to reward ratio affects the over all win rate and the profit of each trade. The Back test can be enabled or disabled in the settings along with the option to choose specific dates to run the test. Enjoy!

Coin Flipper ProHave you ever wondered how your win rate compares with flipping a coin? Well now you can check with Coin Flipper Pro!
This script produces a random position direction like flipping a coin and sets up a long or short trade based on you desired risk % and target ratio.
Have fun!
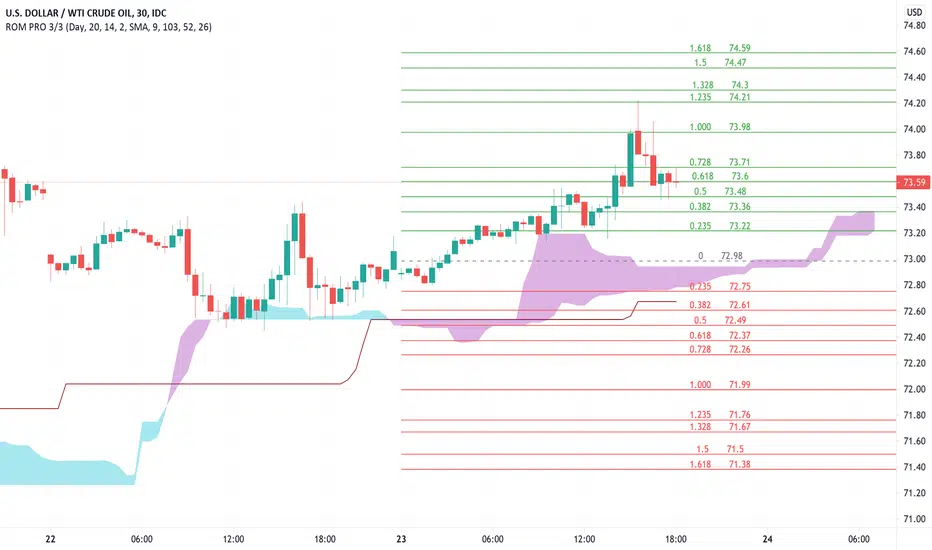
Rain On Me PRO 3/3This is the part 3 of Rain On Me PRO. It follow my two other indicators "Rain On Me" and "Rain On Me V2". This version is called "PRO" because it is less "user-friendly" than the two previous versions. But it is more faster, and cleaner than ever!
This indicator is separated into 3 parts. You can find all parts into my profile in the « Scripts » section. Once the 3 parts together, the indicator is complete.
Here are the features for this part:
-MTF Fibonacci on 10 levels with level 0 in the middle and an "info panel" to indicate you the key levels. You can set an alert for each level cross.
-MTF High/Low (Red dots is last low and green dots is last high).
-Bollinger.
-Ichimoku Cloud with baseline (red) and alerts (SenkouA and SenkouB Cross or Tenkan and Kijun Cross).
Everything is fully customizable in settings.
To place an alert, always choose the "Once per bar" option.
Many functions are still to come. So don't hesitate to report bugs, suggestions and follow me to always be kept informed of the next updates to come!
//ALWAYS DELETE INDICATOR AND ALERTS AND RESET THEM AFTER AN UPDATE!
Thank again everyone for your support!
A BIG THANKS TO QUANTNOMAD FOR GIVING ME ITS AUTHORIZATION TO USE, MODIFY AND REPUBLIC ITS "Ultimate Pivot Points Alerts" script indicator:
Good trade everyone! And remember, money management is the most important!
Rain On Me PRO 2/3This is the part 2 of Rain On Me PRO. It follow my two other indicators "Rain On Me" and "Rain On Me V2". This version is called "PRO" because it is less "user-friendly" than the two previous versions. But it is more faster, and cleaner than ever!
This indicator is separated into 3 parts. You can find all parts into my profile in the « Scripts » section. Once the 3 parts together, the indicator is complete.
Here are the features for this part:
-Support/Resistance and Range lines (Red is Resistance, Yellow is Range, Green is Support).
-MTF Trend Line following the trend with red color for bearish trend and green color for bullish trend (Based on volume so it work only where the volume information flux is available).
-MTF Fractals with alerts. (Zigzag based on high and low).
Everything is fully customizable in settings.
To place an alert, always choose the "Once per bar" option.
Many functions are still to come. So don't hesitate to report bugs, suggestions and follow me to always be kept informed of the next updates to come!
//ALWAYS DELETE INDICATOR AND ALERTS AND RESET THEM AFTER AN UPDATE!
Thank again for your support!
Good trade everyone! And remember, money management is the most important!

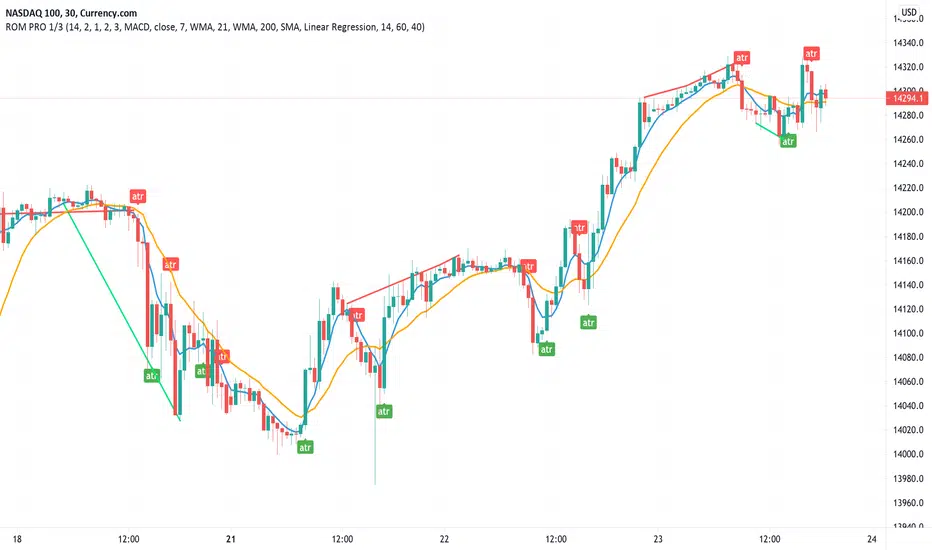
Rain On Me PRO 1/3This is the part 1 of Rain On Me PRO. It follow my two other indicators "Rain On Me" and "Rain On Me V2". This version is called "PRO" because it is less "user-friendly" than the two previous versions. But it is more faster, and cleaner than ever!
This indicator is separated into 3 parts. You can find all parts into my profile in the « Scripts » section. Once the 3 parts together, the indicator is complete..
Here are the features for this part (no-repaint on this one):
-ATR with alerts (Buy and Sell signals).
-VPT with alerts (Buy and Sell signals).
-PSAR with alerts (Buy and Sell signals).
-SuperTrend with alerts (Buy and Sell signals).
-Doji with alert (A yellow arrow show you when a good Doji signal appear).
-Divergences on chart (Red is bearish or green is bullish) with multiple type of divergence (MACD, OBV, RSI or CCI) with alerts.
-Market Range Bar Filter Color. (You have to configure the TimeZone of the market in UTC and then it will show you blank bar where the volatility is low).
-3 Moving Averages with cross alert for MA1 and MA2.
Everything is fully customizable in settings.
To place an alert, always choose the "Once per bar" option.
Many functions are still to come. So don't hesitate to report bugs, suggestions and follow me to always be kept informed of the next updates to come!
//ALWAYS DELETE INDICATOR AND ALERTS AND RESET THEM AFTER AN UPDATE!
Thank again everyone for your support!
Good trade everyone! And remember, money management is the most important!
(NKC) MTF Squeeze Pro MultiTimeframe Squeeze Momentum Pro
Dots indicate squeeze
Fills indicate momentum

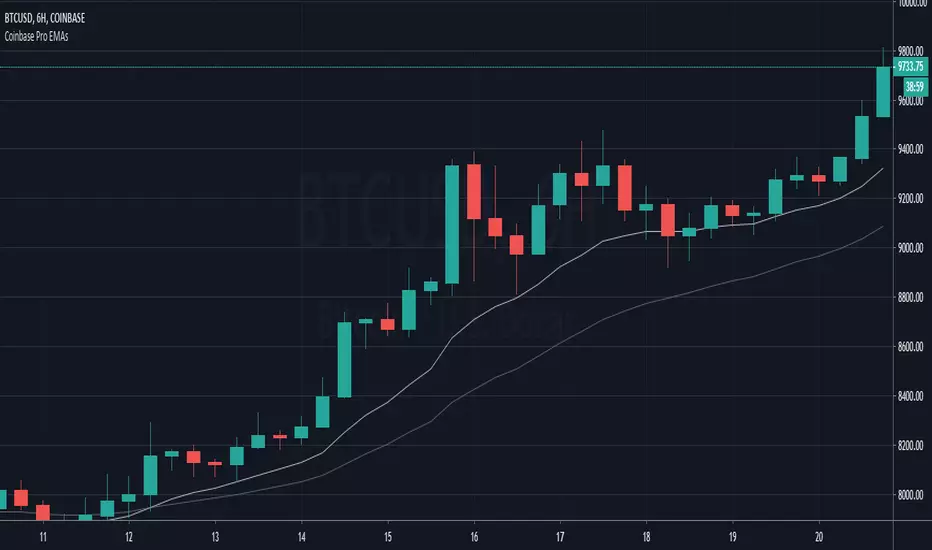
Coinbase Pro EMAsAn indicator to match the only overlays available on Coinbase Pro charts, the EMA12 and EMA26.

ACW PROACW PRO
ACW PIVOT SHORT SCRIPT + ACW CUSTOM MA SCRIPT
PROFITABLE TIMEFRAMES
15MIN
30MIN
H1-H4
D1,W1

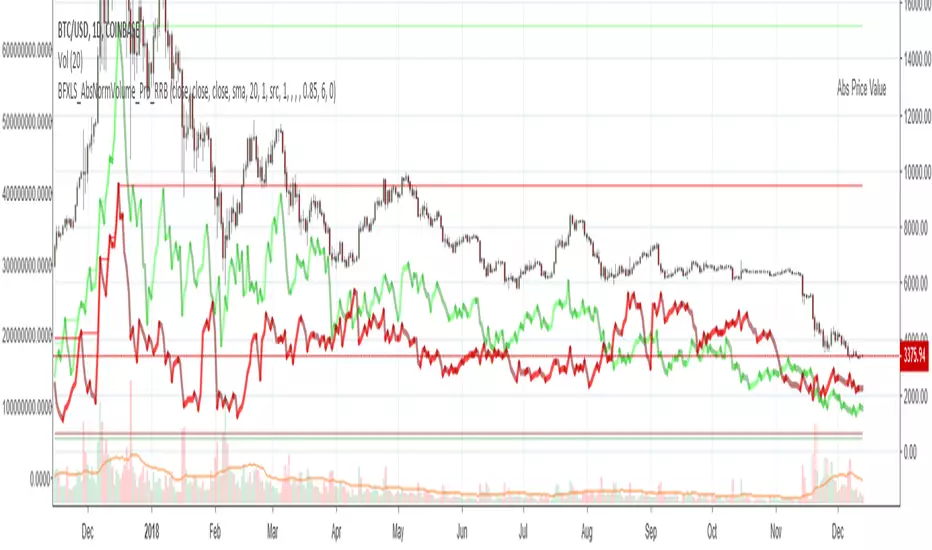
Chiki-Poki BFXLS Longs Shorts Abs Normalized Volume Pro by RRBChiki-Poki BFXLS Longs vs Shorts Absolute Normalized Volume Value Pro by RagingRocketBull 2018
Version 1.0
This indicator displays Longs vs Shorts in a side by side graph, shows volume's absolute price value and normalized volume of Longs/Shorts for the current asset. This allows for more accurate L/S comparisons (like a log scale for volume) since volume on spot exchanges (Bitstamp, Bitfinex, Coinbase etc) is measured in coins traded, not USD traded. Similarly, L/S is usually the amount of coins in open L/S positions, not their total USD value. On Bitmex and other futures exchanges volume is measured in USD traded, so you don't need to apply the Volume Absolute Price Value checkbox to compare L/S. You should always check first whether your source is measured in coins or USD.
Chiki-Poki BFXLS primarily uses *SHORTS/LONGS feeds from Bitfinex for the current crypto asset, but you can specify custom L/S source tickers instead.
This 2-in-1 works both in the Main Chart and in the indicator pane below. You can switch between Main/Sub Window panes using RMB on the indicator's name and selecting Move To/Pane Above/Below.
This indicator doesn't use volume of the current asset. It uses L/S ticker's OHLC as a source for SHORTS/LONGS volumes instead. Essentially L/S => L/S Volume == L/S
Features:
- Display Longs vs Shorts side by side graph for the current crypto asset, i.e. for BTCUSD - BTCUSDLONGS/BTCUSDSHORTS, for ETHUSD - ETHUSDLONGS/ETHUSDSHORTS etc.
- Use custom OHLC ticker sources for Longs/Shorts from different exchanges/crypto assets with/without exchange prefix.
- Plot Longs/Shorts as lines or candles
- Show/Hide L/S, Diff, MAs, ATH/ATL
- Use Longs/Shorts Volume Absolute Price Value (Price * L/S Volume) instead of Coins Traded in open L/S positions to compare total L/S value/capitalization
- Normalize L/S Volume using Price / Price MA / L/S Volume MA
- Supports any existing type of MA: SMA, EMA, WMA, HMA etc
- Volume Absolute Price Value / Normalize also works on candles
- Oscillator mode with negative axis (works in both Main Chart/Subwindow panes).
- Highlight L/S Volume spikes above L/S MAs in both lines/oscillator.
- Change L/S MA color based on a number of last rising/falling L/S bars, colorize candles
- Display L/S volume as 1000s, mlns, or blns using alpha multiplier
1. based on BFXLS Longs vs Shorts and Compare Style, uses plot*, security and custom hma functions
2. swma has a fixed length = 4, alma and linreg have additional offset and smoothing params
Notes:
- Make sure that Left Price Scale shows up with Auto Fit Data enabled. You can reattach indicator to a different scale in Style.
- It is not recommended to switch modes multiple times due to TradingView's scale reattachment bugs. You should switch between Main Chart and Sub Window only once.
- When the USD price of an asset is lower you can trade more coins but capitalization value won't be as significant as when there are less coins for a higher price. Same goes for Shorts/Longs.
Current ATH in shorts doesn't trigger a squeeze because its total value is now far less than before and we are in a bear market where it's normal to have a higher number of shorts.
- You should always subtract Hedged L/S from L/S because hedged positions are temporary - used to preserve the value of the main position in the opposite direction and should be disregarded as such.
- Low margin rates increase the probability of a move in an underlying direction because it is cheaper. High margin rates => the market is anticipating a move in this direction, thus a more expensive rate. Sudden 5-10x rate raises imply a possible reversal soon. high - 0.1%, avg - 0.01-0.02%, low - 0.001-0.005%
You can also check out:
- BFXLS Longs/Shorts on BFXData
- Bitfinex L/S margin rates and Hedged L/S on datamish
- Bitmex L/S on Coinfarm.online
Bars In a Row Counter Pro by RRBBars In a Row Counter Pro by RagingRocketBull 2018
Version 1.0
This indicator counts bars of the same color in a sequence (dojis included) and plots the resulting counts as histogram bars
1. based on barssince, uses plot function with histogram style
2. Min/Max Threshold is the upper and lower limits for counting bars. For example, you can look only for sequences of 5 to 10 bars of the same color in a row
3. Show Histogram Beyond Threshold - you can hide/change color of the non-important histogram part that exceeds the threshold
4. Show Threshold Bands - show the upper and lower limits as levels on the indicator
5. Show Min/Max Bands - show ATH max red/green bars in a row historic levels on the indicator
6. Count Red Bars - count red bars in a sequence, show/hide red bars on a histogram (you can exclude red bars and count only green bars)
7. Count Green Bars - count green bars in a sequence, show/hide green bars on a histogram (you can exclude green bars and count only red bars)
8. Invert Red Bars - show red and green histograms together on the same axis above zero (saves space)
Feel free to use. Good Luck!

Williams' Pro-GoNo idea what I am doing here. Trying to Program Williams Pro-Go as an indicator. Not familiar with Pine at all.

Pro HTF Last-Closed Levels (D / 4H / 1H) This is OHLC lines per one and 4 hour to track levels. simple and easy

PRO AI SUPER TREND JEETUNSE ENGINEIts super super super trend on the tradingview one of the best money making indicator

Pro Volume & Momentum Dashboard [CONFIRMED ENTRY v2.1]🎯 Key Upgrades in This Version:
1. 10-Point Confluence Scoring System
# Factor Description
1 Volume Spike RVOL ≥ threshold with directional candle
2 Volume Delta Buy vs Sell pressure analysis
3 VWAP Position Institutional fair value
4 200 EMA Macro trend alignment
5 EMA Stack 9 > 21 > 50 alignment
6 ADX Trend strength + direction
7 RSI Momentum confirmation
8 MACD Histogram momentum
9 HTF Trend Higher timeframe alignment
10 Candle Quality Strong body, minimal wicks
2. Confirmed Entry Logic
✅ Requires minimum 7/10 confluence score (adjustable)
✅ Waits for candle close to avoid fakeouts
✅ 5-bar cooldown prevents duplicate signals
✅ Potential setups warned when score is 5-6/10
3. Risk Management
Auto-calculated Stop Loss (ATR-based)
Two Take Profit levels (TP1 & TP2)
Visual risk zones on chart
Risk/Reward ratio displayed
4. Higher Timeframe Confirmation
Checks 1H (or custom) timeframe trend
Ensures trade aligns with bigger picture
📌 How to Use:
Wait for ◆ CONFIRMED BUY/SELL label (not triangles)
Check dashboard for 7+/10 score
Entry: On signal candle close
Stop Loss: Red line below/above
Take Profit: Green lines (scale out at TP1, full exit TP2)
🕯️ Candlestick Patterns Added
Bullish Patterns (11 Total)
Pattern Description Strength
Bullish Engulfing Green candle engulfs prior red ⭐⭐⭐ Strong
Hammer Long lower wick at bottom ⭐⭐ Medium
Morning Star 3-candle reversal pattern ⭐⭐⭐ Strong
Bullish Harami Small green inside large red ⭐⭐ Medium
Piercing Line Opens gap down, closes above mid ⭐⭐ Medium
Three White Soldiers 3 consecutive strong green candles ⭐⭐⭐ Strong
Dragonfly Doji Long lower wick, no body ⭐⭐ Medium
Tweezer Bottom Equal lows at support ⭐⭐ Medium
Bullish Marubozu Full body, no wicks ⭐⭐⭐ Strong
Rising Three Continuation after pullback ⭐⭐ Medium
Bearish Patterns (11 Total)
Pattern Description Strength
Bearish Engulfing Red candle engulfs prior green ⭐⭐⭐ Strong
Shooting Star Long upper wick at top ⭐⭐ Medium
Evening Star 3-candle reversal pattern ⭐⭐⭐ Strong
Bearish Harami Small red inside large green ⭐⭐ Medium
Dark Cloud Cover Opens gap up, closes below mid ⭐⭐ Medium
Three Black Crows 3 consecutive strong red candles ⭐⭐⭐ Strong
Gravestone Doji Long upper wick, no body ⭐⭐ Medium
Tweezer Top Equal highs at resistance ⭐⭐ Medium
Bearish Marubozu Full body, no wicks ⭐⭐⭐ Strong
Falling Three Continuation after pullback ⭐⭐ Medium
Hanging Man Long lower wick at top ⭐⭐ Medium
