RSI Bands [APIDEVs]RSI BANDS:
It is an exclusive product of ApiDevs , this indicator selectively integrates a series of highly advanced algorithms that aim to provide the trader with an effective and profitable trading system, based on a series of conditions that project the price direction with a reasonable probability.
This indicator bears the name of “RSI Bands” , this is because we have based this trading system on the “Relative Strength Index (RSI)” , the strength of this indicator is centennial and we at APIDEVs have decided to focus our efforts on the development of powerful tools based on the favorite indicators of the afternoon.
WHAT IT HAS INCORPORATED:
1. Exponential Moving Average (EMAs): The RSI Bands has, by default, a band composed of two moving averages of 10 and 55 exponential periods, which can be modified in the indicator menu.
• Possibility of changing the value of the EMAs.
• Function was enabled to change the color and transparency of the bands.
• Visual alerts SHORT (L) and LONG (L) were added when there is the crossing of the EMAS.
• Hull Moving Average (HMA) of 100 periods was also incorporated, also modifiable for those who wish to strengthen their visual analysis. (Disabled by default)
• We also add an Exponential Moving Average (EMA) of 200 periods to mark the trend. (Disabled by default).
2. A TR (Average True Range): This indicator has two main functions in the RSI Bands, the first is to mark the trend of the asset and the second is to establish a margin of safety in price volatility, that is, a maximum estimate of the setbacks without this representing a change in the direction of the price.
3. RSI (Relative Strength Index): It was visually incorporated into the RSI Bands, the graph is obtained on the right side and its purpose is to visually indicate where the price is with respect to the RSI PRO+ indicator, offering the following improvements :
• ALERT SYSTEM: THE RSI PRO+ has the ADX incorporated into its algorithm, which allows establishing a filter that will provide reliable inputs, represented by the LONG (L) and SHORT (S) signals.
• FILTER AGAINST TREND: The signals described above will be activated according to the crossing of the RSI above the 50 point, provided that the ADX agrees with the market direction.
• Possibility of deactivating this graphical representation.
4. ADX (Average Directional Index): The ADX in this indicator is intended to estimate the strength of the movement, it is present in each part of the code, either to indicate the strength of the market or to serve as a filter against trend. In the same way, we apply certain exclusive improvements for this indicator:
• It was established as default values of the ADX that the Level Range was 10 and the Level Trend 25. This significantly changes the behavior of this indicator, almost completely eliminating the zone of disinterest that was usually considered.
• A function was activated to paint the sails the color of the ADX.
5. ADX Ocillator: Yes, we developed a Wave oscillator type ADX and incorporated it into this strategy. From this indicator, which we recommend using in conjunction with the RSI Bands, we extracted the LONG (L) and SHORT (S) signals. The ADX Oscillator is the improved version of the traditional ADX as it offers the following improvements:
• Its interpretation is much simpler.
• Allows you to set entry and exit signals during the trend change and during the price path.
• It has an integrated alert system.
STRATEGY PANEL:
This panel is an exclusive creation of APIDEVs , and its purpose is to parameterize five conditionals based on the indicators that make up our RSI strategy, giving the trader an immediate vision of the status of the asset analyzed considering this strategy. That is, we decided to transfer our experience of using this indicator on a panel that will project the price trajectory visually. It has the following characteristics:
• It can be placed anywhere on the screen through the main menu of the indicator, it can even be deactivated.
• It can be resized, we designed this to adapt to all types of screens, including those of mobile phones.
• It has an upper panel called "Project" which will calculate the percentage probability that the price has to take a direction based on all the indicators incorporated into the strategy. Their values range from (+ 100%) to (-100%).
STRATEGY PANEL PARAMETERS:
1. EMAs : This panel has 2 variables:
• LONG : If the fast EMA is above the slow EMA.
• SHORT : If the fast EMA is below the slow EMA.
2. RSI : This panel has 3 variables:
• LONG : The RSI should be bullish (green) and above the 50 point.
• SHORT : The RSI should be bearish (red) and be below the 50 point.
• RANK: (Range)this condition is activated when there is no concordance with the RSI condition and its crossing.
3. ATR : This panel has 2 variables:
• LONG : When the price is above the ATR.
• SHORT : When the price is below the ATR.
4. ADX: This panel has 3 variables:
• LONG : The ADX is green. That is, the DI + is above the DI-.
• SHORT : The ADX is red. That is, the DI- is above the DI +.
• RANK : ADX is below point 10.
It also has a numerical value that indicates the value of the ADX and two texts indicating the strength of the trend:
• Trend (bullish or bearish).
• Strong trend (bullish or bearish).
5. OSC : This panel has 3 variables:
• LONG : The oscillator slopes upward and the built-in ADX is green.
• SHORT : The oscillator slopes downward and the built-in ADX is red.
• RANK : The oscillator slopes downward and the built-in ADX is green and the opposite. In short, there is no coherence in the movement of the oscillator and the projection of the ADX.
Recherche dans les scripts pour "rsi"

RSI 30 CROSSScript will give the RSI 30 40 and 70 level for present price of the stock , when the price cross the green line RSI value will be 70 , blue line RSI value will be 40 and red line RSI value will be 30 . Helps to put entry and exit based on RSI strategy.
RED line give price for RSI 30
BLUE line give price for RSI 40
GREEN line give price for RSI 70
BLACK line give SMA 200
Strategy
Stock price should above 200 MA
price should touch RSI 30 RED line and bounce back.
Entry will be the high of candle lies on RSI 40 BLUE line.
Stop loss will be the RSI 30 price(RED line ) during entry.
Target will be the RSI 70 price ( GREEEN line) during entry.
You can take half profit at RSI 70 and trail stop loss on RSI 70 till it cross.
This will help you to find the Price for stock, when it cross RSI value 30 , 40 and 70 to place entry exit and target based on the trade strategy will follow RSI.
If you want to entry, when stock cross RSI 30 or 40 from below . You can place a stop loss limit buy order at price range .
If you want to exit, When stock cross RSI 70 . you place stock loss at green line price.

RSI+CMO Hybrid StrategyThis strategy is based on the RSI+CMO Hybrid Index I created. I modified both the original RSI and CMO so that the RSI+CMO Index value ranges from -100 to +100 and defined as follows. When the RSI+CMO Hybrid Index values close above the Bull Level and below the Bear Level, the strategy will trigger long and short signals respectively. This newly defined hybrid RSI+CMO indicator showed better win rates and better profits than the original CMO strategy. The default setting for this strategy is optimized for an 8-hour candle. For candles at different times, try to find the optimal value yourself.
* I was going to open the script, but recently there was a case of stealing my script and publishing it without permission, so I decided not to disclose it.
▶ Modified RSI = Original RSI - 50
Therefore,
Original RSI (0 ~ 100) → Modified RSI (-50 ~ +50)
▶ Modified CMO = Original CMO * 0.5
Therefore,
Original CMO (-100 ~ +100) → Modified CMO (-50 ~ +50)
▶ RSI+CMO Hybrid Index = Modified RSI + Modified CMO
Therefore,
RSI+CMO Hybrid Index (-100 ~ +100)
________________________________________________________
이 전략은 기존의 RSI와 CMO 지표를 수정하여 새롭게 정의한 하이브리드 RSI+CMO 지표를 기반으로 만들어졌습니다. 지표 값의 범위가 -100에서 100의 범위를 가질 수 있도록 기존의 RSI와 CMO를 수정하여 만들었습니다. RSI+CMO Hybrid Index 값이 Bull Level 이상과 Bear Level 아래에서 봉마감을 하면 이 전략은 각각 롱과 숏 신호를 트리거합니다. 이렇게 새롭게 정의된 RSI+CMO 지표는 기존 CMO 전략 대비 승률과 수익이 더 우수합니다. 이 전략의 세팅 기본값은 8시간봉에 최적화 되어있습니다. 다른 시간대 봉에서는 최적값을 직접 찾아보십시오. 그리고 이전략은 RSI+CMO Hybrid Index와 함께 사용하면 Long과 Short 신호를 예측할 수 있어 편리합니다.
* 최근에 제 스크립트를 도용/표절하여 무단으로 퍼블리쉬한 사례가 발생하여 더 이상 스크립트는 공개하지 않기로 하였습니다.

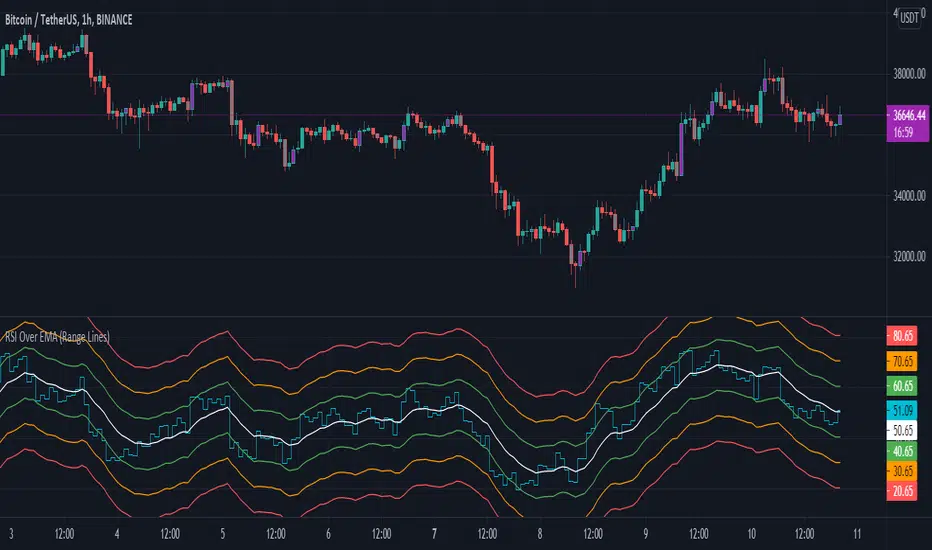
RSI Over EMA (Range Lines)This is another version of the RSI over EMA Trend Sniper script that I released here:
This one gives you better control across pairs wither higher volatility with the extra lines and more alert possibilities.
Here are the useful Alert functions within this indicator:
LONGS:
-Aqua line (RSI Line) - Crossing UP (Long Alert) on the Lower Green line
-Aqua line (RSI Line) - Crossing UP (Long Alert) on the Upper Green line
-Aqua line (RSI Line) - Crossing UP (Long Alert) on the Lower Amber line
-Aqua line (RSI Line) - Crossing UP (Long Alert) on the Upper Amber line
-Aqua line (RSI Line) - Crossing UP (Long Alert) on the Lower Red line
-Aqua line (RSI Line) - Crossing UP (Long Alert) on the Upper Red line
SHORTS:
-Aqua line (RSI Line) - Crossing DOWN (Short Alert) on the Lower Green line
-Aqua line (RSI Line) - Crossing DOWN (Short Alert) on the Upper Green line
-Aqua line (RSI Line) - Crossing DOWN (Short Alert) on the Lower Amber line
-Aqua line (RSI Line) - Crossing DOWN (Short Alert) on the Upper Amber line
-Aqua line (RSI Line) - Crossing DOWN (Short Alert) on the Lower Red line
-Aqua line (RSI Line) - Crossing DOWN (Short Alert) on the Upper Red line
You can setup alerts for the Aqua line (RSI Line) 'crossing up' (Long Alert) or 'crossing down' (Short Alert) on any of the colored EMA lines.
By default the lines are spread out at 10/20/30 and that should cover high volatility charts. But, this is customizable and you can reduce the size of Green/Amber/Red lines to try and get a better more focused setup for whichever coin you are trading on. I have found this version of the RSI over EMA to work better with alt coins that are generally more volatile, but using it on Bitcoin works too.
I am using this for Cryptocurrency alerts, but not for automation to enter or exit a trade. It's important to only use this on normal candles, and only use it as a confirmation of a possible good entry or exit.
RSI Moving Average with Signal LineDefault values:
RSI = white
RSI Prime ( RSI of RSI ) = yellow
EMA 34 = blue
EMA 55 = red
They are listed in order of reactiveness to price changes. Think of them like the Williams Alligator...
White and yellow work the fastest, with WHITE being signal and YELLOW being trigger. Great for LTF
Blue and red work the slowest, with BLUE being frequently testing RED as support/resistance. Great for HTF
Long Entry:
RSIs both > SMAS (signal)
RSI > RSI Prime (confirmation)
Long Exit:
RSI < RSI Prime (signal)
RSIs both < SMAs (confirmation)
Short Entry:
RSIs both < SMAS (signal)
RSI < RSI Prime (confirmation)
Short Exit:
RSI > RSI Prime (signal)
RSIs both > SMAS (confirmation)

RSI Structure Engine (Aggressive Soft) | It measures the direction (trend) and turning points of the market via RSI(7).
But unlike the classic RSI:
It doesn't say "sell at 70 - buy at 30" ❌
Instead:
It reveals the STRUCTURE of the RSI (HH–HL / LH–LL).
That is:
Is there a trend?
Is the trend continuing?
Has the trend ended?
It divides the RSI into 3 zones:
Zone Meaning
RSI ≥ 70 Strong upward momentum (peak regime)
RSI ≤ 30 Strong downward momentum (bottom regime)
30–70 Transition / breathing space
But the key point is this 👇
The bottom/top RSI is FOLLOWED within these regimes, it doesn't lock in immediately.
What and How
🔺 🔻 Locked RSI peak/trough
HH/HL RSI upward trend
LH/LL RSI downward trend
Small points being followed (not yet locked)
If RSI HL breaks, the trend ends
WHAT YOU SHOULDN'T DO?
❌ Don't assume it's a buy-sell indicator alone
❌ Don't short just because you see RSI 70
❌ Don't long just because you see RSI 30
This indicator:
Answers the question "Which side should I be on?"
It doesn't say "Enter right here"
TREND FILTER (MAIN USE)
LONG LOOK:
Last structure: HH + HL
RSI doesn't fall below 30
🔻 HL is protected
SHORT LOOK:
Last structure: LH + LL
RSI cannot rise above 70
🔺 LH is protected
❌ Don't take a trade in the opposite direction.

Bästa Bob Multi-RSI 😎👊✅ RSI 7 → Fast impulse indicator
• Shows micro-movements
• Reacts instantly to liquidity sweeps
• Perfect for entry timing
✅ RSI 14 → Macro momentum indicator
• Captures the real trend
• Filters out noise
• Confirms larger market movements
When both are in sync → you get true market direction plus perfect timing.
👉 How to Use RSI 7 + RSI 14
1️⃣ Entry Signals (the best method)
BUY when:
• RSI 7 turns up from oversold
• RSI 14 is also sloping upward or gets crossed by RSI 7 from below
→ Extremely accurate right after a liquidity sweep.
SELL when:
• RSI 7 turns down from overbought
• RSI 14 is sloping downward or gets crossed by RSI 7 from above
→ Works insanely well for fakeouts and FVG entries.
2️⃣ Trend Filter
• When RSI 14 stays above 50 → market is bullish
• When RSI 14 stays below 50 → bearish
RSI 7 is then used only for timing entries.
3️⃣ A++ Setups (your favorite ones 😉🔥)
The best signals appear when:
✔ RSI 7 crosses RSI 14 at the same time as:
• a liquidity sweep happens
• price taps into an FVG or Order Block
• volume reacts
• your trend filter (EMA, HTF) supports the move
This combo is criminally effective when scalping BTC, NAS100, and XAUUSD.

RSI Volume Order BlocksOverview
This script builds structured order blocks using a combination of RSI pivots, price structure, and optional volume/ATR-based scaling.
It is designed to create a clean, explainable map of support/resistance levels that respond only to meaningful momentum shifts rather than small, insignificant oscillations.
Core Idea
Traditional order blocks rely solely on price highs/lows, which often produces excessive or noisy zones.
This model instead:
Detects pivot highs/lows on the RSI (controlled by RSI Length and Sensitivity).
Generates bearish order blocks from RSI pivot highs and bullish order blocks from RSI pivot lows.
Allows the user to choose whether blocks are based on candle bodies or the full candle range.
Optionally filters blocks so that:
bearish OBs form only when RSI is above an overbought threshold,
bullish OBs form only when RSI is below an oversold threshold.
The resulting zones represent areas of momentum exhaustion and imbalance rather than random price fluctuations.
Volume–ATR Height Mode
The script offers two approaches for block height:
1. Price Candle Mode
Block height equals either:
the candle body, or
the full high–low range of the pivot bar.
2. Volume–ATR Mode
Block height is adaptively scaled using:
ATR (ATR Length for Height),
relative volume compared to a baseline (Volume Baseline Length),
a global height multiplier.
This makes zones thicker when the pivot candle had both higher volatility and above-average volume, and thinner when market participation was lower.
Lifespan and Mitigation
Each block extends forward in time until price mitigates it.
Mitigation Method: Close
Bearish OB is removed when a candle closes above its top.
Bullish OB is removed when a candle closes below its bottom.
Mitigation Method: Wick
Bearish OB is removed when a wick breaks above the top.
Bullish OB is removed when a wick breaks below the bottom.
Additional controls:
Maximum number of stored OBs per side.
Maximum number of displayed OBs per side.
Overlap filtering to avoid redundant zone stacking.
Main Inputs (Summary)
RSI Length – standard RSI lookback.
RSI OB Sensitivity – pivot aggressiveness (higher = fewer, stronger pivots).
Overbought/Oversold Levels – thresholds for optional filters.
RSI Filter –
bearish OB only if RSI > overbought,
bullish OB only if RSI < oversold.
Order Block Style – candle body or full range.
Mitigation Method – close-based or wick-based.
OB Height Mode – price candle or volume–ATR scaling.
Volume Baseline Length, ATR Length for Height, Height Scale – parameters for adaptive height mode.
Show Bullish / Bearish OBs – toggles for each side.
Color settings for zone visualization.
How to Use
Typical workflows include:
Using higher-timeframe OB zones as structural support/resistance, then refining entries on lower timeframes.
Watching for price reactions inside thick Volume–ATR zones, which may indicate areas of strong participation.
Combining this tool with trend filters, volume metrics, or price action confirmation (e.g., rejection wicks or engulfing patterns).
This script does not generate automated entries/exits; it is a contextual mapping tool designed to highlight where meaningful imbalance likely originated and where reactions may occur.
Notes
Works on any symbol and timeframe available on TradingView.
Most effective when combined with disciplined risk management and a defined trading plan.
Provided for research, chart analysis, and backtesting.
Disclaimer
This tool is for educational and informational purposes only.
It does not constitute financial advice or a recommendation to buy or sell any asset.
Always perform your own analysis and manage risk appropriately.

RSI Regime & Reversals (Leading) — Bull/Bear Trend Finder📈 RSI Regime & Reversals (Leading) — Bull/Bear Trend Finder
This advanced RSI-based tool helps identify bullish and bearish market trends before they happen — combining classic RSI analysis with Cardwell-style reversals and range shift detection to act as a leading indicator rather than a lagging one.
🧠 Core Concept
The script detects when RSI behavior “shifts ranges,” a signature of trend changes:
• Bull Regime — RSI pullbacks hold above ~40 (momentum stays strong)
• Bear Regime — RSI rallies stall below ~60 (momentum weakens)
It then looks for leading clues inside those regimes:
• ✅ Positive Reversal: Price makes a higher low while RSI makes a lower low — a bullish continuation or early trend reversal signal.
• ❌ Negative Reversal: Price makes a lower high while RSI makes a higher high — an early warning of weakness.
• 🔁 Classic Divergences: Confirms reversals when RSI and price diverge at pivot points.
🎯 Signals
• Green “▲ Bull lead” — bullish reversal or divergence detected.
• Red “▼ Bear lead” — bearish reversal or divergence detected.
• Optional background shading:
• 🟩 Teal = Bullish regime
• 🟥 Red = Bearish regime
⚙️ Customization
• Regime sensitivity — Adjust RSI floor/ceiling for your asset’s volatility.
• Pivot sensitivity — Tune pivot lookback (L/R bars) for faster or slower signals.
• RSI smoothing — Filters noise without losing responsiveness.
• Alerts included — Trigger TradingView alerts for bullish or bearish leading signals.
🕵️♂️ Why it’s different
Unlike standard RSI divergences (which confirm after the move), this indicator uses positive/negative reversals to identify potential trend shifts early — a technique favored by Andrew Cardwell’s RSI analysis.
📊 Works great for:
• Swing trading and trend detection
• Spotting momentum regime shifts
• Stocks, crypto, FX, indices

RSI(14) CrossUp >= 60 📈 RSI14 CrossUp ≥ 60 (Daily, Live) + BB Width Screener
Author: Rayan Selim / Torpedo Labs
Version: 1.0
Category: Momentum + Volatility Visualization
🧠 Overview
This indicator combines RSI-based momentum confirmation with Bollinger Band Width (BBW) expansion tracking — designed for traders who want to visually and quantitatively detect daily strength shifts and volatility expansions across multiple symbols.
It highlights candles when the daily RSI(14) crosses above 60, signaling bullish continuation, and displays daily Bollinger Band Width data to assess volatility expansion or contraction.
You can also use the built-in Screener plots as custom columns in TradingView’s Watchlist or Stock Screener for quick scanning of multiple symbols.
⚙️ Core Features
✅ Daily RSI(14) Cross-Up Highlight
Automatically colors candles when RSI crosses above 60 (updates live, no need to wait for daily close).
✅ Bollinger Band Width (BBW) Display
Shows BBW values for the highlighted and previous candles.
✅ Dynamic Label Coloring
Expanding BBW → Green label, Contracting → Red label (toggleable).
✅ Grouped Input Panels
Organized configuration panels for clarity:
Graphic / Highlight
BBW Labels (Global / Green / Red / Fonts)
Screener Outputs
✅ Screener-Compatible Output Plots
Adds hidden plots for Watchlist columns:
RSI Prev (D)
RSI Today (D)
BBW Prev (D)
BBW Today (D)
CrossUp≥60 (0/1)
BBW Expanding (0/1)
✅ Live & Non-Repainting
Uses lookahead_on for live RSI updates while maintaining daily context.
📊 Use Case Examples
Detect momentum confirmation (RSI crossing 60) with simultaneous volatility expansion.
Screen for tickers where daily BBW is widening while RSI shows strength.
Build Watchlist columns to sort stocks by RSI conditions and BBW expansion.
Identify early breakout conditions during accumulation phases.
⚡ Technical Notes
All calculations use daily data, even on lower timeframes.
RSI cross-up events include the current (in-progress) daily candle.
Screener columns are hidden by default but can be toggled visible for debugging.
The indicator is non-repainting, as it reads daily RSI and BBW in real time.
📢 Alerts
Built-in alert for “RSI(14) Crossed Above 60 (Live)” so you never miss a setup.

RSI with SMA + 70/60/50/40/30 LevelsIndicator Name:
RSI with SMA + 70/60/50/40/30 Levels
🧩 Concept Overview:
यह indicator दो popular tools को combine करता है:
RSI (Relative Strength Index) – momentum indicator जो market ke overbought aur oversold zones ko identify karta hai.
SMA (Simple Moving Average) – trend smoother jo RSI ke movement ko average karke lagging confirmation deta hai.
इन दोनों के साथ 70, 60, 50, 40, और 30 की multiple reference lines draw की जाती हैं, ताकि trader को RSI ke swings aur reversals easily samajh aaye.
⚙️ Indicator Components:
RSI Line:
Default Period: 14 (customize kar sakte ho).
Show karta hai price momentum – agar RSI 70 ke upar jaata hai to market overbought zone me hota hai; agar 30 ke niche jaata hai to oversold zone me.
SMA on RSI:
RSI ka smooth version (usually 9-period SMA).
Trend confirmation ke liye – jab RSI line SMA ke upar cross karti hai to bullish signal, aur neeche cross kare to bearish signal.
Horizontal Levels:
70: Overbought zone (potential sell area).
60: Strong bullish momentum line (trend confirmation).
50: Neutral / midline (trend direction flip area).
40: Weak bearish zone (trend losing strength).
30: Oversold zone (potential buy area).
💡 How to Use:
Trend Identification:
RSI > 60 aur SMA ke upar → Bullish trend.
RSI < 40 aur SMA ke neeche → Bearish trend.
Reversal Spotting:
RSI 70 ke upar jaake wapas niche aaye → Sell signal.
RSI 30 ke neeche jaake wapas upar aaye → Buy signal.
Confirmation Using SMA:
RSI cross SMA from below → Confirmed bullish reversal.
RSI cross SMA from above → Confirmed bearish reversal.

RSI Breakout Zones█ OVERVIEW
“RSI Breakout Zones” is a technical analysis tool that identifies significant zones on the chart based on the Relative Strength Index (RSI). The indicator maps overbought (OB) and oversold (OS) zones using boxes, then extends them until the next zone of the same type is detected, highlighting breakout points to aid in trade entry decisions. These zones often serve as areas of consolidation, support, or resistance.
█ CONCEPTS
The indicator identifies overbought (above 70) and oversold (below 30) zones, drawing boxes that extend until the next zone of the same type (OB for OB, OS for OS) is detected. Breakout signals are generated when the price crosses the zone boundaries, indicating potential shifts in market momentum.
Why are RSI zones important? These zones represent areas of extreme market sentiment, often leading to corrections or reversals. Overbought zones suggest potential selling pressure, while oversold zones indicate buying opportunities. After a breakout, a zone may switch roles, e.g., from support to resistance or vice versa, making it a key element in price action analysis. Larger zones, formed during high volatility, may attract price for retests due to stronger imbalances in buyer/seller dynamics. Consolidation often occurs within these zones as the market seeks equilibrium before further moves. However, in strong trends, zones may be decisively broken without immediate pullbacks, and their significance depends on their position relative to key support and resistance levels.
█ FEATURES
- RSI Zone Detection: Calculates RSI with a customizable length (default 14) and identifies overbought/oversold zones based on user-defined levels (default 70/30), drawing boxes that dynamically adjust to price action within the zone.
- Customizable Boxes: Zones extend until the next zone of the same type is detected. The indicator draws zones with adjustable colors for overbought (red) and oversold (green) areas, with options for box and zone transparency.
- Breakout Signals: Generates upward (green triangle) and downward (red triangle) breakout signals when the price crosses the top or bottom of a zone. Signals appear below or above the bar, indicating potential trade entry points.
- Midline: Automatically draws a dashed line at the midpoint of each zone, helping traders assess price behavior within the zone and potential halfway retests.
- Box Management: Option to remove outdated boxes.
- Alerts: Built-in support for alerts on breakout signals, enabling traders to receive notifications for key zone crossings.
█ HOW TO USE
Add to Chart: Apply the indicator to your TradingView chart via the Pine Editor or Indicators menu.
Configure Settings:
- RSI Settings: Adjust RSI Length (default 14), Overbought Level (default 70), and Oversold Level (default 30) to tailor zone detection sensitivity—higher lengths smooth signals for longer-term analysis.
- Box Settings: Configure colors and transparency for overbought (red) and oversold (green) zones, including box transparency (default 90) and zone transparency (default 90).
- Signal Settings: Customize breakout signal colors (green for upward, red for downward) and enable/disable keeping boxes after RSI normalization.
Interpreting Signals:
- Upward Breakout Signal: A green triangle below the bar indicates a breakout, suggesting potential bullish momentum and trend continuation or reversal.
- Downward Breakout Signal: A red triangle above the bar indicates a breakout, suggesting potential bearish momentum.
- RSI Zones: If the price re-enters a zone after a breakout, it may signal a false breakout or consolidation; persistent zones can act as future support/resistance levels. Consolidation often occurs within these zones as the market seeks equilibrium.
- Use signals alongside other technical analysis tools for confirmation, such as moving averages (to confirm trend direction), Fibonacci levels (to identify key price zones), or volume indicators (to validate breakout strength). Analyze RSI zones on higher timeframes for stronger signals due to broader market context.
█ APPLICATIONS
- Momentum Trading: Use RSI zones as overbought/oversold filters. In an uptrend, look for buying opportunities on upward breakouts, and in a downtrend, on downward breakouts. Combining with MACD crossovers, Fibonacci levels, or pivot points enhances zone significance.
- Inter-Zone Trading: Utilize breakouts from one RSI zone and hold the position until reaching the next zone, which may act as a target level or reversal point.
█ NOTES
- Test the indicator across different timeframes and markets (stocks, forex, crypto) to optimize RSI length and levels for your trading style.
- For best results, use in trending markets where RSI extremes are more predictive; in ranging markets, additional filters are recommended to reduce false signals.
- Always combine with risk management; RSI zones alone do not guarantee reversals, and false breakouts may occur in low-liquidity environments.

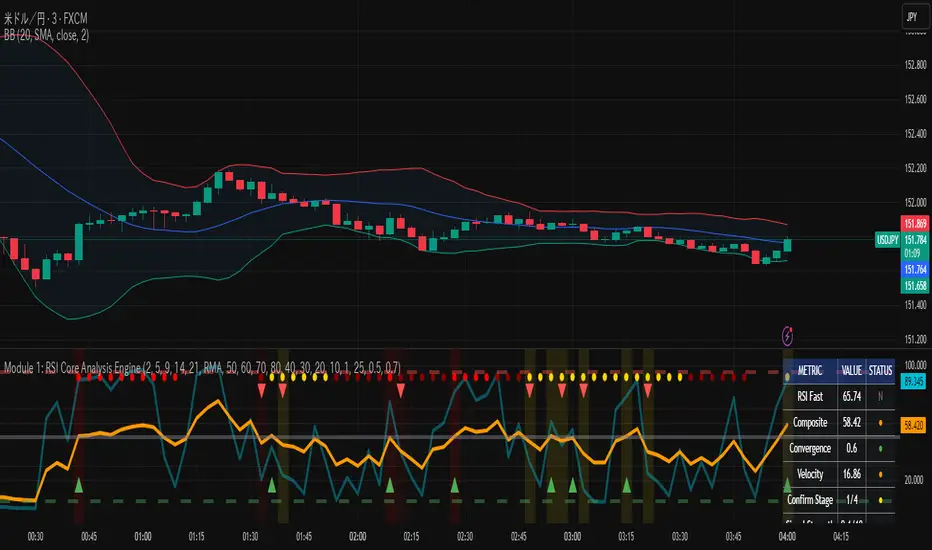
RSI Core Analysis EngineHI traders
This tool employs a higher-sensitivity RSI than conventional settings to capture market shifts earlier.
When the Ultra Fast RSI (UF) approaches upper or lower extremes, short-term profit-taking or pullbacks tend to occur, and a crossover between UF and the Composite RSI can serve as a signal of a regime change.
However, in strong trends the RSI can remain pinned for extended periods, so combine it with ADX, volume, and volatility measures to improve accuracy.
While early detection is an advantage, it also increases noise. This tool uses a four-stage confirmation process (DMI/ADX → MACD/Stochastics/RSI acceleration → five-layer alignment) and quality/confidence scores to filter for higher-expectancy setups.
It will not be effective in every market condition. Use it with predefined stop-losses and prudent position sizing.
-------------------------------------------------------------------------------------------------------
Strongly recommended preset (because the indicator packs many features):
Step 1 — Inputs tab
Center Level: 50
OB1: 60, OB2: 70, OB3: 95
OS1: 40, OS2: 30, OS3: 5
Step 2 — Style tab
✅ Ultra Fast RSI — Thickest
✖ Fast RSI
✖ Medium RSI
✖ Standard RSI
✖ Slow RSI
✅ Composite RSI — Thickest
✅ Stage Indicator
✖ RSI Velocity
✖ RSI Acceleration
✅ Quality Score
✅ Bullish Cross
✅ Bearish Cross
✅ Strong Signal Background
Levels:
・✅ Center 50 — Thickest
・✅ OB1 60, OB2 70, OB3 95 (thicker)
・✅ OS1 40, OS2 30, OS3 5 (thicker)
-------------------------------------------------------------------------------------------------------------
thats enough
have a nice trade
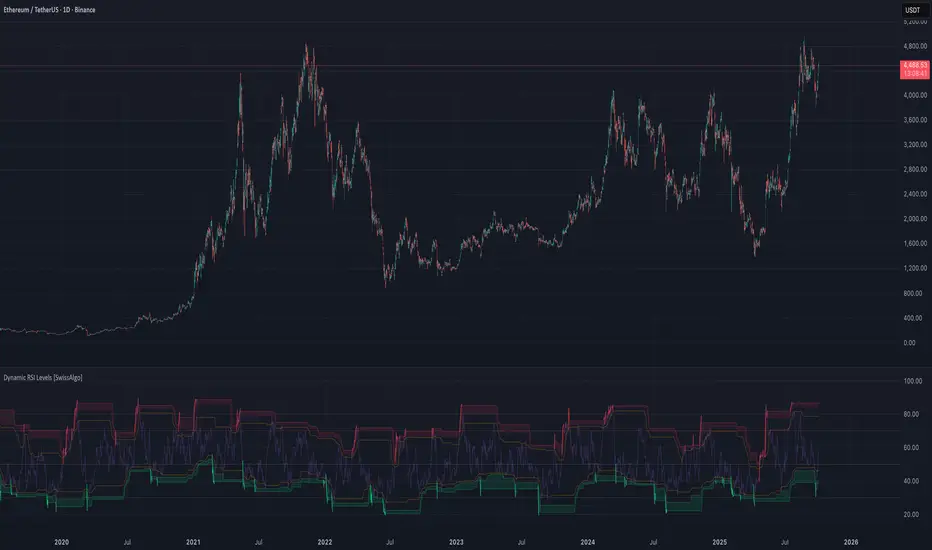
RSI with Dynamic Overbought/Oversold Levels [SwissAlgo]RSI with Dynamic Overbought/Oversold Levels
RSI indicator with adaptive overbought/oversold levels based on percentile analysis instead of fixed thresholds 30/70.
----------------------------------------------------------------
OVERVIEW
Traditional RSI uses static 30/70 levels that may fail to adapt to changing market conditions. This indicator calculates dynamic overbought/oversold zones based on recent price behavior, providing context-aware signals across dynamic volatility regimes.
----------------------------------------------------------------
KEY FEATURES
Dynamic percentile bands (98th, 95th, 90th, 10th, 5th, 2nd) that automatically adjust to current market volatility
Color-coded RSI line: red when above 98th percentile (extreme overbought), green when below 2nd percentile (extreme oversold), purple otherwise
Highlighted extreme zones with subtle background fills for easy visual identification
Adjustable responsiveness: Fast (50 bars), Medium (100 bars), or Slow (200 bars) for different trading styles and timeframes
Optional smoothing MA with multiple types: SMA, EMA, RMA, WMA, VWMA
Built-in alerts for extreme overbought/oversold conditions
----------------------------------------------------------------
HOW IT WORKS
The indicator tracks RSI values over a rolling window and calculates percentile ranks. When RSI reaches its 98th percentile, it means current momentum is stronger than 98% of recent readings — signaling a potentially extreme overbought condition relative to recent behavior, not just an arbitrary fixed level.
----------------------------------------------------------------
USAGE
Watch for RSI entering colored extreme zones (red/green fills) for potential exhaustion signals
Use the 90th/10th percentile bands as early warning levels
Combine with price action, support/resistance, or other indicators and your own analysis for confirmation
Adjust responsiveness based on your timeframe
----------------------------------------------------------------
SETTINGS
RSI Length: Standard 14-period default, adjustable
RSI Source: Close price default, customizable
Responsiveness: Choose how quickly percentile bands adapt to new data
Smoothing: Optional moving average overlay on RSI
Show Percentile Bands: Toggle visibility of dynamic levels
----------------------------------------------------------------
ALERTS
Two alert conditions are available:
RSI Extreme Overbought (crosses above 98th percentile)
RSI Extreme Oversold (crosses below 2nd percentile)
----------------------------------------------------------------
NOTES
Percentile levels recalculate as new data arrives, providing adaptive context rather than fixed historical values. This is intentional; the indicator shows where RSI stands relative to recent market behavior, not potentially outdated static thresholds.
----------------------------------------------------------------
LIMITATIONS & DISCLAIMER
PERCENTILE RECALCULATION
This indicator uses rolling percentile calculations that update as new price data arrives. Historical percentile levels may shift slightly as the lookback window moves forward . This is by design; the indicator provides context relative to recent market behavior, not static historical thresholds. Users should be aware that backtest results may differ slightly from real-time performance due to this adaptive nature.
NO PREDICTIVE CLAIMS
This indicator identifies when RSI reaches extreme levels relative to recent history. It does NOT predict future price movements, guarantee reversals, or provide trading signals. Extreme overbought/oversold conditions can persist during strong trends, price may continue moving in the same direction even after entering extreme zones.
ALERT TIMING
Alerts trigger when RSI crosses percentile thresholds on bar close. In fast-moving markets, significant price movement may occur between alert generation and user response. Always confirm conditions and DYOR before taking action.
NOT FINANCIAL ADVICE
This tool is for informational and educational purposes only. It does not constitute financial, investment, or trading advice. Past performance of any trading system or methodology is not indicative of future results. Trading involves substantial risk of loss and is not suitable for all investors.
USER RESPONSIBILITY
Users are solely responsible for their trading decisions. Always conduct your own analysis, implement proper risk management, and never risk more than you can afford to lose. Test thoroughly on paper/demo accounts before live trading.
NO WARRANTIES
This indicator is provided "as is" without warranties of any kind. The author assumes no responsibility for trading losses, technical errors, or any damages resulting from the use of this indicator.
RSI Momentum ScalperOverview
The "RSI Momentum Scalper" is a Pine Script v5 strategy crafted for trading highly volatile markets, with a special focus on newly listed cryptocurrencies. This strategy harnesses the Relative Strength Index (RSI) alongside volume analysis and momentum thresholds to pinpoint short-term trading opportunities. It supports both long and short trades, managed with customizable take profit, stop loss, and trailing stop levels, which are visually plotted on the chart for easy tracking.
Why I Created This Strategy
I developed the "RSI Momentum Scalper" because I was seeking a reliable trading strategy tailored to newly listed, highly volatile cryptocurrencies. These assets often experience rapid price fluctuations, rendering traditional strategies less effective. I aimed to create a tool that could exploit momentum and volume spikes while managing risk through adaptable exit parameters. This strategy is designed to address that need, offering a flexible approach for traders in dynamic crypto markets.
How It Works
The strategy utilizes RSI to identify momentum shifts, combined with volume confirmation, to trigger long or short entries. Trades are controlled with take profit, stop loss, and trailing stop levels, which adjust dynamically as the price moves in your favor. The trailing stop helps lock in profits, while the plotted exit levels provide clear visual cues for trade management.
Customizable Settings
The script is highly customizable, allowing you to adjust it to various market conditions and trading styles. Here’s a brief overview of the key settings:
Trade Mode: Select "Both," "Long Only," or "Short Only" to determine the trade direction.
(Default: Both)
RSI Length: Sets the lookback period for the RSI calculation (2 to 30).
(Default: 8)
A shorter length increases RSI sensitivity, suitable for volatile assets.
RSI Overbought: Defines the upper RSI threshold (60 to 99) for short entries.
(Default: 90)
Higher values signal stronger overbought conditions.
RSI Oversold: Defines the lower RSI threshold (1 to 40) for long entries.
(Default: 10)
Lower values indicate stronger oversold conditions.
RSI Momentum Threshold: Sets the minimum RSI momentum change (1 to 15) to trigger entries.
(Default: 14)
Adjusts the sensitivity to price momentum.
Volume Multiplier: Multiplies the volume moving average to filter high-volume bars (1.0 to 3.0).
(Default: 1)
Higher values require stronger volume confirmation.
Volume MA Length: Sets the lookback period for the volume moving average (5 to 50).
(Default: 13)
Influences the volume trend sensitivity.
Take Profit %: Sets the profit target as a percentage of the entry price (0.1 to 10.0).
(Default: 4.15)
Determines when to close a winning trade.
Stop Loss %: Sets the loss limit as a percentage of the entry price (0.1 to 6.0).
(Default: 1.85)
Protects against significant losses.
Trailing Stop %: Sets the trailing stop distance as a percentage (0.1 to 4.0).
(Default: 2.55)
Locks in profits as the price moves favorably.
Visual Features
Exit Levels: Take profit (green), fixed stop loss (red), and trailing stop (orange) levels are plotted when in a position.
Performance Table: Displays win rate, total trades, and net profit in the top-right corner.
How to Use
Add the strategy to your chart in TradingView.
Adjust the input settings based on the cryptocurrency and timeframe you’re trading.
Monitor the plotted exit levels for trade management.
Use the performance table to assess the strategy’s performance over time.
Notes
Test the strategy on a demo account or with historical data before live trading.
The strategy is optimized for short-term scalping; adjust settings for longer timeframes if needed.

RSI: alternative derivationMost traders accept the Relative Strength Index (RSI) as a standard tool for measuring momentum. But what if RSI is actually a position indicator?
This script introduces an alternative derivation of RSI, offering a fresh perspective on its true nature. Instead of relying on the traditional calculation of average gains and losses, this approach directly considers the price's position relative to its equilibrium (moving average), adjusted for volatility.
While the final value remains identical to the standard RSI, this alternative derivation offers a completely new understanding of the indicator.
Key components:
Price (Close)
Utilizes the closing price, consistent with the original RSI formula.
normalization factor
Transforms raw calculations into a fixed range between -1 and +1.
normalization_factor = 1 / (Length - 1)
EMA of Price
Applies Wilder’s Exponential Moving Average (EMA) to the price, serving as the anchor point for measuring price position, similar to the traditional RSI formula.
myEMA = ta.rma(close,Length)
EMA of close-to-close absolute changes (unit of volatility)
Adjusts for market differences by applying a Wilder’s EMA to absolute price changes (volatility), ensuring consistency across various assets.
CC_vol = ta.rma(math.abs(close - close ),Length)
Calculation Breakdown
DISTANCE:
Calculate the difference between the closing price and its Wilder's EMA. A positive value indicates the price is above the EMA; a negative value indicates it is below.
distance = close - myEMA
STANDARDIZED DISTANCE
Divide the distance by the unit of volatility to standardize the measurement across different markets.
S_distance = distance / CC_vol
NORMALIZED DISTANCE
Normalize the standardized distance using the normalization factor (n-1) to adjust for the lookback period.
N_distance = S_distance * normalization_factor
RSI
Finally, scale the normalized distance to fit within the standard RSI range of 0 to 100.
myRSI = 50 * (1 + N_distance)
The final equation:
RSI = 50 ×
What This Means for RSI
Same RSI Values, Different Interpretation
The standard RSI formula may obscure its true measurement, whereas this approach offers clarity.
RSI primarily indicates the price's position relative to its equilibrium, rather than directly measuring momentum.
RSI can still be used to analyze momentum, but in a more intuitive and well-informed way.

RSI MA Cross + Divergence Signal (V2) Core Logic
RSI + Moving Average
The script calculates a standard RSI (default 14).
It then overlays a moving average (SMA/EMA/WMA, default 9).
When RSI crosses above its MA → bullish momentum.
When RSI crosses below its MA → bearish momentum.
Divergence Filter
Signals are only valid if there’s confirmed divergence:
Bullish divergence: Price makes a lower low, RSI makes a higher low.
Bearish divergence: Price makes a higher high, RSI makes a lower high.
Overbought / Oversold Filter
Optional extra:
Bullish signals only valid if RSI ≤ 30 (oversold).
Bearish signals only valid if RSI ≥ 70 (overbought).
This ensures signals happen in “stretched” conditions.
Risk & Trade Management
Entries taken only when all conditions align.
Exits can be managed with ATR stops, partial take-profits, breakeven moves, and trailing stops (we coded these in the strategy version).
Cooldown, session filters, and daily loss guard to keep risk tight.
🔹 Strengths
✅ High selectivity: Combining RSI cross + divergence + OB/OS means signals are rare but higher quality.
✅ Great at catching reversals: Divergence highlights where price may be running out of steam.
✅ Risk management baked in: ATR stops + partial exits smooth out equity curve.
✅ Works across markets: ES, FX, crypto — anywhere RSI divergences are respected.
✅ Flexible: You can loosen/tighten filters depending on aggressiveness.
🔹 Weaknesses
❌ Lag from pivots: Divergence only confirms after a few bars → you enter late sometimes.
❌ Choppy in ranges: In sideways markets, RSI divergences appear often and whipsaw.
❌ Filters reduce signals: With all filters ON (divergence + OB/OS + trend + session), signals can be very rare — may under-trade.
❌ Not standalone: Needs higher-timeframe context (trend, liquidity pools) to avoid counter-trend entries.
🔹 Best Ways to Trade It
Use Higher Timeframe Bias
Run the strategy on 15m/1H, but only trade in direction of higher timeframe trend (e.g., 4H EMA).
Example: If daily is bullish → only take bullish divergences.
Pair With Structure
Look for signals at key zones: HTF support/resistance, VWAP, or FVGs.
Divergence + RSI cross inside an FVG is a strong entry trigger.
Adjust OB/OS for Volatility
For crypto/FX: use 35/65 instead of 30/70 (markets trend harder).
For ES/S&P: 30/70 works fine.
Risk Management Is King
Use partial exits: take profit at 1R, trail rest.
Size by % of equity (we coded this into the strategy).
Avoid News Spikes
Divergences break down around CPI, NFP, Fed announcements — stay flat.
🔹 When It Shines
Trending markets that make extended pushes → clean divergences.
Reversal zones (oversold → bullish bounce, overbought → bearish fade).
Swing trading (15m–4H) — less noise than 1m/5m scalping.
🔹 When to Avoid
Low volatility chop → lots of false divergences.
During high-impact news → RSI swings wildly.
In strong one-way trends without pullbacks — divergence keeps calling tops/bottoms too early.
✅ Summary:
This is a reversal-focused RSI divergence strategy with strict filters. It’s powerful when combined with higher-timeframe bias + structure confluence, but weak if traded blindly in choppy or news-driven conditions. Best to treat it as a precision entry trigger, not a full system — layer it on top of your FVG/ORB framework for maximum edge.

RSI Trend Navigator [QuantAlgo]🟢 Overview
The RSI Trend Navigator integrates RSI momentum calculations with adaptive exponential moving averages and ATR-based volatility bands to generate trend-following signals. The indicator applies variable smoothing coefficients based on RSI readings and incorporates normalized momentum adjustments to position a trend line that responds to both price action and underlying momentum conditions.
🟢 How It Works
The indicator begins by calculating and smoothing the RSI to reduce short-term fluctuations while preserving momentum information:
rsiValue = ta.rsi(source, rsiPeriod)
smoothedRSI = ta.ema(rsiValue, rsiSmoothing)
normalizedRSI = (smoothedRSI - 50) / 50
It then creates an adaptive smoothing coefficient that varies based on RSI positioning relative to the midpoint:
adaptiveAlpha = smoothedRSI > 50 ? 2.0 / (trendPeriod * 0.5 + 1) : 2.0 / (trendPeriod * 1.5 + 1)
This coefficient drives an adaptive trend calculation that responds more quickly when RSI indicates bullish momentum and more slowly during bearish conditions:
var float adaptiveTrend = source
adaptiveTrend := adaptiveAlpha * source + (1 - adaptiveAlpha) * nz(adaptiveTrend , source)
The normalized RSI values are converted into price-based adjustments using ATR for volatility scaling:
rsiAdjustment = normalizedRSI * ta.atr(14) * sensitivity
rsiTrendValue = adaptiveTrend + rsiAdjustment
ATR-based bands are constructed around this RSI-adjusted trend value to create dynamic boundaries that constrain trend line positioning:
atr = ta.atr(atrPeriod)
deviation = atr * atrMultiplier
upperBound = rsiTrendValue + deviation
lowerBound = rsiTrendValue - deviation
The trend line positioning uses these band constraints to determine its final value:
if upperBound < trendLine
trendLine := upperBound
if lowerBound > trendLine
trendLine := lowerBound
Signal generation occurs through directional comparison of the trend line against its previous value to establish bullish and bearish states:
trendUp = trendLine > trendLine
trendDown = trendLine < trendLine
if trendUp
isBullish := true
isBearish := false
else if trendDown
isBullish := false
isBearish := true
The final output colors the trend line green during bullish states and red during bearish states, creating visual buy/long and sell/short opportunity signals based on the combined RSI momentum and volatility-adjusted trend positioning.
🟢 Signal Interpretation
Rising Trend Line (Green): Indicates upward momentum where RSI influence and adaptive smoothing favor continued price advancement = Potential buy/long positions
Declining Trend Line (Red): Indicates downward momentum where RSI influence and adaptive smoothing favor continued price decline = Potential sell/short positions
Flattening Trend Lines: Occur when momentum weakens and the trend line slope approaches neutral, suggesting potential consolidation before the next move
Built-in Alert System: Automated notifications trigger when bullish or bearish states change, sending "RSI Trend Bullish Signal" or "RSI Trend Bearish Signal" messages for timely entry/exit
Color Bar Candles Option: Optional candle coloring feature that applies the same green/red trend colors to price bars, providing additional visual confirmation of the current trend direction

RSI Oscillator fxdealBased on the Pine Script code you provided, here is a detailed description of the indicator's features and functionality.
Indicator Overview
This is the Heikin Ashi RSI Oscillator (HARSI), a custom-built indicator for TradingView. It combines the principles of Heikin Ashi candles and the Relative Strength Index (RSI) to provide a smoothed, trend-focused oscillator in a separate pane below the main chart. The indicator visualizes trend strength, overbought/oversold conditions, and momentum changes using a series of configurable plots and lines.
Key Components and Features
Heikin Ashi RSI Candles: This is the core component. Instead of traditional price data, the indicator uses a custom Heikin Ashi calculation applied to the RSI values. This creates a smoothed, momentum-driven "candle" visualization that filters out market noise, making it easier to identify the direction and strength of the trend. The color of these candles changes to reflect bullish (teal) or bearish (red) momentum.
RSI Plot & Histogram: The indicator includes a standard RSI line plot and an optional histogram. The RSI can be displayed in "Smoothed Mode," which applies a Heikin Ashi-like smoothing to the RSI line itself to reduce volatility and improve trend identification. The histogram visually represents the RSI's value, with its height corresponding to the magnitude of the RSI.
Stochastic RSI: An optional Stochastic RSI is included to provide a different perspective on momentum. This is a "momentum of momentum" indicator that can be used for confirming trend changes or identifying overbought/oversold conditions within the RSI's own range. It can be plotted as either a ribbon (showing the K and D lines filled) or as individual lines.
Bollinger Bands (Stepline Style): The indicator overlays Bollinger Bands on the RSI. These bands adapt to the volatility of the RSI, providing dynamic overbought and oversold levels. The middle band is a simple moving average of the RSI. The upper and lower bands are plotted using a stepline style, giving them a distinct, staggered appearance.
Horizontal Lines: Several fixed horizontal lines are plotted to define key zones:
Overbought/Oversold (OB/OS) Zones: Customizable horizontal lines define overbought and oversold regions, with additional lines for "extreme" levels. These are based on the indicator's zero-median scale.
Traditional RSI Levels: Optional dotted horizontal lines at 70, 50, and 30 help users who are accustomed to traditional RSI readings quickly identify overbought, neutral, and oversold conditions.

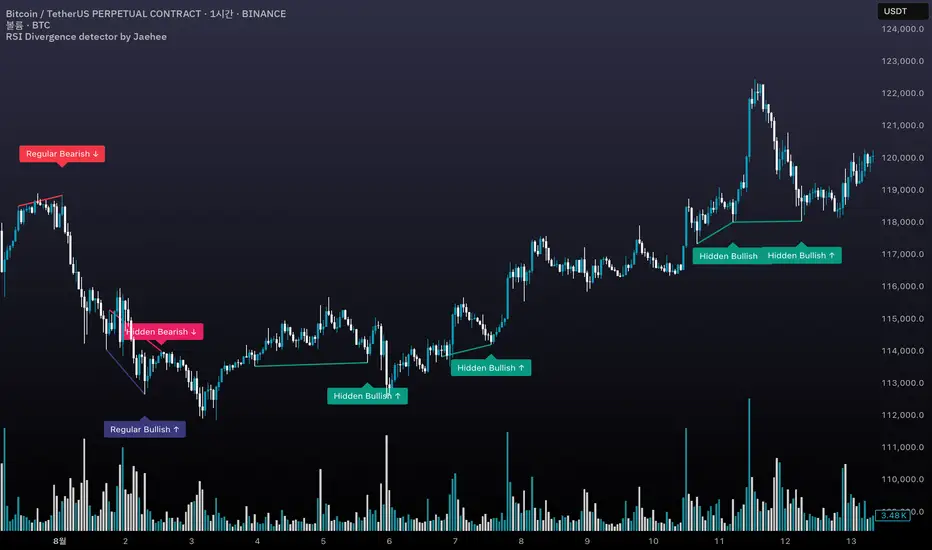
RSI Divergence detector by Jaehee📌 RSI DIVERGENCE DETECTOR — Instant Detection of Regular & Hidden Divergences with Color-Coded Labels
🔍 WHAT IT IS
• Detects regular and hidden divergences between price and RSI instantly, without the delay common in other divergence indicators
• Displays divergences directly on the chart with color-coded labels and connecting lines for instant visual recognition
• Uses different label colors for each divergence type so traders can identify setups at a glance
⚙️ HOW IT WORKS
• RSI Calculation — RSI is computed from a chosen price source with adjustable length
• Immediate Pivot Detection — Identifies pivots just one bar after formation for minimal delay
• RSI Delta Filter — Requires a minimum RSI difference to reduce noise and false signals
• Divergence Logic
Regular Bullish: Price lower low • RSI higher low
Regular Bearish: Price higher high • RSI lower high
Hidden Bullish: Price higher low • RSI lower low
Hidden Bearish: Price lower high • RSI higher high
• Visual Output — Connects pivot points with lines and adds labels above/below bars in colors you set
💡 WHY THIS COMBINATION
• Instant feedback — Acts faster than typical divergence tools that wait for multiple bar confirmations
• All-in-one detection — Regular and hidden divergences in the same tool
• Visual clarity — Distinct label colors make type recognition immediate
• Customizable — Adjust RSI length, pivot sensitivity, color scheme, and filtering to your style
🆚 HOW IT DIFFERS FROM COMMON DIVERGENCE INDICATORS
• Displays divergence the moment a pivot forms
• Detects both regular and hidden divergences in real time
• Applies RSI difference filtering for better quality
• Offers full color customization for each divergence type
📖 HOW TO READ IT (CONTEXT, NOT SIGNALS)
• Regular Bullish ↑ — Possible upward reversal or trend continuation after pullback
• Regular Bearish ↓ — Possible downward reversal or continuation after rally
• Hidden Bullish ↑ — Often a trend continuation signal in uptrends
• Hidden Bearish ↓ — Often a trend continuation signal in downtrends
• Always confirm with trend, momentum, or volume tools before trading
🛠 INPUTS
• RSI source and length
• Pivot lookback bars (left/right)
• Minimum RSI difference
• Custom colors for each divergence type
🎨 DESIGN NOTES
• Overlay on price chart for context
• Lines connect relevant pivots for clarity
• Labels placed near pivot highs/lows for easy spotting
• Customizable colors for personal visual preferences
⚠️ LIMITATIONS AND GOOD PRACTICE
• Divergence is not a guaranteed reversal signal
• Strong trends may override divergence setups
• False signals can occur in low volume or choppy markets
• Best used with a complete trading system and risk management
📂 DEFAULTS AND SCOPE
• Works on all OHLCV instruments and timeframes
• No repainting after pivot confirmation
💬 AUTHOR’S NOTE FOR REVIEW
This script is not a repackaging of existing tools. It integrates immediate divergence detection, hidden divergence analysis, and visual type separation into a single, customizable package. All features interact to deliver faster, clearer market context without generating trade signals or making performance claims.
RSI OS/OB Background StripesThe "RSI OS/OB Background Stripes" indicator is a simple tool designed to help traders visualize overbought and oversold market conditions using the Relative Strength Index (RSI). It highlights these conditions by displaying colored background stripes directly on your chart, making it easy to spot potential trading opportunities.
How It Works:RSI Calculation: The indicator calculates the RSI, a popular momentum indicator that measures the speed and change of price movements, using a default period of 14 (customizable).
Overbought/Oversold Levels: It marks areas where the RSI is above a user-defined overbought level (default: 70) with red background stripes, and below an oversold level (default: 30) with green background stripes.
Visual Feedback: The colored stripes appear on the chart when the RSI enters overbought (red) or oversold (green) zones, helping you quickly identify market conditions.
Customization: You can adjust the RSI period, overbought/oversold levels, background colors, and transparency. You can also choose to show the RSI line in a separate panel or display RSI values on the chart for debugging.
Alerts: The indicator includes optional alerts that notify you when the RSI crosses into overbought or oversold territory.
Who It’s For: This indicator is perfect for beginner and intermediate traders who want a clear, visual way to track RSI-based overbought and oversold conditions without cluttering their charts.
Key Features:Easy-to-read background stripes for overbought (red) and oversold (green) conditions.
Fully customizable RSI settings, colors, and transparency.
Optional RSI plot and value display for deeper analysis.
Alerts to keep you informed of key RSI level crossings.
This indicator is a straightforward way to monitor market momentum and make informed trading decisions.

RSI Buy Sell Signals[RanaAlgo]Overview
This Premium RSI with Enhanced Signals builds upon the classic Relative Strength Index by incorporating multiple confirmation filters and visual enhancements to improve signal reliability. The indicator goes beyond basic overbought/oversold levels by adding volume confirmation, trend alignment, and peak detection logic.
Key Features
Enhanced Signal Detection
Peak Strength Filter: Requires RSI movements to meet minimum strength criteria (configurable from 1-5 bars)
Volume Confirmation: Optional volume filter to ensure signals occur with above-average trading activity
Trend Alignment: Optional trend confirmation that checks price position relative to 20-period EMA
Visual Improvements
Dynamic coloring of RSI line (green in oversold, red in overbought)
Customizable reference lines and zones
Clear buy/sell signals with triangle markers
Comprehensive info panel showing current RSI status
Alert Capabilities
Ready-to-use alert conditions for both buy and sell signals
Visual and audible alerts when signals trigger
How It Works
Core RSI Calculation: Uses standard RSI formula with configurable length (default 14)
Signal Generation:
Buy signals require either:
RSI rising from oversold with volume/trend confirmation (when enabled)
Simple crossover above oversold level (when filters disabled)
Sell signals require either:
RSI falling from overbought with volume/trend confirmation
Simple crossunder below overbought level
Additional Filters:
Minimum peak strength prevents weak, insignificant movements from generating signals
Volume filter helps confirm institutional participation
Trend filter aligns signals with broader price direction
Usage Instructions
Apply to any chart timeframe (works best on 1H or higher)
Configure settings in the input panel:
Adjust RSI length if needed
Set overbought/oversold levels (default 70/30)
Enable/disable volume and trend filters
Customize visual elements
Signals appear as triangles below/above the RSI line
Use alerts to get notified of new signals
Differentiation from Standard RSI
This indicator adds several layers of confirmation that aren't present in the basic RSI:
Multi-bar momentum requirement for peaks/troughs
Volume validation option
Trend confirmation option
Smoothed RSI line for cleaner visualization
Comprehensive info panel with current status
The combination of these features helps filter out false signals that commonly occur with traditional RSI implementations.

RSI Crossover Signal Companion - Alerts + Visuals🔷 RSI Crossover Signal Companion — Alerts + Visuals
The Relative Strength Index (RSI) is a momentum oscillator that measures the speed and change of recent price movements. It helps traders identify overbought or oversold conditions, possible trend reversals, and momentum strength.
This utility builds on TradingView’s classic Relative Strength Index (RSI) by adding real-time alerts and triangle markers when the RSI crosses its own moving average — a common technique for early momentum detection.
It is designed as a lightweight, visual companion tool for traders using RSI/MA crossover logic in manual or semi-automated strategies.
🔍 Features
✅ Preserves the full original RSI layout, including:
• Gradient fill and overbought/oversold zones
• Standard RSI input settings (length, source, etc.)
• MA smoothing options with user-defined type and length
🔺 Adds visual triangle markers:
🔼 Up triangle when RSI crosses above its MA
🔽 Down triangle when RSI crosses below its MA
📢 Built-in alerts for RSI/MA crosses:
“RSI Crossed Above MA”
“RSI Crossed Below MA”
📈 How to Use
This script is ideal for:
• Spotting early momentum shifts
• Confirming entries or exits in other systems (price action, trendlines, breakouts)
• Building alert-based automation (webhooks, bots, etc.)
Popular use cases:
• Combine with trend indicators like MA200 or MA12
• Use in confluence with price structure and divergence
• Validate breakout moves with momentum confirmation
⚙️ Customization
RSI length, MA length, MA type, and source are fully adjustable
Triangle marker size, shape, and color can be edited under Style
Alerts are pre-built and ready for use
