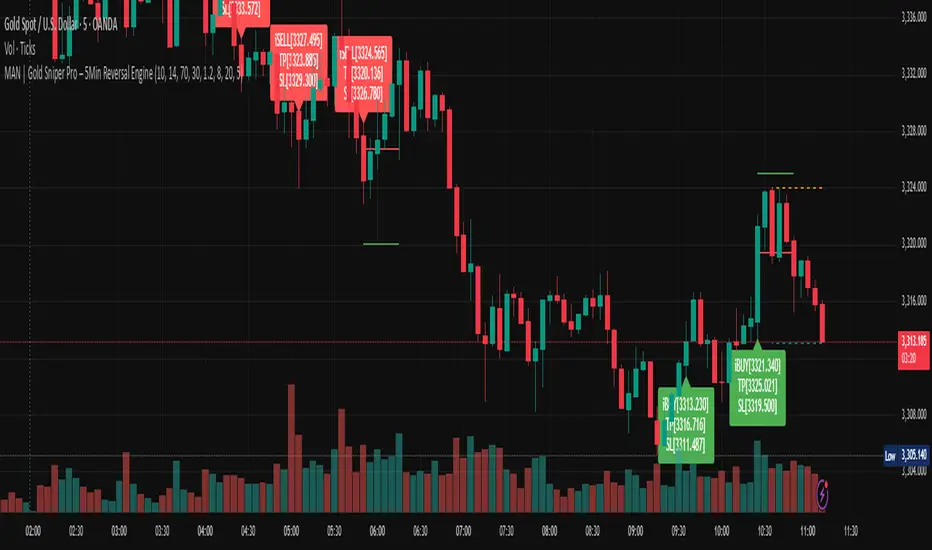
MAN | Gold Sniper Pro – 5Min Reversal EngineThis advanced scalping indicator is designed for high-precision entries and exits on the 5-minute timeframe, combining price action, volume analytics, and momentum filtering.
🔍 Core Features:
Price Action Engine: Detects powerful bullish and bearish engulfing patterns, enhanced with ATR-based body size filters to avoid weak signals.
Dynamic Support/Resistance Zones: Automatically tracks recent high/low zones to confirm trade validity and prevent chasing trades.
Smart RSI Filter: Filters trades based on momentum to avoid buying overbought or selling oversold conditions.
Volume Spike + OBV Filter: Confirms entries with strong volume spikes and OBV (On-Balance Volume) alignment, improving signal quality.
Time-based Session Filter: Optional filter to restrict signals to high-liquidity market hours (configurable).
Auto TP/SL Levels: Calculates Take Profit and Stop Loss dynamically using ATR multipliers, with customizable multipliers per timeframe.
Clear Entry Labels + Optional TP/SL Lines: Visual labels for each signal, with the option to show SL/TP as horizontal lines for precision monitoring.
Real-time Alerts: Set alerts for BUY and SELL conditions — stay informed and trade instantly.
📈 Recommended Usage:
Optimized for Gold (XAUUSD) on the 5-minute chart, but configurable for any fast-moving asset.
Ideal for scalpers and intraday traders seeking high-quality, low-latency entries with built-in protection mechanisms.
Works well in trending or range-bound conditions, thanks to volume and price action synergy.
⚙️ Customizable Parameters:
RSI length & thresholds
ATR-based SL/TP multipliers
Volume spike threshold
Session window
TP/SL visibility toggle
🟢 Built by traders, for traders.
Sharpen your edge with this smart, visual, and momentum-aware scalping tool.
Recherche dans les scripts pour "scalp"
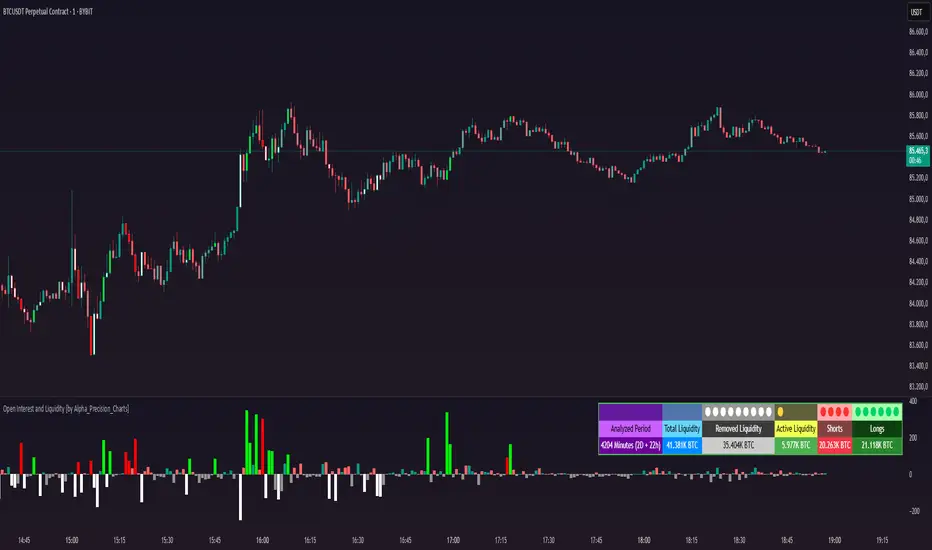
Open Interest and Liquidity [by Alpha_Precision_Charts]Indicator Description: Open Interest and Liquidity
Introduction:
The "Open Interest and Liquidity" indicator is an advanced tool designed for traders seeking to analyze aggregated Open Interest (OI) flow and liquidity in the cryptocurrency market, with a special focus on Bitcoin. It combines high-quality Open Interest data, a detailed liquidity table, and a visual longs vs shorts gauge, providing a comprehensive real-time view of market dynamics. Ideal for scalpers, swing traders, and volume analysts, this indicator is highly customizable and optimized for 1-minute charts, though it works across other timeframes as well.
Key Features:
Aggregated Open Interest and Delta: Leverages Binance data for accuracy, allowing traders to switch between displaying absolute OI or OI Delta, with value conversion to base currency or USD.
Liquidity Table: Displays the analyzed period, active liquidity, shorts, and longs with visual proportion bars, functioning for various cryptocurrencies as long as Open Interest data is available.
Longs vs Shorts Gauge: A semicircle visual that shows real-time market sentiment, adjustable for chart positioning, helping identify imbalances, optimized and exclusive for Bitcoin on 1-minute charts.
Utilities:
Sentiment Analysis: Quickly detect whether the market is accumulating positions (longs/shorts) or liquidating (OI exits).
Pivot Identification: Highlight key moments of high buying or selling pressure, ideal for trade entries or exits.
Liquidity Monitoring: The table and gauge provide a clear view of active liquidity, helping assess a move’s strength.
Scalping and Day Trading: Perfect for short-term traders operating on 1-minute charts, offering fast and precise visual insights.
How to Use:
Initial Setup: Choose between "Open Interest" (candles) or "Open Interest Delta" (columns) in the "Display" field. The indicator defaults to Binance data for enhanced accuracy.
Customization: Enable/disable the table and gauge as needed and position them on the chart.
Interpretation: Combine OI Delta and gauge data with price movement to anticipate breakouts or reversals.
Technical Notes
The indicator uses a 500-period VWMA to calculate significant OI Delta thresholds and is optimized for Bitcoin (BTCUSDT.P) on high-liquidity charts.
Disclaimer
This indicator relies on the availability of Open Interest data on TradingView. For best results, use on Bitcoin charts with high liquidity, such as BTCUSDT.P. Accuracy may vary with lower-volume assets or exchanges.
kurd fx Dynamic EMA StrategyDynamic EMA Strategy Explanation
This TradingView Pine Script indicator, "Dynamic EMA Strategy," is designed to plot Exponential Moving Averages (EMAs) dynamically based on the selected timeframe. It adjusts the EMA periods depending on whether the trader is scalping, swing trading, or position trading.
Functionality
1. Defining EMA Periods Based on Timeframe
The script determines appropriate EMA values based on the selected chart timeframe:
Scalping (1m, 3m, 5m)
Uses EMA 9, EMA 21, and EMA 50 for fast-moving market conditions.
Swing Trading (15m, 30m, 45m)
Uses EMA 50 and EMA 100, suitable for medium-term trend identification.
EMA 3 is disabled (na) in this mode.
Position Trading (1H and higher)
Uses EMA 100 and EMA 200 to identify long-term trends.
EMA 3 is disabled (na) in this mode.
2. EMA Calculation
The script calculates EMA values dynamically:
emaLine1 = ta.ema(close, ema1): Computes the first EMA.
emaLine2 = ta.ema(close, ema2): Computes the second EMA.
emaLine3 = not na(ema3) ? ta.ema(close, ema3) : na: Computes the third EMA only if applicable.
3. Plotting the EMAs
The script overlays the EMAs on the chart:
Blue Line (EMA 1) → Represents the fastest EMA.
Orange Line (EMA 2) → Represents the medium EMA.
Red Line (EMA 3) → Represents the slowest EMA (if applicable).
Each EMA is plotted using plot() with a specific color, linewidth of 2, and plot.style_line for a clean visualization.
Use Case
Scalpers can identify short-term momentum changes.
Swing traders can detect medium-term trends.
Position traders can spot long-term market trends.
This strategy helps traders adjust their EMA settings dynamically without manually changing them for different timeframes.

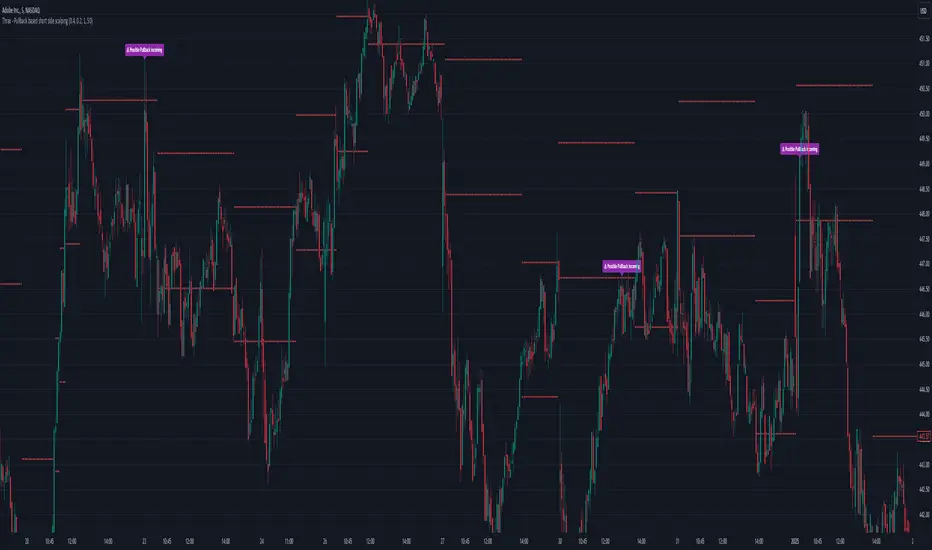
Thrax - Pullback based short side scalping⯁ This indicator is built for short trades only.
⤞ Pullback based scalping is a strategy where a trader anticipates a pullback and makes a quick scalp in this pullback. This strategy usually works in a ranging market as probability of pullbacks occurrence in ranging market is quite high.
⤞ The strategy is built by first determining a possible candidate price levels having high chance of pullbacks. This is determined by finding out multiple rejection point and creating a zone around this price. A rejection is considered to be valid only if it comes to this zone after going down by a minimum pullback percentage. Once the price has gone down by this minimum pullback percentage multiple times and reaches the zone again chances of pullback goes high and an indication on chart for the same is given.
⯁ Inputs
⤞ Zone-Top : This input parameter determines the upper range for the price zone.
⤞ Zone bottom : This input parameter determines the lower range for price zone.
⤞ Minimum Pullback : This input parameter determines the minimum pullback percentage required for valid rejection. Below is the recommended settings
⤞ Lookback : lookback period before resetting all the variables
⬦Below is the recommended settings across timeframes
⤞ 15-min : lookback – 24, Pullback – 2, Zone Top Size %– 0.4, Zone Bottom Size % – 0.2
⤞ 5-min : lookback – 50, pullback – 1% - 1.5%, Zone Top Size %– 0.4, Zone Bottom Size % – 0.2
⤞ 1-min : lookback – 100, pullback – 1%, Zone Top Size %– 0.4, Zone Bottom Size % – 0.2
⤞ Anything > 30-min : lookback – 11, pullback – 3%, Zone Top Size %– 0.4, Zone Bottom Size % – 0.2
✵ This indicator gives early pullback detection which can be used in below ways
1. To take short trades in the pullback.
2. To use this to exit an existing position in the next few candles as pullback may be incoming.
📌 Kindly note, it’s not necessary that pullback will happen at the exact point given on the chart. Instead, the indictor gives you early signals for the pullback
⯁ Trade Steup
1. Wait for pullback signal to occur on the chart.
2. Once the pullback warning has been displayed on the chart, you can either straight away enter the short position or wait for next 2-4 candles for initial sign of actual pullback to occurrence.
3. Once you have initiated short trade, since this is pullback-based strategy, a quick scalp should be made and closed as price may resume it’s original direction. If you have risk appetite you can stay in the trade longer and trial the stops if price keeps pulling back.
4. You can zone top as your stop, usually zone top + some% should be used as stop where ‘some %’ is based on your risk appetite.
5. It’s important to note that this indicator gives early sings of pullback so you may actually wait for 2-3 candles post ‘Pullback warning’ occurs on the chart before entering short trade.
1 (or) 5-Minute Scalping Strategy - KGP1-Minute Scalping Strategy - KGP
Overview: This indicator is designed for short-term traders who engage in 1 (or) 5-minute scalping. It combines several technical analysis tools to provide buy and sell signals, helping traders make informed decisions quickly.
Key Features:
VWAP (Volume Weighted Average Price):
Purpose: VWAP provides the average price a security has traded at throughout the day, based on both volume and price.
Usage: Helps identify the overall trend and potential entry points. When the price is above VWAP, it indicates a bullish trend; when below, it indicates a bearish trend.
RSI (Relative Strength Index):
Purpose: RSI measures the speed and change of price movements, indicating overbought or oversold conditions.
Usage: The RSI values between 30 and 70 are used to filter trades. A value above 70 indicates overbought conditions, while below 30 indicates oversold conditions.
Custom OBV (On Balance Volume):
Purpose: OBV uses volume flow to predict changes in stock price.
Usage: Helps confirm the strength of a trend. Increasing OBV indicates accumulation (buying pressure), while decreasing OBV indicates distribution (selling pressure).
Multi-Timeframe Analysis:
Purpose: Confirms signals by analyzing RSI on a higher timeframe (5-minute chart).
Usage: Ensures that signals on the 1-minute chart align with the broader trend on the 5-minute chart, reducing false signals.
Signals:
Buy Signal:
Triggered when the price crosses above the VWAP, and the RSI is between 50 and 70 on both the 1-minute and 5-minute charts.
Visual Cue: A green “BUY” label appears below the bar.'
Sell Signal:
Triggered when the price crosses below the VWAP, and the RSI is between 30 and 50 on both the 1-minute and 5-minute charts.
Visual Cue: A red “SELL” label appears above the bar.
Alerts:
Buy Alert: Notifies you when a buy signal is detected.
Sell Alert: Notifies you when a sell signal is detected.
Additional Visuals:
VWAP Line: Plotted in blue to show the average price based on volume.
OBV Line: Plotted in purple to indicate volume flow.
RSI Line: Plotted in orange with horizontal lines at 70 (overbought) and 30 (oversold) levels.

Buy-Sell Volume Bar Gauge [By MUQWISHI]▋ INTRODUCTION :
The Buy-Sell Volume Bar Gauge is developed to provide traders with a detailed analysis of volume in bars using a low timeframe, such as a 1-second interval, to measure the dominance of buy and sell for each bar. By highlighting the balance between buying and selling activities, the Buy-Sell Volume Bar Gauge helps traders identify potential volume momentum of a bar; aimed at being a useful tool for day traders and scalpers.
_______________________
▋ OVERVIEW:
_______________________
▋ METHODOLOGY:
The concept is based on bars from a lower timeframe within the current chart timeframe bar, where volume is categorized into Up, Down, and Neutral Volume, with each one displayed as a portion of a column plot. Up Volume is recorded when the price experiences a positive change, Down Volume occurs when the price experiences a negative change, and Neutral Volume is observed when the price shows no significant change.
_______________________
▋ INDICATOR SETTINGS:
(1) Fetch data from the selected lower timeframe. Note: If the selected timeframe is invalid (higher than chart), the indicator will automatically switch to 1 second.
(2) Price Source.
(3) Treating Neutral Data (Price Source) as
Neutral: In a lower timeframe, when the bar has no change in its price, the volume is counted as Neutral Volume.
Previous Move: In a lower timeframe, when the bar has no change in its price, the volume is counted as the previous change; “Up Volume” if the previous change was positive, and “Down Volume” if the previous change was negative.
Opposite Previous Move: In a lower timeframe, when the bar has no change in its price, the volume is counted as the opposite previous change; “Up Volume” if the previous change was negative, and “Down Volume” if the previous change was positive.
(4) Average Volume Length, it's used for lighting/darkening columns in a plot.
(5) Enable Alert.
(7) Total bought (%) Level.
(8) Total Sold (%) Level.
_____________________
▋ COMMENT:
The Buy-Sell Volume Bar Gauge can be taken as confirmation for predicting the next move, but it should not be considered a major factor in making a trading decision.

Options Scalping FinNiftyThis Indicator is Owned by Team Option Scalping.
Top Right Corner TABLE ( 6 , 10 )
When you are trading in Fin Nifty futures , we have to check major Stocks which is contributing to Fin Nifty move. So we have given that in this tab.
This table consist 10 Stocks :
• CNXFINANCE
• HDFCBANK
• ICICBANK
• AXISBANK
• BAJFINANCE
• BAJAJFINSV
• KOTAKBANK
• SBIN
• HDFCLIFE
• SBILIFE
And following data of each stock has been provided:
• LTP
• Daily Change
• Daily Percentage Change
• 15-minute Change Percentage
• 1-Hour Change Percentage
This Table is completely different from Our other publish indicator named "Options Scalping V2". That consist of banking stocks data, and this consist of Nifty Stocks data. Data set are same but constituents are different.

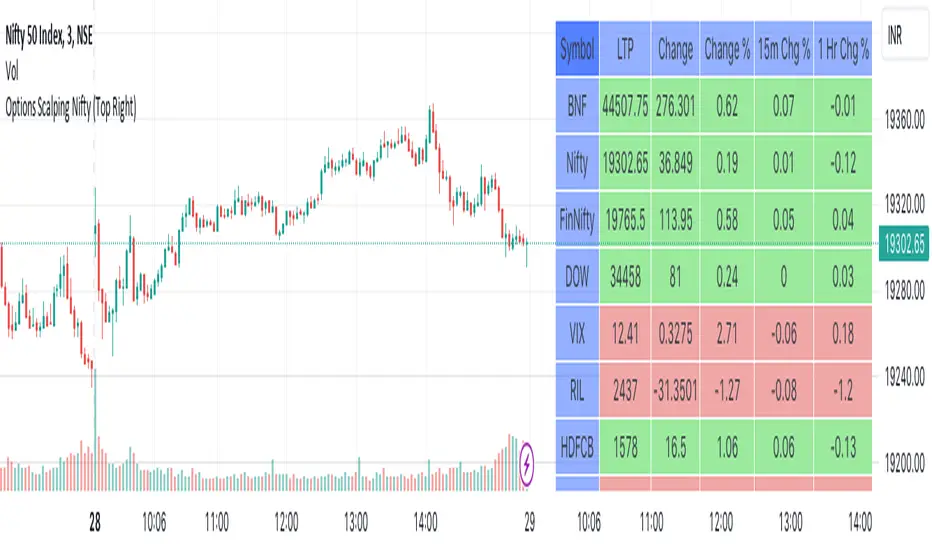
Options Scalping NiftyThis Indicator is Owned by Team Option Scalping.
Top Right Corner TABLE ( 6 , 10 )
When you are trading in Nifty futures , we have to check major Stocks which is contributing to Nifty move. So we have given that in this tab.
This table consist of 5 Major Indices and 5 Stocks :
• BankNifty
• Nifty
•FinNifty
• Dow
• VIX
• RIL
• HDFCBANK
• INFY
• TCS
• ICICBANK
And following data of each stock has been provided:
• LTP
• Daily Change
• Daily Percentage Change
• 15-minute Change Percentage
• 1-Hour Change Percentage
This Table is completely different from Our other publish indicator named "Options Scalping V2". That consist of banking stocks data, and this consist of Nifty Stocks data. Data set are same but constituents are different.
GRIDBOT Scalper by nnamWhat is this Indicator used for?
Made specifically for GRID Bots
note: before continuing... this indicator works on any timeframe, but it WORKS BEST ON THE 15 MINUTE TIMEFRAME
Straters and Forex Master Pattern Value Line Traders use this to help determine when the price could reverse.
This indicator is a scalping indicator that produces signals when a "potential" reversal in price is indicated. When the price moves UP and a Potential Bearish Reversal Signal occurs, traders can use this signal as a potential SHORT entry signal for their Short Grid Bot. The process is the same in reverse. After a sustained move down, a Potential Bullish Signal can be used by the trader as a potential LONG entry signal for their GridBot.
As shown in the screenshot below, lines develop on the chart (either RED or GREEN) indicating that a sustained move in one direction is currently occurring; however, there is no potential reversal signal plotted (this means that price action is currently moving in one direction only).
As shown in the screenshot below, lines can be used as a stop-loss after entering the GRIDbot. (usually, by this time, the Grid Bot is in Profit as it usually moves in the opposite direction first)
What this Indicator Does
The GRIDBOT Scalper provides information regarding potential reversals in the market after a sustained movement in one direction (either Bullish or Bearish).
The indicator is based on PRICE-ACTION ONLY and does not take into account the current state of the market (Bullish or Bearish).
Once the price moves in a particular direction for at least 14 bars , a line appears as shown in a previous screenshot. Once the price stops moving in that direction and begins moving in the opposite direction - and after a sustained run - a "signal" appears alerting the trader that a "potential" reversal could be on the horizon soon.
If price moves in one direction and plots both a line and a signal and then begins moving back in the other direction in a sustained manner, the original signal will remain even when a NEW line begins forming (the original line will disappear). (see below) This line will continue to move as the price continues to move. Not until a signal plots on the chart is the potential reversal forming. THE LINE DOES NOT SIGNAL A REVERSAL . Some traders, however, use this information to "ride the wave UP or DOWN" and exit their positions once the signal prints.
As shown below, optional input settings allow the trader to set the line at CLOSE or HIGH/LOW of the candle preceding the potential reversal.
It is suggested to use Close instead of High or Low but the setting allows one to use either.
As shown in the screenshot below, it is typical on LOWER TIME FRAMES to see the price pass the signal line. The Indicator works best on the 15 minute timeframe, as it gives the trader time to make the decisions required as the volatility is less on the 15 minute chart vs the 1 minute or 5 minute charts.
If you have any questions or suggestions for this indicator, please join our Discord. We offer free training on this Indicator on our Discord Server.

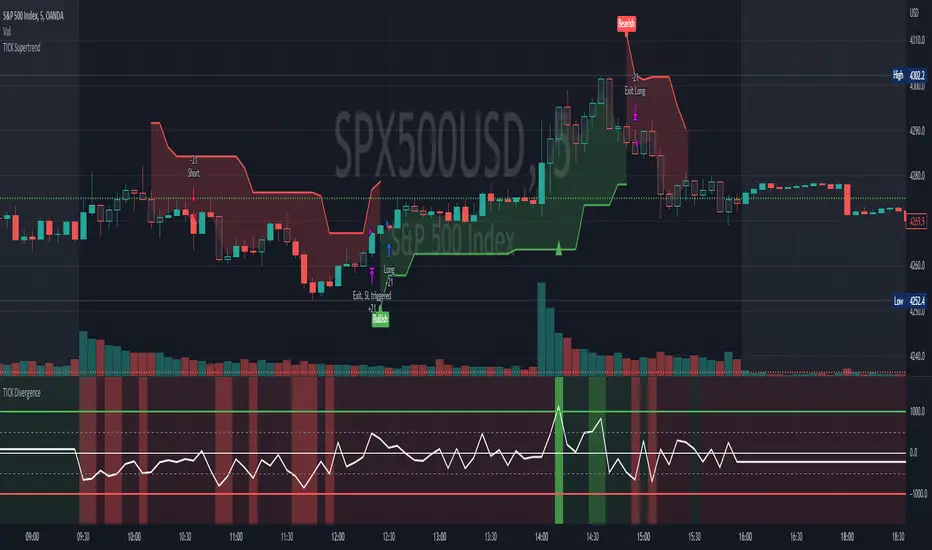
[Pt] TICK Supertrend Strategy, 5 minBackground:
It is well known that the indices such as SPY and QQQ follow/represent market sentiment. The TICK index literally represents the market sentiment as it compares the number of stocks that are rising and falling on the NYSE. By default, the TICK index is a short term indicator. Therefore it isn't reliable for swing trading or long term strategies. However, it is perfect for scalping.
Although TICK is well known, many does not know how to use it effectively. As part of the background mechanism of this script, I’ve divided TICK into 5 major zones based on the close of each candle: Overbought (neutral with bearish bias), Bullish, Neutral, Bearish, and Oversold (neutral with bullish bias). Along with the use of Heikin Ashi technique, RSI, moving averages and candle analysis, this strategy aims to provide accurate representation of market sentiment and profitable entry and exit points. *** At the time of publication, this strategy has proved to be consistently profitable. HOWEVER, this DOES NOT guarantee future profitability. So use at your own risk! ***
What is it showing?
This strategy is an intraday scalping strategy that uses TICK data to predict market directions for optimal entry and exit points. It is displayed similarly to the famous Supertrend indicator, which is one of the most common ATR based trailing stop indicators, so visually it is easy to read. This strategy is suitable for trading indices such as SPX , SPY , SPX500USD , QQQ , DJI and any other tickers that have high positive correlation with TICK.
Script is proprietary, but as mentioned it incorporates the following elements with additional candlestick analysis, pattern recognition, stop-loss and profit taking strategy:
- NYSE TICK data
- Heikin Ashi candle technique
- ATR
- RSI
- Moving Averages
Bullish trend is determined by a confluence of said indicators and analyses, and is displayed as a green line under the price action. The distance is defined by an adjustable value that is based on a percentage of the previous daily ATR value. When a long order is in play, that line also acts as the stop-loss level. Bearish trend is the opposite and is displayed in red, by default.
What's unique?
Detecting a ranging market structure and avoiding overtrading in a choppy market has always proven to be difficult, even for the most professional traders. This strategy has built-in “choppiness” and volatility filtering scripts that attempts to help reduce the number of false entries. These elements are what makes this strategy unique and different from other indictors mashup strategies.
In addition, this strategy takes previous trades into account and “learn” from past trades when determining the optimal stop-loss level to maximize profitability. This allows this strategy to better adapts to changing and evolving market conditions.
Strategy statistics
All parameters are designed for 5min time frame.
At the time of publication, this strategy has proved to be consistently profitable through limited back testing data.
Initial capital = $10000
Pyramiding = 1
Slippage = 3 ticks to account for spread
Default leverage shown = 9x
Quantity per trade = 100% of account
Back testing period at time of publication = Apr 11, 2022 - July 22, 2022
Trading Session = 1000 - 1530 Mon-Fri
Timeframe = 5 min
Gain = 1338.48%
Total trades = 253
% Profitable = 45.85%
Profit Factor = 2.506
Max Drawdown = 19.36%
Extras
This release includes default AutoView alerts for trading SPX500USD on Oanda. It includes both long and short order entry alerts, and trailing stop-loss alerts.
Please DM for free trial.
Pre-ScalperHello all,
It is an artificial intelligence indicator that can generate future predictions based on trend tracking and historical data analysis.
It will be in a period of continuous improvement to achieve the highest success rates.
You can use in all market in all time period.
This indicator does not contain any investment advice, it is only a helpful tool in your investments.
BINANCE:AAVEUSDTPERP

Signals Pirate™ Doji ScalperSignalsPirate™ Doji Scalper is provides users with an instant screener for the one of the most useful candlestick formations in trading and investing, while also providing signals for points of price reversals and variable levels of support and resistance! This package can take your technical analysis to the next level.
Doji candles are a great indication of indecisiveness in the market, and depending on when they occur can indicate upcoming volatility or even a trend reversal! The candles can be identified by their small bodies (distance between open and close price) and long top and bottom wicks (the candle high and lows).
The simplicity of this package ensures traders of all levels of expertise can utilise this tool and experience its benefits to the fullest. Outside of user preference and customisation options, the only variable that alters package performance is the ‘Sensitivity’ option, which dictates how frequently Doji candles will be detected based on how the candles are formed. A value of 10 indicates more lenient classification of Doji candles, where a value of 1 requires a perfect Doji formation before signalling!
The other options available for your alteration are:
The visibility of the variable levels of support and resistance, which are calculated using a variation of the ATR indicator to gauge asset volatility, as well as price action pivot points to indicate where trader interest may be.
Trend reversal labels for both potentially ‘Weak’ and ‘Strong’ reversals. These labels are created based on how price reacts to the varying levels of support and resistance, as well as the candlestick pattern and formation around those crucial levels.
The default settings are the best settings we’ve found so far but you can change them to build your own unique trading strategy. We’d recommend experimenting with these values to find the best results for the asset you are trading, and your own personal trading and investing style.
Direction for use:
1. Use on any asset class and time frame.
2. Fine tune the Doji Sensitivity variable.
3. Be cautious of upcoming volatility after a Doji signal, especially if the signal occurs near the support and resistance levels or after a large move, which could indicate a trend reversal.
4. Watch for Reversal signals, which can provide confluence with the Doji signals and give an early indication that price may soon start moving in the opposite direction.
As mentioned previously, this is a candlestick detection system that dynamically operates to function with superior accuracy regardless of what you’re trading. But with the level of customisation available, this can easily be fine tuned to accommodate scalping, reversal trading, or even long term investing.
We hope you love this package, and it takes your trading and investing to the next level. Please let us know if you have any questions or queries regarding the logic behind the bundle, or if you have any suggestions for improvements etc. We love your feedback and are constantly striving to continuously improve!

Premium ScalperThe strategy works with a combination of a number of different factors, including:
- Volume
- Moving averages
- Volatility
- RSI
This strategy generates long and short signals based on volume movements, moving averages and RSI. By combining other algorithms, low volatility periods can be filtered out.
The best results can be achieved by pairing the indicator with a bot through 3Commas and using a diversification strategy. This way you spread your risk over different pairs and you therefore also have a great chance of taking big moves.
The strategy results we display are results WITHOUT leverage. It is therefore also possible to only long on spot with this strategy, but for optimal results a trading bot link is required.
The settings we have used for these results are an order size of 100% with a 0.08% commission size.
Side note: This indicator does NOT use repainting!
We offer the possibility to try the indicator for free for 7 days.

Day Trading SPYThis script can be used to see a potential trend change, ride a trend and to scalp following the current trend.
Indicators:
- ATR (bright green/maroon) – is a longer term trend ATR line
- MA (green/red) - is a shorter term MA, where the fast MA is dotted and the long MA is a line
- Support and Resistance (white bold line) – long-term support and resistance areas
- Scalping signals (red/green) – small triangles above/below the candles bouncing off fast MA
- Black candles - oversized huge candles, which must be addressed carefully, especially when these candles change the trend per ATR, as with such huge candle – it is hard to determine where to place the stop-loss (if it is above/below the candle, since the candle is so big - it becomes a big risk). Also such candles may point to an unusual market moves. The size can be adjusted from 0.1 and up, it’s set to 1.4 by default, but it can be changed as needed. With such candles, it is best to wait and see what market does. If the black candle is following the ATR trend or changing the trend per ATR – wait for next 1-3 candles or so, usually those re-bounce in the opposite direction of the ATR trend, which allows you to open the position with a tighter stop-loss.
- Olive and Maroon candles – overbought and oversold candles per RSI (80/15 default) levels. At this levels just watch out for a potential soon reversal. Keep in mind, price may continue going oversold/overbought for a while, so look for additional confirmations.
1) ATR (long-term trend): The flag “Buy” and “Sell” signals (can set Alerts), which happens when the price is crossing through ATR line, marking a potential trend change. If ATR matches MA and ideally there is a breakout - open position in the direction of the signal and use the ATR line as your initial hard stop-loss until you reach the first price target / take first profit. It is best to use the most recent high/low pivot or a Fibonacci extension for the first price target. Once you take it – move SL to entry to secure the profits. If the trend continues and you take the next price target, you can use the fastMA (dotted line) as your dynamic stop-loss to ride the trend. Use the bold white line (long-term support and resistance) where price may certainly reverse where you can close your position completely if you day-trading Options.
2) MA (scalping): The small green and red triangles below/above the bars (can set Alerts), which appear when the price “touches” the fast MA (dotted line) and re-bounces from it with the candle matching the direction (bullish/bearish). Make sure ATR and MA are both going in the same direction for best results. This can be used to scalp for small profits or to jump into the trend. To minimize the risk, since you are jumping into the trend, I suggest placing your stop-loss slightly above/below the candle (the one which bounced off the fast MA). Price targets are similar – most recent high/low pivot or a Fibonacci extension. Same way, once you take the first profit/reach the first price target, move SL to entry and on the next price target – use the fast MA as your dynamic stop-loss.
If you don’t know how to divide up your position - here is an example on how I take profits between the price targets:
- Open position with buying a multiple of x4 contracts
- Sell ½ of the position at first price target and move my SL to entry
- Sell ½ of the remaining position at a second price target
- Sell the rest of the position at the third price target or sell ½ of it and use the fast MA as my dynamic stop-loss for the remaining of the position
Also, keep an eye on the breakouts, especially if they go along the ATR and MA trend and keep an eye on the volume, which may help confirming the direction of the price.

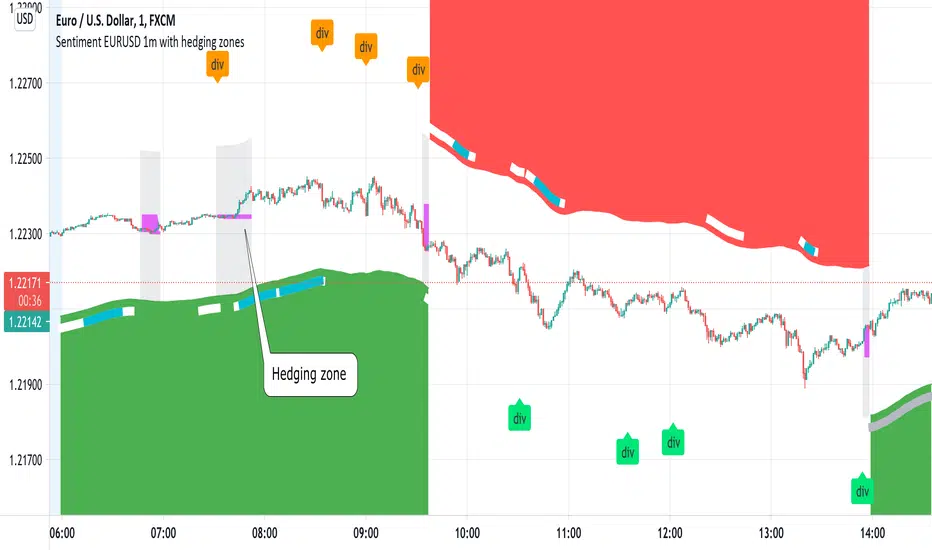
Sentiment EURUSD 1m with hedging zonesThis is a very specialised and optimized script, for 1m EURUSD traders - daytraders, scalpers.
1m trading is very difficult, but it can be also most profitable, if done right.
Why difficult? It is hard to detect market direction - usually when trend indicators reverse, that new trend is already over. One and the same indicator signal sometimes provides one outcome (for example reversal) and sometimes exactly the opposite (continuation). It requires deep understanding on WHEN to use which indicator and when to ignore signals. Set the parameters of your indicators to a very sensitive extent and they will keep changing direction back and forth - always being too late of course :) Set the parameters too losely, and you'll be late with entries 100% of times. Looking for universal trend-showing indicator? There is none...
This script is a result of 2 years of practical following EURUSD 1m market action. Looking at charts with MANUAL TRADER'S eyes. Analyzing all together: price action, indicators, zigzag, divergences, momentum, pivot points, support and resistance. On the one hand traders say only manual trading can be successful and on the other - to stick to one strategy and be automatic when applying to it. So this is it - automatic coding of market signals as if manual trader would do it. Forex is news-driven? Yes, it is. So if market sentiment changes because of some news happening, the script will quickly recognize it and suggest reversal.
Please note I'm not pretending to have a crystal ball. Nobody has. The goal of this script is not to predict where EURUSD market will be, but to correctly notice that is has reversed. Nothing else.
Sometimes the market will move towards reversal, but not cross the line yet - these are so-called HEDGING ZONES. Sometimes they turn out to be reversals and sometimes simply best places for dip entries. Ideally a trader should hedge there, because market could move either way. You might wanna apply apply knowledge of market fundamentals there or look into some micro-indicators. Anyway, it is good to realize where those zones are and this script shows them. In pink.
It is invite-only script. DM me for access.
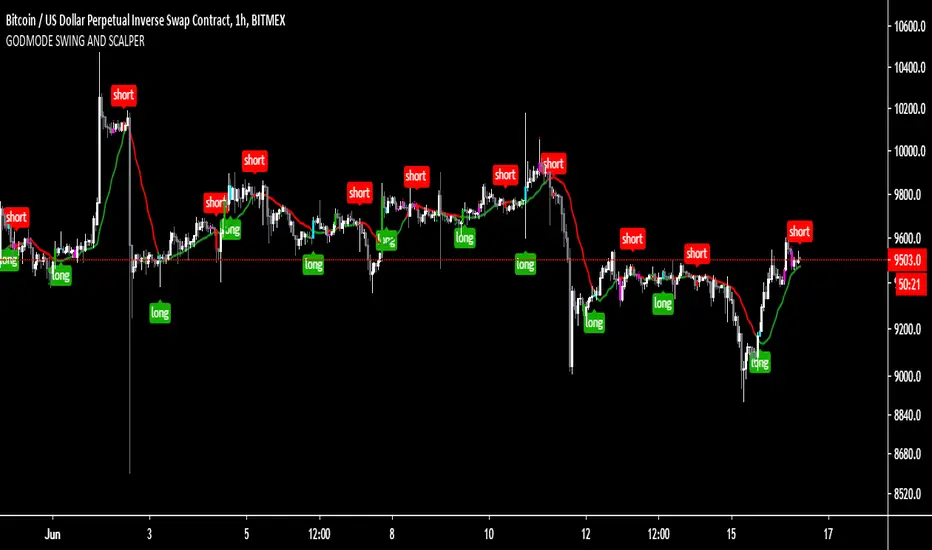
GODMODE SWING AND SCALPERGODMODE SWING AND SCALPER
This script is the fusion of Swing trades and Scalping trades
how to use :
" Buy " when " long " signal appears
Take profits or close " Buy " position when Red triangle appears
" Sell " when " short " signal appears
Take profits or close " Sell " position when Green triangle appears
basic 20 moving average for support and resistance
best use on 1 hour time frame
direct message me for access
MATICUSDT M15 SCALPER Binance - Longs OnlyMATICUSDT M15 SCALPER Binance - Longs Only
AmazingBulls Scalping System detects trends & opens only LONG positions on 15 Minute Timeframe in Binance.
Dont use it on any other coins or any other timeframes or any other direction or any other Exchange
Coin : MATICUSDT
Exchange : Binance
Direction : LONG Only
Timeframe : M15

[M10] Quad MA Trend ScalperFour adjustable moving averages set in order to produce buy and sell signals, works best on smaller timeframes from my backtesting, 10M - 30M seems optimal for scalping.
The idea behind this script is to only enter positions that are following the trend in order to minimise drawdown and decrease risk when using leverage.
The script will only enter long positions when MA crossover occurs above the Long MA 2.
The script will exit a long position when MA Short crosses below Long MA 1.
The script will only enter short positions when MA cross under occurs below the Long MA 2.
The script will exit a short position when MA Short crosses below Long MA 1.
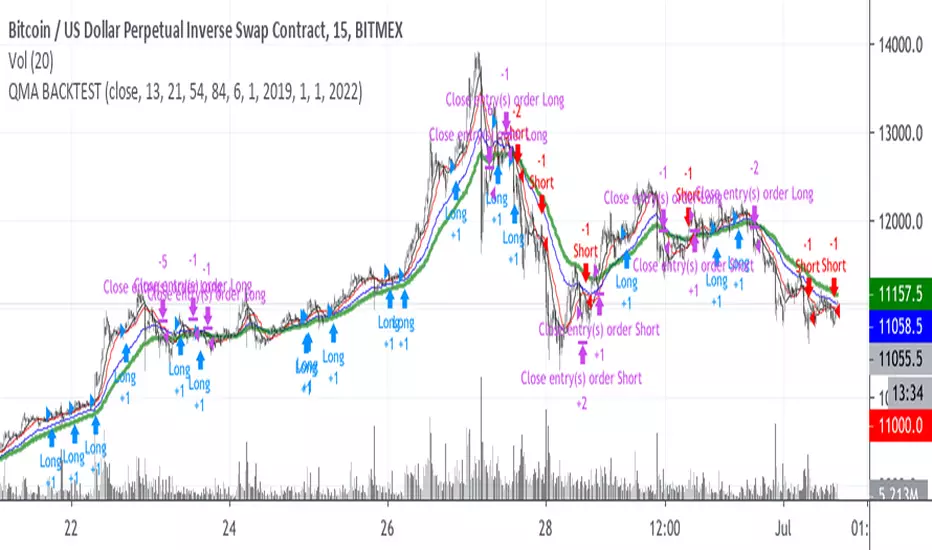
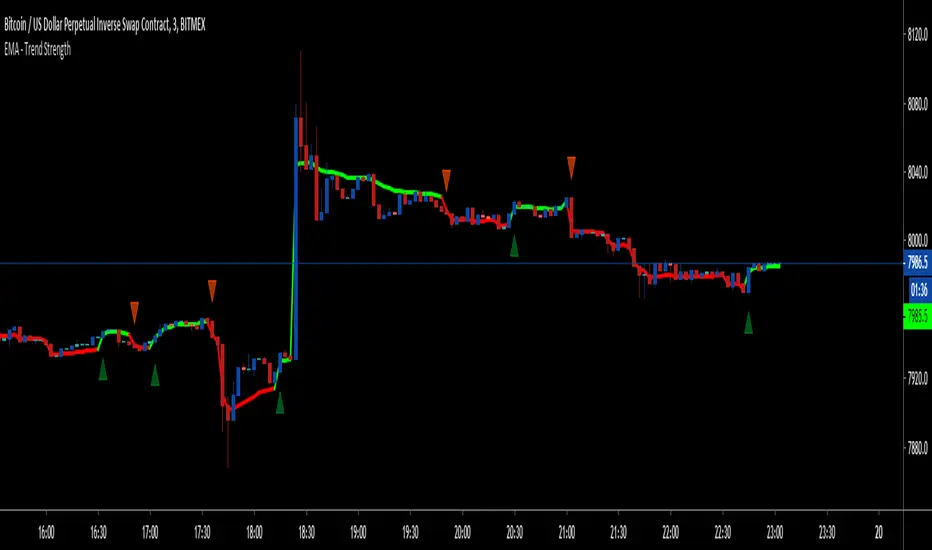
EMA - Trend Strength - 1m ScalperThis is a very special script based on volume, supertrend and ATR which works successfully on a 1m chart for bitmex.
ETH/USD
LTCM19
XRPM19
EOSM19
ADAM19
BCHM19
*private use only
CryptoScalper: NightMODE by BiO-618Hey guys!
It's me with a new version of the script.
Since a lot of people wanted to use it for scalping, I adjusted it for that.
More buy signals, more sell signals, 90% accuracy (at least ;) )
Remember to use the pivots to set Take Profits and Stop Losses, no software is 100% accurate, otherwise the market would trash it.
SELL SIGNALS
Red "S": Sell signal
Yellow "Sell": Strong+ sell signal
Orange "SELL": Strong++ sell signal. Shortable signal.
Red triangledown "SELL!": Strongest+++ sell signal, bearish divergences from MACD . Shortable signal.
BUY SIGNALS
Yellow triangleup "Weakening": Bear trend is getting weak, as the asset is getting oversold.
Green "BUY!": Strong buy, bullish divergence from MACD . Strongest buy signal.
Remember, again, to ALWAYS set your TP and SL beforehand. The key to be profitable is to act before the market acts.
It's better 3% in hand than 1% below your initial balance.
From a manual backtesting, I got a 53% profit on 2 weeks, trust my advice to manage the risk and you will be profitable aswell ;)
Check my other scripts to get more options :)
I also made a 4Hours and 12Hours optimized scripts, you might found that which one works better for your strategy, asset, and timeframe.

TB!G-Scalp Strategy [Backtest]Scalping Crypto Assets Made Easy
TB!G-Scalp is a TradingView based alert and accompanying strategy PineV3 Script.
Backtest vs Realtime
When designing the algorithms for this strategy our focus was primarily on ease of use.This results in a beautiful yet easy to use scalping strategy. As input it takes a chart period and only one extra parameter for fine tuning. The backtest results are an accurate representation of it’s real-time behaviour.
What makes it tick?
Over the last 2 years we collected a lot of market data regarding Bull and Bear behaviours. This previous market behaviour echo’s into the current market trend.
By recognising these echo’s we are able to anticipate an upcoming micro reversal which eventually end up being a scalping strategy.
Interested
Access is provided to a limited amount of people and for the duration that is determined by it’s Alpha Decay Rate.
This ADR is expected to become problematic after 2.3 year of usage on a lot of 150 users.

Dany_ema_Scalping_4dany_ema_Scalping_4
A very powerful tool for the trader who performs scalping of 5m, was tested in 500 operations, of which 455 were successful.
consists of making entries to the market in combination of the signal "B" and the blue bars, this is applying price action, cu enta with supports and dynamic resistances, the volume of the RSI price is based on the volume.
The best way to operate in 5m time, and checking the supports and making purchases when you have the B sign and the blue bars.
practice it and see its power.
Torres Dany
