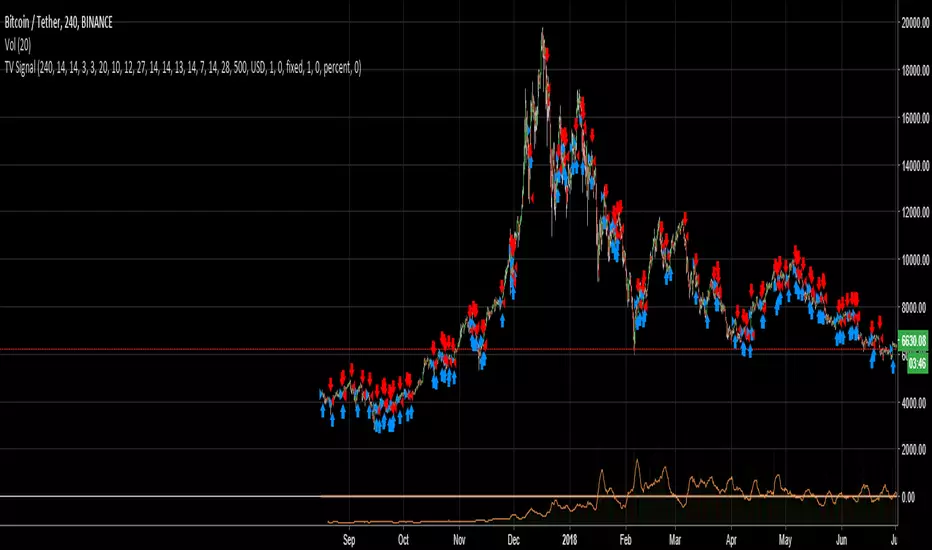
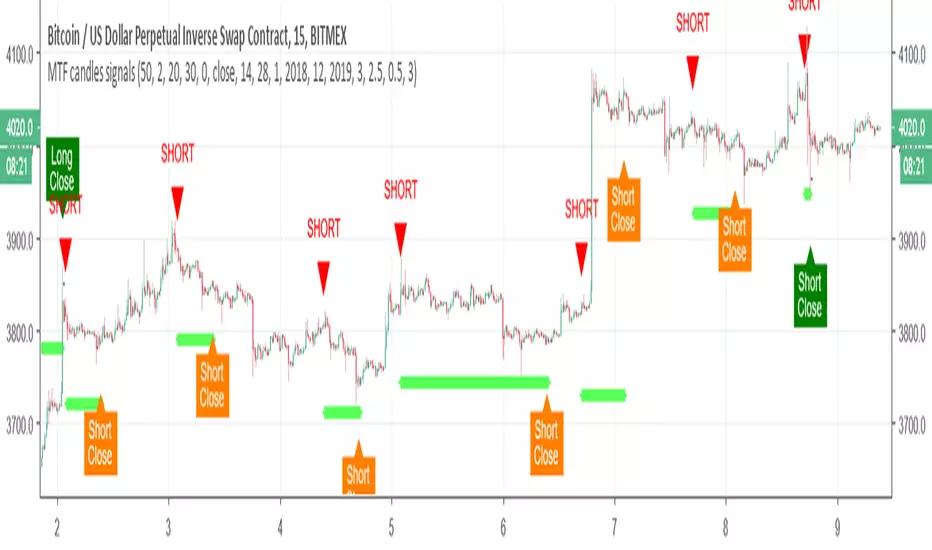
example for panel signalsThis is just easy way to make your take profit , stop loss etc in panel
so any signal or lines you can can put via similar template
the strategy here is not important
Recherche dans les scripts pour "signal"

X Period High/Low/MidToday we have a simple, but endlessly versatile, indicator that plots the X Period High/Low/Mid of your chosen market.
Traditionally the 52 week High/Low is used as a breakout signal. However, by changing to an X period, and adding a midway line, we create a more versatile indicator that can be tailored to various markets.
By default it's set at 250 periods (because I like the 250 period moving average), and I generally trade H4 and Daily time frames. But tweak it to your liking, you just have to modify the length periods by your desired time frame and lookback length. E.g. to create a 52 week indicator on the daily time frame, enter a length of 260 in the indicator (5 days per week * 52 weeks = 260).
For the above reason, I haven't made this indicator MTF, as there's no real need. However, if users find it easier I can look at adding it later.
Also, the mid point between an X period high/low is often a good trend-follower, as well as acting as support/resistance . I encourage you to experiment with different ways of using this indicator. Entire systems (if your risk management is correct) can be built and traded from this one indicator.
Good luck.
DD

Buy Sell SignalsFinding the high winning percentage trade signals.
It will be public for a month.
If you like it, please message me

Buy Sell SignalsFinding the high winning percentage trade signals.
It will be public for a month.
If you like it, please message me


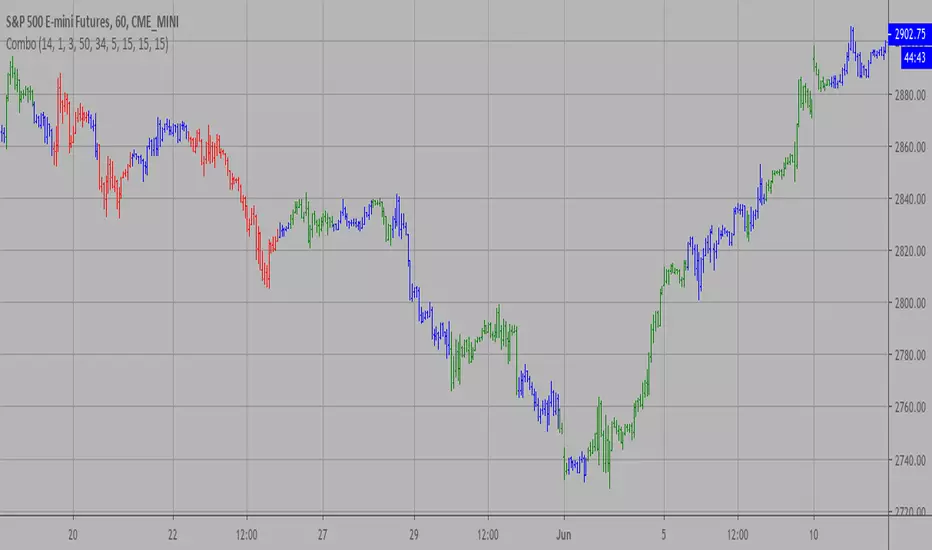
Hull Trend with KahlmanThis is an update to the idea of
The Kahlman smoother makes the signal more precise (by one candle).

Consensio With SignalsUsing the ideas from "Consensio" system, by Tyler Jenks, this Indicator shows a Buy and sell values, with 3 levels
using the position order of 3 smas: short, medium and large
There are 3 combinations indicating buy and 3 indicating sell:
Example: LSM (Long SMA Top, Then Short, Then Medium)
3 levels each. More level more power signal for buy or sell
MLS = Sell Level 1
LSM = Sell Level 2
LMS = Sell Level 3
SLM = Buy Level 1
SML = Buy Level 3
MSL = Buy Level 2
The triangles on top of the indicator shows any cross of the 3 SMAs and the level of buy/sell signal of the combination


Combo Backtest 123 Reversal & Bill Williams. AO with Signal Line This is combo strategies for get a cumulative signal.
First strategy
This System was created from the Book "How I Tripled My Money In The
Futures Market" by Ulf Jensen, Page 183. This is reverse type of strategies.
The strategy buys at market, if close price is higher than the previous close
during 2 days and the meaning of 9-days Stochastic Slow Oscillator is lower than 50.
The strategy sells at market, if close price is lower than the previous close price
during 2 days and the meaning of 9-days Stochastic Fast Oscillator is higher than 50.
Second strategy
This indicator plots the oscillator as a histogram where blue denotes
periods suited for buying and red . for selling. If the current value
of AO (Awesome Oscillator) is above previous, the period is considered
suited for buying and the period is marked blue. If the AO value is not
above previous, the period is considered suited for selling and the
indicator marks it as red.
You can make changes in the property for set calculating strategy MA, EMA, WMA
WARNING:
- For purpose educate only
- This script to change bars colors.

Combo Strategy 123 Reversal & Bill Williams. AC with Signal Line This is combo strategies for get a cumulative signal.
First strategy
This System was created from the Book "How I Tripled My Money In The
Futures Market" by Ulf Jensen, Page 183. This is reverse type of strategies.
The strategy buys at market, if close price is higher than the previous close
during 2 days and the meaning of 9-days Stochastic Slow Oscillator is lower than 50.
The strategy sells at market, if close price is lower than the previous close price
during 2 days and the meaning of 9-days Stochastic Fast Oscillator is higher than 50.
Second strategy
This indicator plots the oscillator as a histogram where blue denotes
periods suited for buying and red . for selling. If the current value
of AO (Awesome Oscillator) is above previous, the period is considered
suited for buying and the period is marked blue. If the AO value is not
above previous, the period is considered suited for selling and the
indicator marks it as red.
You can make changes in the property for set calculating strategy MA, EMA, WMA
WARNING:
- For purpose educate only
- This script to change bars colors.
24/9 EMA with Bias & SignalsThis is a simple indicator that plots the 24 & 9 EMAs.
It also highlights the potential bias of the market (bull or bear) based on if the 9 EMA is above or below the 24 EMA.
In addition there are signal crosses that you can use for alerts.
This indicator is best used to confirm a particular underlying bias on the 5m, 15M, 1HR, 4HR, and Daily timeframes.
It's important to note on lower timeframes that the bias can be counter trend bias of the overall larger momentum of the instrument you are trading.
For clarity this means that many retraces get going when the 9 crosses the 24. But ultimately the larger timeframe bias will continue after this counter trend retraces.
Combining this indicator with value channels and ATR is what I recommend.

10/20 MA Cross-Over with Heikin-Ashi Signals by SchobbejakThe 10/20 MA Heikin-Ashi Strategy is the best I know. It's easy, it's elegant, it's effective.
It's particularly effective in markets that trend on the daily. You may lose some money when markets are choppy, but your loss will be more than compensated when you're aboard during the big moves at the beginning of a trend or after retraces. There's that, and you nearly eliminate the risk of losing your profit in the long run.
The results are good throughout most assets, and at their best when an asset is making new all-time highs.
It uses two simple moving averages: the 10 MA (blue), and the 20 MA (red), together with heikin-ashi candles. Now here's the great thing. This script does not change your regular candles into heikin-ashi ones, which would have been annoying; instead, it subtly prints either a blue dot or a red square around your normal candles, indicating a heikin-ashi change from red to green, or from green to red, respectively. This way, you get both regular and heikin ashi "candles" on your chart.
Here's how to use it.
Go LONG in case of ALL of the below:
1) A blue dot appeared under the last daily candle (meaning the heikin-ashi is now "green").
2) The blue MA-line is above the red MA-line.
3) Price has recently breached the blue MA-line upwards, and is now above.
COVER when one or more of the above is no longer the case. This is very important. You want to keep your profit.
Go SHORT in case of ALL of the below:
1) A red square appeared above the last daily candle (meaning the heikin-ashi is now "red").
2) The red MA-line is above the blue MA-line.
3) Price has recently breached the blue MA-line downwards, and is now below.
Again, COVER when one or more of the above is no longer the case. This is what gives you your edge.
It's that easy.
Now, why did I make the signal blue, and not green? Because blue looks much better with red than green does. It's my firm believe one does not become rich using ugly charts.
Good luck trading.
--You may tip me using bitcoin: bc1q9pc95v4kxh6rdxl737jg0j02dcxu23n5z78hq9 . Much appreciated!--

Complete Ichimoku Trader *modified*I just found this script from @kingthies here and like it. So i just made some changes and added some little code into it.
Reduced some noise for the signals. Hope anyone can enjoy it. But keep in mind, did not test it on live trading! Had just some time and love to work in pine :)
Original
Happy Trading

Keltner Channel signalsUsing pupytherapy script
and the same system that we use for Bollinger and linear channel we can make easy the signal for the Keltner channel
I need to think how to make all those channels to combine I hope in next version I could do it :)

Candlestick Signals StrategyThis strategy allows you to pick from 9 different candlestick patterns, and test them against historical data from your chart. You can get a good idea what patterns work best for each chart by turning each pattern on and off in the settings.

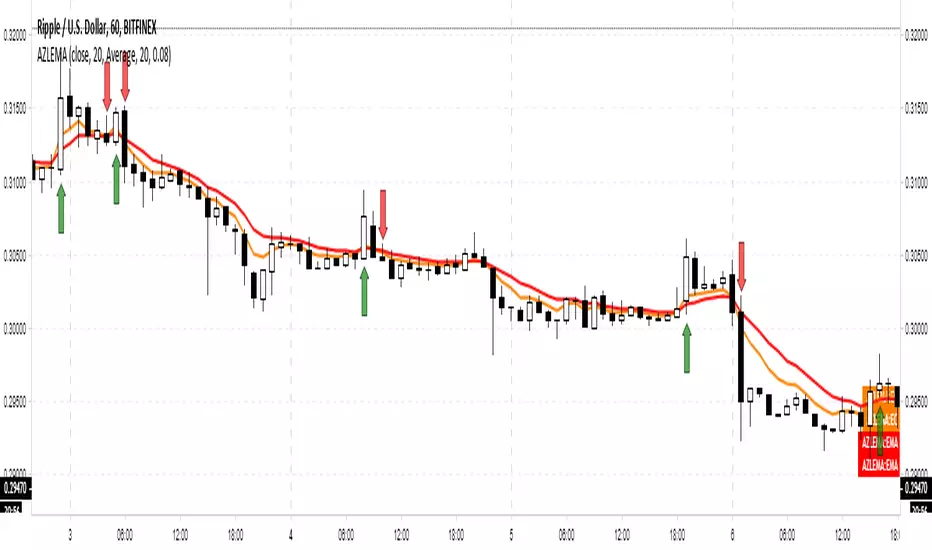
Adaptive Zero Lag EMA [STUDY]A user has asked for the Study/Indicator version of this Strategy .
If you encounter the error "loop....>100ms" simply toggle the eye icon to hide and unhide the indicator
The following is simply quoted from my previous post for your convenience: (obviously there won't be risk, Stop Loss, or Take profit parameters!)
OPERATING PRINCIPLE
The strategy is based on Ehlers idea that any indicator can be turned into a signal-producing trade system through smoothing and other filtering processes.
In fact, I'm using his Zero Lag EMA ( ZLEMA ) as a baseline indicator as well as some code snippets he has made public (1). God bless open source!
Next, I've provided the option to use an Instantaneous Frequency Measurement (IFM) method, which will adaptively choose the best period for the ZLEMA (2)
I've written other studies that use the differential calculus approximations for IFM, so it was only natural to include them in this strategy.
The primary two are Cosine IFM (3) and In-phase Quadrature IFM (4). You can also find an indicator with both plotted and the ability to average them together, as one IFM prefers long periods and the other short. (5)
BEFORE WE BEGIN
1. This strategy only runs on "normal" FX pairs ( EURUSD , GBPJPY , AUDUSD ...) and will fail on Metals or Commodities.
Cryptos are largely untested.
2. Please run it on these time frames: M15 to D.
Anything outside this range will likely fail.
HOW TO USE AND SUCCEED
1. If the Default settings don't produce good results right off the bat, then lower gain limit to 1 or 2 and threshold to 0.01.
2. Test each setting under adaptive method. If you want to leave it Off, then I'd recommend using some kind of IFM (see my links below) to
discover the most efficient period to use.
3. Once you have the best adaptive method chosen, begin incrementing gain limit until you find a nice balance between profit factor ( PF ) and drawdown.
4. Now, begin incrementing threshold. The goal is to have PF above 2 and a drawdown as low as possible.
5. Finally, change the source! Typically, close is the best option, but I have run into cases where high
yielded the highest returns and win rate.
6. Sit back, relax, and tweak the risk until you're happy with the return and drawdown amounts.
ADVANCED
You may need to adjust take profit (TP) points and stop loss (SL) points to create the best entry possible. Don't be greedy! You'll likely have poor
results if the TP is set to 300 and SL is 50.
If you are trading a pair that has a long Dominant Cycle Period, then you may increase Max Period to allow the IFM
to accept longer periods. Any period above the Max Period will be rejected. This may increase lag time!
Cheers and good luck trading!
-DasanC
(1)www.mesasoftware.com
(2)www.jamesgoulding.com
(3) Cosine IFM
(4) I-Q IFM
(5) Averaging IFM
IFM stands for Instantaneous frequency measurement
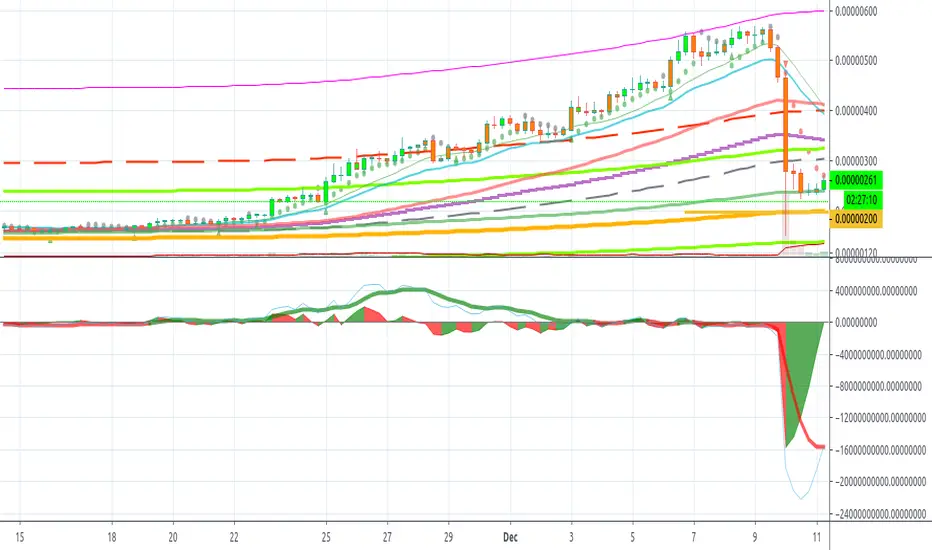
Volume ImpactVolume Impact (The area)
Average Volume (The thick line, xTrigger)
Volume Impact = Volume Chance - Average Volume
It provides very reliable buy sell signals. Buy(green) when increasing, sell(red) when decreasing. Volume Impact might drop before the actual price so it has an early warning potential.
Before trend changes volume average diverges from the prices. It moves reverse to the prices.
Also before trend changes, volume impact peaks diverges from price peaks. So you know a big drop is coming.
Klinger Volume Oscillator inspired this indicator... This data is there but it is more difficult to interpret.
In summary, you can foresee trend changes.
MTF candles by yatrader2 signalsthis is the signal version of this study
alerts included
for more detail look at original study
Renko Strategy Open_CloseSimple Renko strategy, very profitable. Thanks to vacalo69 for the idea.
Rules when the strategy opens order at market as follows:
- Buy when previous brick (-1) was bearish and previous brick (-2) was bearish too and actual brick close is bullish
- Sell when previous brick (-1) was bullish and previous brick (-2) was bullish too and actual brick close is bearish
Rules when the strategy send stop order are the same but this time a stop buy or stop sell is placed (better overall results).
Note that strategy open an order only after that condition is met, at the beginning of next candle, so the actual close is not the actual price.
Only input is the brick size multiplier for stop loss and take profit: SL and TP are placed at (brick size)x(multiplier) Or put it very high if you want startegy to close order on opposite signal.
Adjust brick size considering:
- Strategy works well if there are three or more consecutive bricks of same "color"
- Expected Profit
- Drawdown
- Time on trade
This strategy uses Renko charts with TRADITIONAL bricks, so no repaint.
Study with alerts, MT4 expert advisor and jforex automatic strategy are available at request.
Please use comment section for any feedback.

Candlestick smoother + x-SignalingHey!
This is a script I remade from various scripts I had.
It's a smoother of candlestick by VWMA , that means that will give information about the trend strenght and actual situation, as you might notice.
I also added a crossing over signaling with RED/GREEN colours.
When the chart is coloured red, means that soon there will be a selling opportunity.
When the chart is coloured green, means that soon there will be a buying opportunity.
For any question, just do it! ;)
Enjoy the ride, and always φ !
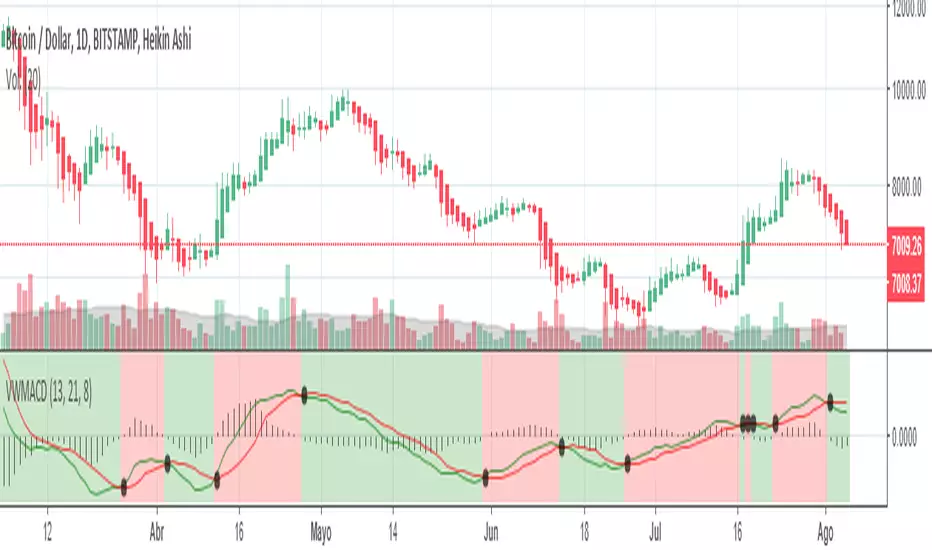
Volume Weighted MACD + x-SignalingThis is a script I remade from 2 previous TDuser's scripts.
Thanks community for sharing, I hope you find it useful.
φ!
Ichimoku With SignalsA variation on Ichimoku Cloud that has markers for strong/neutral/weak bullish/bearish signals.