ST_Trend_ReversalSTRONG TREND REVERSAL INDICATOR
The code is the percentage difference between the spot price of a given financial asset and its 200-day MA of that period. My standard setup is Daily, and I think it's got very good predictive power at that timeframe.
It can be read in two ways:
1. Values extremely above or below the 200-period MA present chances of buying/selling agains the prevailing trend.
2. Values closely above or below the 200-period MA are make-or-break market periods, where a medium-term trend becomes evident. Breaks above or below the MA are associated with strong chances of directional movements. But it's not fool-proof as false breaks have become commonplace nowadays.
Other way to use it is as confirmation of breakdowns: For example, an asset that loses its 200-day MA and then can't rally above it becomes exposed to steep losses afterwards.
It's also helpful to use in volatility trading: the closer the asset goes to its MA, the lower goes implied vol, and thus better opportiunities to be long volatility on those occasions where direction is hard to predict.
STRI = close/(200dMA)
Values over 100 indicate percentage premiums of spot vs its moving average.
Values below indicate percentage discounts of spot vs its moving average.
Recherche dans les scripts pour "吉马良斯VS摩雷伦斯"

Ersoy-intersection(Kesisme)-Update-1website: www.ersoytoptas.com
Newspaper : tr.investing.com
hi , Friends
i wanna be someone who wants to help everyone
updated my script he published some time ago.
What happened?
* intersection When ever Bar Color Yellow Be
* Alarms to be more comprehensible
* Short and Long Days Choosing a Opportunities
* Source Opportunities
All Charts Usable( Example ;15,30,60 ... vs) and ALL MARKETS ( Stocks , forex , ... vs)
i strive to improve further
Easy to get

Candle Spread + ATR SMA Analysis
This indicator combines elements from two popular open-source scripts — Candle Range Compare
by @oldinvestor
and Objective Analysis of Spread (VSA)
by @Rin-Nin
— into a single tool for analyzing candle spreads (ranges and bodies) in relation to volatility benchmarks.
🔎 What It Does
Candle Decomposition:
Plots total candle ranges (high–low) in gray, for both up and down closes.
Plots up-close bodies (open–close) in white.
Plots down-close bodies in black.
This makes it easy to spot whether volatility comes from real price movement (body) or extended wicks.
ATR & SMA Volatility Bands:
Calculates ATR (Average True Range) and overlays it as a black line.
Plots four volatility envelopes derived from the SMA of the true range:
0.8× (blue, shaded)
1.3× (green)
1.8× (red)
3.0× (purple)
Colored fill zones highlight when candle spreads are below, within, or above key thresholds.
Visual Context:
Track expansion/contraction in spreads.
Compare bullish (white) vs bearish (black) bodies to gauge buying/selling pressure.
Identify when candles stretch beyond typical volatility ranges.
📈 How To Use It
VSA context: Wide down bars (black) beyond ATR bands may suggest supply; wide up bars (white) may indicate demand.
Trend confirmation: Expanding ranges above average thresholds (green/red/purple bands) often confirm momentum.
Reversal potential: Small bodies but large ranges (gray + wicks) frequently appear at turning points.
Volatility filter: Use ATR bands to filter trades — e.g., only act when candle ranges exceed 1.3× or 1.8× SMA thresholds.
🙏 Credits
This script is inspired by and combines ideas from:
Candle Range Compare
by @oldinvestor
Objective Analysis of Spread (VSA)
by @Rin-Nin
Big thanks to both authors for their valuable contributions to the TradingView community.
One thing I couldnt quite get to work is being able to display up and down wicks like in the candle range compare, so I just add that indicator to the chart as well, uncheck everything but the wick plots and there it is.

BTCUSD Weekly Sell Signal – Visual Trade SetupThis indicator highlights a long-term SELL signal on BTCUSD (Bitcoin vs US Dollar) based on weekly chart structure.
Levels included:
— Entry: 11080
— Stop Loss: 11160
— Take Profits: 11040, 11000, 10960
A visual aid for swing traders to monitor bearish momentum on higher timeframes.
🟢 For educational use only.
❗ Always combine with your personal analysis and manage risk responsibly.

AVWAP+RSI Confluence — 1R TesterRSI + 1R ATR - Monthly P\&L (v4)
WHAT THIS STRATEGY DOES (OVERVIEW)
* Pine strategy (v4) that combines a simple momentum trigger with a symmetric 1R ATR risk model and an on-chart Monthly/Yearly P\&L table.
* Momentum filter: trades only when RSI crosses its own SMA in the direction of the trend (price vs Trend EMA).
* Risk engine: exits use fixed 1R ATR brackets captured at entry (no drifting targets/stops).
* Accounting: the table aggregates percentage returns by month and year using strategy equity.
ENTRY LOGIC (LONGS & OPTIONAL SHORTS)
Indicators used:
* RSI(rsiLen) and its SMA: SMA(RSI, rsiMaLen)
* Trend filter: EMA(emaTrendLen) on price
Longs:
1. RSI crosses above its RSI SMA
2. RSI > rsiBuyThr (filters weak momentum)
3. Close > EMA(emaTrendLen)
Shorts (optional via enableShort):
1. RSI crosses below its RSI SMA
2. RSI < rsiSellThr
3. Close < EMA(emaTrendLen)
EXIT LOGIC AND RISK MODEL (1R ATR)
* On entry, snapshot ATR(atrLen) into atrAtEntry and the average fill price into entryPx.
* Longs: stop = entryPx - ATR \* atrMult; target = entryPx + ATR \* atrMult
* Shorts: mirrored.
* Stops and targets are posted immediately and remain fixed for the life of the trade.
POSITION SIZING AND COSTS
* Default position size: 25% of equity per trade (adjustable in Properties/inputs).
* Commission percent and a small slippage are set in strategy() so backtests include friction by default.
MONTHLY / YEARLY P\&L TABLE (HOW IT WORKS)
* Uses strategy equity to compute bar returns: equity / equity\ - 1.
* Compounds bar returns into current month and current year; commits each finished period at month/year change (or last bar).
* Renders rows as years; columns Jan..Dec plus a Year total column.
* Cells colored by sign; precision and maximum rows are controlled by inputs.
* Values represent percentage returns, not currency P\&L.
VISUAL AIDS
* Two pivot trails (pivot high/low) are plotted for context only; they do not affect entries or exits.
CUSTOMIZATION TIPS
* Raise rsiBuyThr (long) or lower rsiSellThr (short) to filter weak momentum.
* Increase emaTrendLen to tighten trend alignment.
* Adjust atrLen and atrMult to fit your timeframe/instrument volatility.
* Leave enableShort = false if you prefer long-only behavior or shorting is constrained.
NON-REPAINTING AND BACKTEST NOTES
* Signals use bar-close crosses of built-in indicators (RSI, EMA, ATR); no future bars are referenced.
* calc\_on\_every\_tick = true for responsive visuals; Strategy Tester evaluates on bar close in history.
* Backtest stop/limit fills are simulated and may differ from live execution/liquidity.
DISCLAIMERS
* Educational use only. This is not financial advice. Markets involve risk. Past performance does not guarantee future results.
INPUTS (QUICK REFERENCE)
* rsiLen, rsiMaLen, rsiBuyThr, rsiSellThr
* emaTrendLen
* atrLen, atrMult, enableShort
* leftBars, rightBars, prec, showTable, maxYearsRows
SHORT TAGLINE
RSI momentum with 1R ATR brackets and a built-in Monthly/Yearly P\&L table.
TAGS
strategy, RSI, ATR, trend, risk-management, backtest, Pine-v4

Perp Imbalance Zones • Pro (clean)USD Premium (perp vs spot) → (Perp − Spot) / Spot.
Imbalance (z-score of that premium) → how extreme the current premium is relative to its own history over lenPrem bars.
Hysteresis state machine → flips to a SHORT bias when perp-long pressure is extreme; flips to LONG bias when perp-short pressure is extreme. It exits only after the imbalance cools (prevents whipsaw).
Price stretch filter (±σ) → optional Bollinger check so signals only fire when price is already stretched.
HTF confirmation (optional) → require higher-timeframe imbalance to agree with the current-TF bias.
Gradient visuals → line + background tint deepen as |z| grows (more extreme pressure).
What you see on the pane
A single line (z):
Above 0 = perp richer than spot (perp longs pressing).
Below 0 = perp cheaper than spot (perp shorts pressing).
Guides: dotted levels at ±enterZ (entry) and ±exitZ (cool-off/exit).
Background tint:
Red when state = SHORT bias (perp longs heavy).
Blue when state = LONG bias (perp shorts heavy).
Tint intensity scales with |z| (via hotZ).
Labels (optional): prints when bias flips.
Alerts (optional): “Enter SHORT/LONG bias” and “Exit bias”.
How to use it (playbook)
Attach & set symbols
Put the script on your chart.
Set Spot symbol and Perp symbol to the venue you trade (e.g., BINANCE:BTCUSDT + BINANCE:BTCUSDTPERP).
Read the bias
SHORT bias (red background): perp longs over-extended. Look for short entries if price is at resistance, σ-stretched, or your PA system agrees.
LONG bias (blue background): perp shorts over-extended. Look for long entries at support/σ-stretched down.
Entries
Use the bias flip as a context/confirm. Combine with your structure trigger (OB/level sweep, rejection wick, micro-break in market structure, etc.).
If useSigma=true, only trade when price is already ≥ upper band (shorts) or ≤ lower band (longs).
Exits
Bias auto-exits when |z| falls below exitZ.
You can also take profits at your levels or when the line fades back toward 0 while price mean-reverts to the middle band.
Tuning (what each knob does)
enterZ / exitZ (signal strictness + hysteresis)
Higher enterZ → fewer, cleaner signals (e.g., 1.8–2.2).
exitZ should be lower than enterZ (e.g., 0.6–1.0) to prevent flicker.
lenPrem (context window for z)
Larger (50–100) = steadier baseline, fewer signals.
Smaller (20–30) = more reactive, more signals.
smoothLen (EMA on z)
2–3 = snappier; 5–7 = smoother/laggier but cleaner.
useSigma, bbLen, bbK (price-stretch filter)
On filters chop. Try bbLen=100, bbK=1.0–1.5.
Off if you want more frequent signals or you already gate with your own σ/Keltner.
useHTF, htfTF, htfZmin (trend/confirmation)
Turn on to require higher-TF imbalance agreement (e.g., trading 1H → confirm with 4H htfTF=240, htfZmin≈0.6–1.0).
hotZ (visual intensity)
Lower (2.0–2.5) heats up faster; higher (4.0) is more subtle.
Ready-made presets
Conservative swing (fewer, higher-conviction):
enterZ=2.0, exitZ=1.0, lenPrem=60–80, smoothLen=5, useSigma=true, bbK=1.5, useHTF=true (240/0.8).
Balanced intraday (default feel):
enterZ=1.6–1.8, exitZ=0.8–1.0, lenPrem=50, smoothLen=3–4, useSigma=true, bbK=1.0–1.25, useHTF=false/true depending on trendiness.
Aggressive scalping (more signals):
enterZ=1.2–1.4, exitZ=0.6–0.8, lenPrem=20–30, smoothLen=2–3, useSigma=false, useHTF=false.
Practical tips
Don’t trade the line in isolation. Use it to time trades into your levels: VWAP bands, Monday high/low, prior POC/VAH/VAL, order blocks, etc.
Perp-led reversals often snap—be ready to scale out quickly back to mid-bands.
Venue matters. Keep spot & perp from the same exchange family to avoid cross-venue quirks.
Alerts: enable after you’ve tuned thresholds for your timeframe so you only get high-quality pings.

Volume Profile AnalysisThe Volume Profile Dashboard is a professional-grade analysis tool built for TradingView. It focuses on displaying a comprehensive volume profile breakdown within a dashboard format directly on the chart. The purpose of this tool is to help traders quickly assess buy versus sell volume dynamics, momentum, and sentiment in order to support informed trading decisions.
Instead of plotting simple bars, this indicator uses a detailed table and visual progress bar to summarize live and historical market activity. By condensing key metrics into a structured format, traders can analyse market behaviour without manually calculating or switching between multiple indicators.
________________________________________
How the Script Works
1. Data Gathering
The script uses lower-timeframe price and volume data to calculate buy volume, sell volume, and total traded volume for the current and previous candles.
2. Volume Allocation
Buy and sell volumes are estimated by looking at the candle’s range (high to low) and how the closing price aligns within that range. The closer the close is to the high, the stronger the buying pressure. The closer the close is to the low, the stronger the selling pressure.
3. Delta and Momentum
o Delta measures the difference between buy and sell volume.
o Volume momentum compares the current candle’s activity to the previous one, showing if interest is rising or fading.
4. Point of Control (POC)
An average of high, low, and close is calculated to give an approximate “point of control” level—an area of balance where buyers and sellers previously agreed on price.
5. Dashboard Visualization
All these calculations are displayed inside a clean dashboard table with separate rows for the current candle, previous candle, and a summary row. Icons, colors, and progress bars make it visually intuitive.
6. On-Chart Progress Indicator
A dynamic horizontal progress bar is plotted on the chart above price, showing the balance between buy and sell volume for the latest activity.
7. Alerts
Built-in alerts trigger when strong buying or selling pressure is detected or when there is a significant spike in total traded volume.
________________________________________
How This Tool Can Be Used
• Intraday Trading: Quickly gauge whether buyers or sellers are in control of the market at any moment.
• Swing Trading: Compare momentum shifts between candles to identify early trend reversals.
• Risk Management: Use delta and sentiment signals to confirm whether to hold or reduce exposure.
• Confirmation: Align the volume profile dashboard with other indicators (such as RSI, MACD, or trendlines) for stronger trading conviction.
________________________________________
Using Mixed Indicators for Decisions
This dashboard alone provides volume insights, but better decisions come when it is combined with other tools:
• Pairing it with an RSI can show whether heavy buying is happening in overbought conditions.
• Combining with a SuperTrend or moving averages can confirm if volume momentum aligns with the price trend.
• Overlaying support/resistance levels can identify whether strong buy/sell signals occur at critical levels.
Mixed indicators prevent relying on one signal alone, reducing false trades.
________________________________________
Importance of This Tool
• Clarity: Condenses complex volume data into a simple, visual format.
• Speed: Traders can react faster with pre-calculated buy/sell percentages.
• Precision: Highlights hidden imbalances that are not obvious from candles alone.
• Professional-grade dashboard: Offers an institutional-style view of market behavior directly within TradingView.
________________________________________
Parameters in the Dashboard Table
• Period: Shows whether the row is for the current or previous candle, along with trend arrows.
• Price Range: The high–low range of the candle.
• Total Volume: The sum of buy and sell activity.
• Buy Volume / Sell Volume: Separated distribution of transactions leaning bullish or bearish.
• Delta: The net difference between buy and sell volumes, highlighting pressure imbalance.
• Buy % / Sell %: The percentage contribution of each side to total volume.
• POC: An average reference level where market consensus was strongest.
• Progress: A graphical bar showing buy vs sell dominance.
• Signal: Simplified output like Strong Buy, Buy, Strong Sell, Sell, Neutral.
• Summary Row: Compares changes between the current and previous candles and gives overall market sentiment.
________________________________________
Stock Market Disclaimer
This tool is for educational and informational purposes only. It does not constitute financial advice, investment advice, or trading recommendations. The stock market and cryptocurrency markets involve high risk. Traders and investors should do their own research and consult licensed financial advisors before making investment decisions. Past performance is not indicative of future results.
________________________________________
Misuse Disclaimer
This script has been developed as per TradingView’s rules and is intended for responsible trading analysis only. Any misuse, redistribution, or modification outside of TradingView’s policies is discouraged. The author and platform are not responsible for financial losses, misinterpretation of signals, or misuse of the code.
________________________________________
Disclaimer
Training & Educational Only — This material and the indicator are provided for educational purposes only. Nothing here is investment advice or a solicitation to buy or sell financial instruments. Past simulated or historical performance does not predict future results. Always perform full back testing and risk management, and consider seeking advice from a qualified financial professional before trading with real capital.
________________________________________

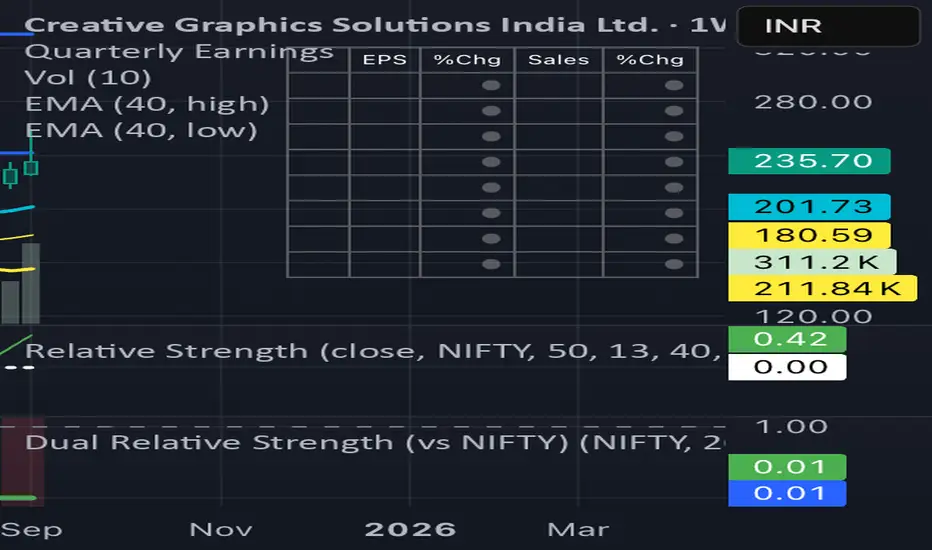
Dual Relative Strength (vs NIFTY) Nikrun1. Fast RS (Early Leadership)
• Indicator: Relative Strength (by modhelius)
• Comparative Symbol: NIFTY
• Period: 26 weeks (~6 months)
• Purpose: Detects early shifts in relative strength before price fully confirms.
⸻
2. Slow RS (Confirmation)
• Add the same indicator again.
• Comparative Symbol: NIFTY
• Period: 52 weeks (1 year)
• Purpose: Confirms sustained leadership. Helps filter noise & false positives.
⸻
3. Visuals
• Style tip:
• Make RS(26) = blue line (fast, responsive).
• Make RS(52) = thicker black/green line (slow, authority).
• Keep zero line visible so you instantly see outperformance/underperformance.
⸻
buy sell ultra systemWhat it is
EMA-POC Momentum System Ultra combines a proven trend stack (EMA 20/50/238), a price-of-control layer (POC via Bar-POC or VWAP alternative), and a momentum trigger (RSI) to surface higher-quality entries only when multiple, independent conditions align. This is not a cosmetic mashup; each component gates the others.
How components work together
Trend (EMA 20/50/238): Defines short/medium/long bias and filters counter-trend signals.
POC (Bar-POC or Alt-POC/VWAP): Locates the most-traded/weighted price area; a neutral band around POC helps avoid chop.
Control background: Above POC → buyers likely in control; below → sellers.
Momentum (RSI): Entry arrows print only when RSI confirms with trend and price location vs POC; optional “cross 50” requirement reduces noise.
Optional HTF trend: Confluence with a higher-timeframe EMA stack for stricter filtering.
Why it’s original/useful
Signals require confluence of (1) EMA trend stack, (2) POC location and neutral-zone filtering, (3) momentum confirmation, (4) optional slope and distance-to-POC checks, and (5) optional HTF trend. This reduces false positives compared with using any layer in isolation.
How to use
Markets/TFs: Built for XAUUSD (Gold) and US30. Works 1m–1h for intraday; 2h–4h for swing.
Entries:
Long: EMA stack bullish, price above POC, not in neutral band, RSI condition true → “Buy” arrow.
Short: Opposite conditions → “Sell” arrow.
Stops/Targets (suggested):
Initial stop beyond POC/neutral band or recent swing.
First target around 1R; trail with EMA20/50 or structure breaks.
Settings to tune:
POC Mode: Bar-POC (highest-volume bar’s close over lookback) or Alt-POC (VWAP).
Neutral Band %: 0.10–0.35 typical intraday.
Min distance from POC: 0.10–0.50% helps avoid low-RR entries right at POC.
RSI: Choose “cross 50” for stricter triggers or simple >/< 50 for more signals.
HTF trend: Turn on for extra confluence.
Alerts:
Buy Signal and Sell Signal (separate), or one Combined Buy/Sell alert.
Set to “Once per bar close” if you want only confirmed arrows.
Repainting / limitations
Shapes can move until bar close (standard Pine behavior) when using intrabar conditions; final confirmation at close. No system guarantees profitability—forward test and adapt to your market/instrument.
Clean chart
The published chart contains only this script so outputs are easy to identify.
Versions / updates
Use Publish → Update for minor changes; do not create new publications for small tweaks. If you fork to preserve older behavior, explain why and how your fork differs.
Changelog
v1.1 – Tuning for Gold/US30, neutral-band & distance filters, optional HTF trend, combined alert.
v1.0 – Initial public release (EMA stack + POC modes + RSI + alerts).
License & credits
Open-source for learning and improvement. Please credit on forks and explain modifications in your description.

Buy vs Sell Volume EMA + Signals (fix: bgcolor scope)How to read it
Green EMA above Red EMA = sustained buying volume dominance.
Red EMA above Green EMA = sustained selling volume dominance.
Arrows mark shifts (crossovers).
Optional faint columns show the raw split of buy/sell volume if you enable “Show Raw Buy/Sell Volume Bars.”

Cardwell RSI by TQ📌 Cardwell RSI – Enhanced Relative Strength Index
This indicator is based on Andrew Cardwell’s RSI methodology , extending the classic RSI with tools to better identify bullish/bearish ranges and trend dynamics.
In uptrends, RSI tends to hold between 40–80 (Cardwell bullish range).
In downtrends, RSI tends to stay between 20–60 (Cardwell bearish range).
Key Features :
Standard RSI with configurable length & source
Fast (9) & Slow (45) RSI Moving Averages (toggleable)
Cardwell Core Levels (80 / 60 / 40 / 20) – enabled by default
Base Bands (70 / 50 / 30) in dotted style
Optional custom levels (up to 3)
Alerts for MA crosses and level crosses
Data Window metrics: RSI vs Fast/Slow MA differences
How to Use :
Monitor RSI behavior inside Cardwell’s bullish (40–80) and bearish (20–60) ranges
Watch RSI crossovers with Fast (9) and Slow (45) MAs to confirm momentum or trend shifts
Use levels and alerts as confluence with your trading strategy
Default Settings :
RSI Length: 14
MA Type: WMA
Fast MA: 9 (hidden by default)
Slow MA: 45 (hidden by default)
Cardwell Levels (80/60/40/20): ON
Base Bands (70/50/30): ON

Deadband Hysteresis Filter [BackQuant]Deadband Hysteresis Filter
What this is
This tool builds a “debounced” price baseline that ignores small fluctuations and only reacts when price meaningfully departs from its recent path. It uses a deadband to define how much deviation matters and a hysteresis scheme to avoid rapid flip-flops around the decision boundary. The baseline’s slope provides a simple trend cue, used to color candles and to trigger up and down alerts.
Why deadband and hysteresis help
They filter micro noise so the baseline does not react to every tiny tick.
They stabilize state changes. Hysteresis means the rule to start moving is stricter than the rule to keep holding, which reduces whipsaw.
They produce a stepped, readable path that advances during sustained moves and stays flat during chop.
How it works (conceptual)
At each bar the script maintains a running baseline dbhf and compares it to the input price p .
Compute a base threshold baseTau using the selected mode (ATR, Percent, Ticks, or Points).
Build an enter band tauEnter = baseTau × Enter Mult and an exit band tauExit = baseTau × Exit Mult where typically Exit Mult < Enter Mult .
Let diff = p − dbhf .
If diff > +tauEnter , raise the baseline by response × (diff − tauEnter) .
If diff < −tauEnter , lower the baseline by response × (diff + tauEnter) .
Otherwise, hold the prior value.
Trend state is derived from slope: dbhf > dbhf → up trend, dbhf < dbhf → down trend.
Inputs and what they control
Threshold mode
ATR — baseTau = ATR(atrLen) × atrMult . Adapts to volatility. Useful when regimes change.
Percent — baseTau = |price| × pctThresh% . Scale-free across symbols of different prices.
Ticks — baseTau = syminfo.mintick × tickThresh . Good for futures where tick size matters.
Points — baseTau = ptsThresh . Fixed distance in price units.
Band multipliers and response
Enter Mult — outer band. Price must travel at least this far from the baseline before an update occurs. Larger values reject more noise but increase lag.
Exit Mult — inner band for hysteresis. Keep this smaller than Enter Mult to create a hold zone that resists small re-entries.
Response — step size when outside the enter band. Higher response tracks faster; lower response is smoother.
UI settings
Show Filtered Price — plots the baseline on price.
Paint candles — colors bars by the filtered slope using your long/short colors.
How it can be used
Trend qualifier — take entries only in the direction of the baseline slope and skip trades against it.
Debounced crossovers — use the baseline as a stabilized surrogate for price in moving-average or channel crossover rules.
Trailing logic — trail stops a small distance beyond the baseline so small pullbacks do not eject the trade.
Session aware filtering — widen Enter Mult or switch to ATR mode for volatile sessions; tighten in quiet sessions.
Parameter interactions and tuning
Enter Mult vs Response — both govern sensitivity. If you see too many flips, increase Enter Mult or reduce Response. If turns feel late, do the opposite.
Exit Mult — widening the gap between Enter and Exit expands the hold zone and reduces oscillation around the threshold.
Mode choice — ATR adapts automatically; Percent keeps behavior consistent across instruments; Ticks or Points are useful when you think in fixed increments.
Timeframe coupling — on higher timeframes you can often lower Enter Mult or raise Response because raw noise is already reduced.
Concrete starter recipes
General purpose — ATR mode, atrLen=14 , atrMult=1.0–1.5 , Enter=1.0 , Exit=0.5 , Response=0.20 . Balanced noise rejection and lag.
Choppy range filter — ATR mode, increase atrMult to 2.0, keep Response≈0.15 . Stronger suppression of micro-moves.
Fast intraday — Percent mode, pctThresh=0.1–0.3 , Enter=1.0 , Exit=0.4–0.6 , Response=0.30–0.40 . Quicker turns for scalping.
Futures ticks — Ticks mode, set tickThresh to a few spreads beyond typical noise; start with Enter=1.0 , Exit=0.5 , Response=0.25 .
Strengths
Clear, explainable logic with an explicit noise budget.
Multiple threshold modes so the same tool fits equities, futures, and crypto.
Built-in hysteresis that reduces flip-flop near the boundary.
Slope-based coloring and alerts that make state changes obvious in real time.
Limitations and notes
All filters add lag. Larger thresholds and smaller response trade faster reaction for fewer false turns.
Fixed Points or Ticks can under- or over-filter when volatility regime shifts. ATR adapts, but will also expand bands during spikes.
On extremely choppy symbols, even a well tuned band will step frequently. Widen Enter Mult or reduce Response if needed.
This is a chart study. It does not include commissions, slippage, funding, or gap risks.
Alerts
DBHF Up Slope — baseline turns from down to up on the latest bar.
DBHF Down Slope — baseline turns from up to down on the latest bar.
Implementation details worth knowing
Initialization sets the baseline to the first observed price to avoid a cold-start jump.
Slope is evaluated bar-to-bar. The up and down alerts check for a change of slope rather than raw price crossings.
Candle colors and the baseline plot share the same long/short palette with transparency applied to the line.
Practical workflow
Pick a mode that matches how you think about distance. ATR for volatility aware, Percent for scale-free, Ticks or Points for fixed increments.
Tune Enter Mult until the number of flips feels appropriate for your timeframe.
Set Exit Mult clearly below Enter Mult to create a real hold zone.
Adjust Response last to control “how fast” the baseline chases price once it decides to move.
Final thoughts
Deadband plus hysteresis gives you a principled way to “only care when it matters.” With a sensible threshold and response, the filter yields a stable, low-chop trend cue you can use directly for bias or plug into your own entries, exits, and risk rules.

Rocket/Bomb PPO + SMI (confirmed, no repaint) — 1-liner labelsName: Rocket/Bomb PPO + SMI (confirmed, non-repaint)
What it does
Combines PPO (Percentage Price Oscillator) momentum with SMI (Stochastic Momentum Index) timing.
Prints a 🚀 “Rocket” buy label when PPO crosses up its signal and SMI crosses up its signal (momentum + timing agree).
Prints a 💣 “Bomb” sell label when PPO crosses down its signal and SMI crosses down its signal.
Labels are offset by ATR so they sit neatly above/below bars.
Why it’s clean (non-repaint)
Signals are gated by bar close confirmation (barstate.isconfirmed), so labels only appear after the bar closes—no flicker or back-filling.
Optional filter
“Strict SMI zone” filter: only allow buys when SMI < –Z and sells when SMI > +Z (default Z=20). This reduces noise in choppy markets.
Customization
PPO/SMI lengths, strict zone level, emoji vs arrows, label colors, icon size, and ATR offset are all configurable.
Alerts
Built-in alert conditions for Rocket (Long) and Bomb (Short) so you can automate notifications.
How to use (at a glance)
Trade in the direction of the Rocket/Bomb labels; the strict zone option helps avoid weak signals.
Best paired with basic trend or S/R context (e.g., higher-time-frame trend filter, recent swing levels) for entries/exits.

Prev Day Volume ProfileWhat the script does
Calculates yesterday’s Volume Profile from the bars on your chart (not tick data) and derives:
POC (Point of Control)
VAL (Value Area Low)
VAH (Value Area High)
Draws three horizontal lines for today:
POC in orange
VAL and VAH in purple
Adds labels on the right edge that show the level name and the exact price (e.g., POC 1.2345).
Why it’s bar-based (not tick-based)
Pine Script can’t fetch external tick/aggTrades data. The script approximates a volume profile by distributing each bar’s volume across the price bins that the bar’s high–low range covers. For “yesterday”, this produces a stable, TV-native approximation that’s usually sufficient for intraday trading.
Key inputs
Value Area %: Defaults to 0.70 (70%)—the typical value area range.
TZ Offset vs Exchange (hours): Shifts the day boundary to match your desired session (e.g., Europe/Berlin: +1 winter / +2 summer). This ensures “yesterday” means 00:00–24:00 in your target timezone.
Row Size: Manual? / Manual Row Size: If enabled, you can set the price bin size yourself. Otherwise, the script chooses a TV-like step from syminfo.mintick.
Colors & Line width: POC orange; VAL/VAH purple; configurable width.

Smart Structure Breaks & Order BlocksOverview (What it does)
The indicator “Smart Structure Breaks & Order Blocks” detects market structure using swing highs and lows, identifies Break of Structure (BOS) events, and automatically draws order blocks (OBs) from the origin candle. These zones extend to the right and change color/outline when mitigated or invalidated. By formalizing and automating part of discretionary analysis, it provides consistent zone recognition.
Main Components
Swing Detection: ta.pivothigh/ta.pivotlow identify confirmed swing points.
BOS Detection: Determines if the recent swing high/low is broken by close (strict mode) or crossover.
OB Creation: After a BOS, the opposite candle (bearish for bullish BOS, bullish for bearish BOS) is used to generate an order block zone.
Zone Management: Limits the number of zones, extends them to the right, and tracks tagged (mitigated) or invalidated states.
Input Parameters
Left/Right Pivot (default 6/6): Number of bars required on each side to confirm a swing. Higher values = smoother swings.
Max Zones (default 4): Maximum zones stored per direction (bull/bear). Oldest zones are overwritten.
Zone Confirmation Lookback (default 3): Ensures OB origin candle validity by checking recent highs/lows.
Show Swing Points (default ON): Displays triangles on swing highs/lows.
Require close for BOS? (default ON): Strict BOS (close required) vs loose BOS (line crossover).
Use candle body for zones (default OFF): Zones drawn from candle body (ON) or wick (OFF).
Signal Definition & Logic
Swing Updates: Latest confirmed pivots update lastHighLevel / lastLowLevel.
BOS (Break of Structure):
Bullish – close breaks last swing high.
Bearish – close breaks last swing low.
Only one valid BOS per swing (avoids duplicates).
OB Detection:
Bullish BOS → previous bearish candle with lowest low forms the OB.
Bearish BOS → previous bullish candle with highest high forms the OB.
Zones: Bull = green, Bear = red, semi-transparent, extended to the right.
Zone States:
Mitigated: Price touches the zone → border highlighted.
Invalidated:
Bull zone → close below → turns red.
Bear zone → close above → turns green.
Chart Appearance
Swing High: red triangle above bar
Swing Low: green triangle below bar
Bull OB: green zone (border highlighted on touch)
Bear OB: red zone (border highlighted on touch)
Invalid Zones: Bull zones turn reddish, Bear zones turn greenish
Practical Use (Trading Assistance)
Trend Following Entries: Buy pullbacks into green OBs in uptrends, sell rallies into red OBs in downtrends.
Focus on First Touch: First mitigation after BOS often has higher reaction probability.
Confluence: Combine with higher timeframe trend, volume, session levels, key price levels (previous highs/lows, VWAP, etc.).
Stops/Targets:
Bull – stop below zone, partial take profit at swing high or resistance.
Bear – stop above zone, partial take profit at swing low or support.
Parameter Tuning (per market/timeframe)
Pivot (6/6 → 4/4/8/8): Lower for scalping (3–5), medium for day trading (5–8), higher for swing trading (8–14). Increase to reduce noise.
Strict Break: ON to reduce false breaks in ranging markets; OFF for earlier signals.
Body Zones: ON for assets with long wicks, OFF for cleaner OBs in liquid instruments.
Zone Confirmation (default 3): Increase for stricter OB origin, fewer zones.
Max Zones (default 4 → 6–10): Increase for higher volatility, decrease to avoid clutter.
Strengths
Standardizes BOS and OB detection that is usually subjective.
Tracks mitigation and invalidation automatically.
Adaptable: allows body/wick zone switching for different instruments.
Limitations
Pivot-based: Signals appear only after pivots confirm (slight lag).
Zones reflect past balance: Can fail after new events (news, earnings, macro data).
Range-heavy markets: More false BOS; consider stricter settings.
Backtesting: This script is for drawing/visual aid; trading rules must be defined separately.
Workflow Example
Identify higher timeframe trend (4H/Daily).
On lower TF (15–60m), wait for BOS and new OB.
Enter on first mitigation with confirmation candle.
Stop beyond zone; targets based on R multiples and swing points.
FAQ
Q: Why are zones invalidated quickly?
A: Flow reversal after BOS. Adjust pivots higher, enable Strict mode, or switch to Body zones to reduce noise.
Q: What does “tagged” mean?
A: Price touched the zone once = mitigated. Implies some orders in that zone may have been filled.
Q: Body or Wick zones?
A: Wick zones are fine in clean markets. For volatile pairs with long wicks, body zones provide more realistic areas.
Customization Tips (Code perspective)
Zone storage: Currently ring buffer ((idx+1) % zoneLimit). Could prioritize keeping unmitigated zones.
Automated testing: Add strategy.entry/exit for rule-based backtests.
Multi-timeframe: Use request.security() for higher timeframe swings/BOS.
Visualization: Add labels for BOS bars, tag zones with IDs, count touches.
Summary
This indicator formalizes the cycle Swing → BOS → OB creation → Mitigation/Invalidation, providing consistent structure analysis and zone tracking. By tuning sensitivity and strictness, and combining with higher timeframe context, it enhances pullback/continuation trading setups. Always combine with proper risk management.

Trend Score with Dynamic Stop Loss HTF
How the Trend Score System Works
This indicator uses a Trend Score (TS) to measure price momentum over time. It tracks whether price is breaking higher or lower, then sums these moves into a cumulative score to define trend direction.
⸻
1. Trend Score (+1 / -1 Mechanism)
On each new bar:
• +1 point: if the current bar breaks the previous bar’s high.
• −1 point: if the current bar breaks the previous bar’s low.
• If both happen in the same bar, they cancel each other out.
• If neither happens, the score does not change.
This creates a simple running measure of bullish vs bearish pressure.
⸻
2. Cumulative Trend Score
The Trend Score is cumulative, meaning each new +1 or -1 is added to the total score, building a continuous count.
• Rising scores = buyers are consistently pushing price to higher highs.
• Falling scores = sellers are consistently pushing price to lower lows.
This smooths out noise and helps identify persistent momentum rather than single-bar spikes.
⸻
3. Trend Flip Trigger (default = 3)
A trend flip occurs when the cumulative Trend Score changes by 3 points (default setting) in the opposite direction of the current trend.
• Bullish Flip:
• Cumulative TS rises 3 points from its most recent low pivot.
• Marks a potential start of a new uptrend.
• A bullish stop-loss (SL) is set at the most recent swing low.
• Bearish Flip:
• Cumulative TS falls 3 points from its most recent high pivot.
• Marks a potential start of a new downtrend.
• A bearish SL is set at the most recent swing high.
Example:
• TS is at -2, then climbs to +1.
• That’s a +3 change, triggering a bullish flip.
⸻
4. Visual Summary
• Green background: Active bullish trend.
• Red background: Active bearish trend.
• ▲ Triangle Up: A bullish flip occurred this bar.
• Stop Loss Line: Shows the structural low used for risk management.
⸻
Why This Matters
The Trend Score measures trend pressure simply and objectively:
• +1 / -1 mechanics track real price behavior (breakouts of highs and lows).
• Cumulative changes of 3 points act like a momentum filter, ignoring small reversals.
• This helps you see true regime shifts on higher timeframes, which is especially useful for swing trades and investing decisions.
⸻
Key Takeaways
• Only flips after meaningful swings: prevents overreacting to single-bar noise.
• SL shows invalidation point: helps you know where a trend thesis fails.
• Works best on Daily or Weekly charts: for smoother, more reliable signals. Using Trend Score for Long-Term Investing
This indicator is designed to support decision-making for higher timeframe investing, such as swing trades, multi-month positions, or even multi-year holds.
It helps you:
• Identify major bullish regimes.
• Decide when to add to winning positions (DCA up).
• Know when to pause buying or consider trimming during weak periods.
• Stay disciplined while holding long-term winners.
Important Note:
These are suggestions for context. Always combine them with your own analysis, portfolio allocation rules, and risk tolerance.
⸻
1. Start With the Higher Timeframe
• Use Weekly charts for a broad investing view.
• Use Daily charts only for fine-tuning entry points or deciding when to add.
• A Bullish Flip on Weekly suggests the market may be entering a major uptrend.
• If Weekly is bullish and Daily also turns bullish, it’s extra confirmation of strength.
⸻
2. Building a Position with DCA
Goal: Grow your position gradually during strong bullish regimes while staying aware of risk.
A. Initial Buy
• Start with a small initial allocation when a Bullish Flip appears on Weekly or Daily.
• This is just a starter position to get exposure while the new trend develops.
B. Adding Through Strength (DCA Up)
• Consider adding during pullbacks, as long as price stays above the active SL line.
• Each add should be smaller or equal to your first buy.
• Spread out adds over time or price levels, instead of going all-in at once.
C. Pause Buying When:
• Price approaches or touches the SL level (trend invalidation).
• A Bearish Flip appears on Weekly or Daily — this signals potential weakness.
• Your total position size reaches your maximum allocation limit for that asset.
⸻
3. Holding Winners
When a position grows in profit:
• Stay in the trend as long as the Weekly regime remains bullish.
• The indicator’s green background acts as a reminder to hold, not panic sell.
• Use the SL bubble to monitor where the trend could potentially break.
• Avoid selling just because of small pullbacks — focus on big-picture trend health.
⸻
4. Taking Partial Profits
While this tool is designed to help hold long-term winners, there may be times to lighten risk:
• After large, rapid moves far above the SL, consider trimming a small portion of your position.
• When MFE (Maximum Favorable Excursion) in the table reaches unusually high levels, it may signal overextension.
• If the Weekly chart turns Neutral or Bearish, you can gradually reduce exposure while waiting for the next Bullish Flip.
⸻
5. Using the Stop Loss Line for Awareness
The Dynamic SL line represents a structural level that, if broken, may suggest the bullish trend is weakening.
How to think about it:
• Above SL: Market remains structurally healthy — continue holding or adding gradually.
• Close to SL: Pause adds. Be cautious and consider tightening your risk.
• Below SL: Treat this as a potential signal to reassess your position, especially if the break is confirmed on Weekly.
The SL is not a hard stop — it’s a visual guide to help you manage expectations.
⸻
6. Example Use Case
Imagine you are investing in a growth stock:
• Weekly Bullish Flip: You open a small starter position.
• Price pulls back slightly but stays above SL: You add a second, smaller tranche.
• Trend continues up for months: You hold and stop adding once your desired allocation is reached.
• Price doubles: You trim 10–20% to lock some profits, but continue holding the majority.
• Price later dips below SL: You slow down, reassess, and decide whether to reduce exposure.
This keeps you:
• Participating in major uptrends.
• Avoiding overcommitment during weak phases.
• Making adjustments gradually, not emotionally.
⸻
7. Suggested Workflow
1. Check Weekly chart → is it Bullish?
2. If yes, review Daily chart to fine-tune entry or adds.
3. Build exposure gradually while Weekly remains bullish.
4. Watch SL bubbles as awareness points for risk management.
5. Use partial trims during big rallies, but avoid exiting entirely too soon.
6. Reassess if Weekly turns Neutral or Bearish.
⸻
Key Takeaways
• Use this as a compass, not a command system.
• Weekly flips = big picture direction.
• Daily flips = timing and precision.
• Add gradually (DCA) while above SL, pause near SL, reassess below SL.
• Hold winners as long as Weekly remains bullish.

Rolling Midpoints of Price vs 50% FibThis script overlays two complementary midpoint lines on your chart to reveal evolving bias, structural imbalances, and zones of mean reversion:
🔸 The Price Midpoint tracks a dynamic center based on the raw price range over a user-defined lookback.
🔸 The Fib Midpoint is calculated from the most recent confirmed swing high and low, forming a live 50% Fibonacci retracement — then smoothed for trend stability.
📘 What Is Mean Reversion, and Why Midpoints Matter?
Markets often oscillate between periods of trend and consolidation. Mean reversion refers to the tendency of price to return to a “fair value” after stretching too far in one direction. The Price Midpoint captures this range-based balance, while the Fib Midpoint anchors to structural swing levels. When price strays far from both, it may be overextended — setting the stage for pullbacks or reversion. When price hovers between or tests both midlines, it reflects balance or indecision. EquiZone helps visualize this dynamic, offering traders real-time insight into whether price is moving with strength, fading, or snapping back to equilibrium.
🔍 Concept Breakdown
➖Price Midpoint – A rolling midpoint between the highest high and lowest low over a user-defined lookback. Think of it as a range-weighted equilibrium.
➖Fib Midpoint – A dynamic 50% Fibonacci retracement between the most recent confirmed swing high and swing low (based on pivot logic), smoothed over time for stability.
➖Color-coded Fills & Bar Colors – Highlight confluence and divergence between the two midpoints, offering intuitive visual cues on trend alignment or structural disagreement.
🎯 Why It’s Useful
➖Spot consolidation zones and structural inflection points
➖Detect hidden divergence between price action and swing structure
➖Use midpoint alignment as a trend confirmation filter
➖Identify mean reversion setups when price strays too far from both midlines
➖Visualize market equilibrium across two complementary perspectives
⚙️ Customizable Features
➖Independent lookbacks for both midpoints
➖Toggle fill shading and adjust color schemes
➖Choose from multiple bar color modes (Close, HL2, OHLC3, OHLC4)
➖Control pivot sensitivity via left/right bar windows
➖Select pivot source: high, low, or close
🧠 How to Use
➖When Price Mid > Fib Mid, momentum may be outrunning structure → bullish extension
➖When Fib Mid > Price Mid, structure leads but price lags → bearish potential or fading momentum
➖When the two lines converge, it signals a zone of balance or potential breakout setup
➖Use bar colors to confirm whether price is leading or following structure
🔧 This isn’t just a visual overlay — it’s a structure-aware bias engine.
Best For:
📈 Trend-followers seeking confirmation between price action and structure
🔄 Reversal traders watching for midpoint divergence
📊 Range traders identifying dynamic fair-value zones
🔍 Price-action analysts who want a clean, non-lagging context layer
➡️ Built for clarity and speed, EquiZone adds zero clutter and works seamlessly across all timeframes and asset types. It pairs especially well with support/resistance zones, trendlines, Fibonacci ladders, and price action patterns.
📌 Final Note:
While Rolling Midpoints provides insight into market balance and directional bias, no single indicator should be traded in isolation. For best results, combine it with contextual tools such as trend structure, volume analysis, higher-timeframe mapping, and clear entry/exit frameworks. Use this as a bias confirmation tool, not a trigger by itself.

Sentinel 5 — OHL daybreak signals [KedArc Quant]Overview
Sentinel 5 plots the first-bar high/low of each trading session and gives clean, rules-based signals in two ways:
1) OHL Setups at the close of the first bar (Open equals/near High for potential short; Open equals/near Low for potential long).
2) Breakout Signals later in the session when price breaks the first-bar High/Low, with optional body/penetration filters.
Basic workflow
1. Wait for the first session bar to finish.
*If O≈H (optionally by proximity) → short setup. •
*If O≈L → long setup. • If neither happens, optionally allow later breakouts.
2. Optional: Act only on breakouts that penetrate a minimum % of that bar’s range/body.
3. Skip the day automatically if the first bar is abnormally large (marubozu-like / extreme ATR / outsized vs yesterday).
Signals & Markers
Markers on the chart:
▲ O=L (exact) / O near L (proximity) – long setup at first-bar close.
▼ O=H (exact) / O near H (proximity) – short setup at first-bar close.
▲ Breakout Long – later bar breaks above first-bar High meeting your penetration rule.
▼ Breakout Short – later bar breaks below first-bar Low meeting your penetration rule.

FibADX MTF Dashboard — DMI/ADX with Fibonacci DominanceFibADX MTF Dashboard — DMI/ADX with Fibonacci Dominance (φ)
This indicator fuses classic DMI/ADX with the Fibonacci Golden Ratio to score directional dominance and trend tradability across multiple timeframes in one clean panel.
What’s unique
• Fibonacci dominance tiers:
• BULL / BEAR → one side slightly stronger
• STRONG when one DI ≥ 1.618× the other (φ)
• EXTREME when one DI ≥ 2.618× (φ²)
• Rounded dominance % in the +DI/−DI columns (e.g., STRONG BULL 72%).
• ADX column modes: show the value (with strength bar ▂▃▅… and slope ↗/↘) or a tier (Weak / Tradable / Strong / Extreme).
• Configurable intraday row (30m/1H/2H/4H) + D/W/M toggles.
• Threshold line: color & width; Extended (infinite both ways) or Not extended (historical plot).
• Theme presets (Dark / Light / High Contrast) or full custom colors.
• Optional panel shading when all selected TFs are strong (and optionally directionally aligned).
How to use
1. Choose an intraday TF (30/60/120/240). Enable D/W/M as needed.
2. Use ADX ≥ threshold (e.g., 21 / 34 / 55) to find tradable trends.
3. Read the +DI/−DI labels to confirm bias (BULL/BEAR) and conviction (STRONG/EXTREME).
4. Prefer multi-TF alignment (e.g., 4H & D & W all strong bull).
5. Treat EXTREME as a momentum regime—trail tighter and scale out into spikes.
Alerts
• All selected TFs: Strong BULL alignment
• All selected TFs: Strong BEAR alignment
Notes
• Smoothing selectable: RMA (Wilder) / EMA / SMA.
• Percentages are whole numbers (72%, not 72.18%).
• Shorttitle is FibADX to comply with TV’s 10-char limit.
Why We Use Fibonacci in FibADX
Traditional DMI/ADX indicators rely on fixed numeric thresholds (e.g., ADX > 20 = “tradable”), but they ignore the relationship between +DI and −DI, which is what really determines trend conviction.
FibADX improves on this by introducing the Fibonacci Golden Ratio (φ ≈ 1.618) to measure directional dominance and classify trend strength more intelligently.
⸻
1. Fibonacci as a Natural Strength Threshold
The golden ratio φ appears everywhere in nature, growth cycles, and fractals.
Since financial markets also behave fractally, Fibonacci levels reflect natural crowd behavior and trend acceleration points.
In FibADX:
• When one DI is slightly larger than the other → BULL or BEAR (mild advantage).
• When one DI is at least 1.618× the other → STRONG BULL or STRONG BEAR (trend conviction).
• When one DI is 2.618× or more → EXTREME BULL or EXTREME BEAR (high momentum regime).
This approach adds structure and consistency to trend classification.
⸻
2. Why 1.618 and 2.618 Instead of Random Numbers
Other traders might pick thresholds like 1.5 or 2.0, but φ has special mathematical properties:
• φ is the most irrational ratio, meaning proportions based on φ retain structure even when scaled.
• Using φ makes FibADX naturally adaptive to all timeframes and asset classes — stocks, crypto, forex, commodities.
⸻
3 . Trading Advantages
Using the Fibonacci Golden Ratio inside DMI/ADX has several benefits:
• Better trend filtering → Avoid false DI crossovers without conviction.
• Catch early momentum shifts → Spot when dominance ratios approach φ before ADX reacts.
• Consistency across markets → Because φ is scalable and fractal, it works everywhere.
⸻
4. How FibADX Uses This
FibADX combines:
• +DI vs −DI ratio → Measures directional dominance.
• φ thresholds (1.618, 2.618) → Classifies strength into BULL, STRONG, EXTREME.
• ADX threshold → Confirms whether the move is tradable or just noise.
• Multi-timeframe dashboard → Aligns bias across 4H, D, W, M.
⸻
Quick Blurb for TradingView
FibADX uses the Fibonacci Golden Ratio (φ ≈ 1.618) to classify trend strength.
Unlike classic DMI/ADX, FibADX measures how much one side dominates:
• φ (1.618) = STRONG trend conviction
• φ² (2.618) = EXTREME momentum regime
This creates an adaptive, fractal-aware framework that works across stocks, crypto, forex, and commodities.
⚠️ Disclaimer : This script is provided for educational purposes only.
It does not constitute financial advice.
Use at your own risk. Always do your own research before making trading decisions.
Created by @nomadhedge

BE-Fib Channel 2 Sided Trading█ Overview:
"BE-Fib Channel 2 Sided Trading" indicator is built with the thought of 2 profound setups named "Cup & Handle (C&H)" and "Fibonacci Channel Trading (FCT)" with the context of "day trading" or with a minimum holding period.
█ Similarities, Day Trading Context & Error Patterns:
While the known fact is that both C&H and FCT provide setups with lesser risk with bigger returns, they both share the similar "Base Pattern".
Note: Inverse of the above Image shall switch the setups between long vs short.
Since the indicator is designed for smaller time-frame candles, there may be instances where the "base pattern" does not visually resemble a Cup & Handle (C&H) pattern. However, patterns are validated using pivot points. The points labeled "A" and "C" can be equal or slightly slanted. Settings of the Indicator allows traders a flexibility to control the angle of these points to spot the strategies according to set conditions. Therefore, understanding the nuances of these patterns is crucial for effective decision-making.
█ 2 Sided Edge: FCT suggests to take trade closer to the yellow line to get better RR ratio. this leaves a small chance of doubt as to; what if price is intended to break the Yellow line thereby activating the C&H.
Wait for the confirmation is a Big FOMO with a compromised RR.
Hence, This indicator is designed to handle both the patterns based on the strength, FIFO and pattern occurring delay.
█ How to Use this Indicator:
Step 1: Enable the Show Sample Sensitivity option to understand the angle of yellow line shown in the sample image. By enabling this option, On the last bar you shall see 4 lines being plotted depicting the max angle which is acceptable for both long and short trades.
Note: Angle can be controlled via setting "Sensitivity".
Higher Sensitivity --> Higher Setup identification --> can lead to failed setups due to 2 sided trading.
Lower Sensitivity --> Lower Setup identification --> can increase the changes of being right.
Step 2: Adjust the look back & look forward periods which shall be used for identifying patterns.
Note: Smaller values can lead to more setups being identified but can hamper the performance of the indicator while increasing the chances of failures. larger values identifies more significant setup but leads to more waiting period thereby compromising on the RR.
Step 3: Adjust the Base Range.
Note: Smaller values can lead to more setups being identified but can hamper the performance of the indicator while increasing the chances of failures. larger values identifies more significant setup but leads to more Risk on play.
Step 4: set the Entry level for FCT & Set the SL for Both FCT & C&H and Target Reward ratio for C&H.
█ Features of Indicator & How it works:
1. Patterns are being identified using Pivot Points method.
2. Tracks & validates both the setups simultaneously on every candle and traded one at a time based on FIFO, New setups found in-between, Defined Entry Levels while on wait for the other pattern to get activated.
3. Alerts added for trade events.
4. FCT setups are generally traded with trailed SL level and increasing Target level on every completed bar. while C&H has the standard SL & TP level with no Trail SL option.
DISCLAIMER: No sharing, copying, reselling, modifying, or any other forms of use are authorized for our documents, script / strategy, and the information published with them. This informational planning script / strategy is strictly for individual use and educational purposes only. This is not financial or investment advice. Investments are always made at your own risk and are based on your personal judgement. I am not responsible for any losses you may incur. Please invest wisely.
Happy to receive suggestions and feedback in order to improve the performance of the indicator better.

BTC/USD 3-Min Binary Prediction [v7.2 EN]BTC/USD 3-Minute Binary Prediction Indicator v7.2 - Complete Guide
Overview
This is an advanced technical analysis indicator designed for Bitcoin/USD binary options trading with 3-minute expiration times. The system aims for an 83% win rate by combining multiple analysis layers and pattern recognition.
How It Works
Core Prediction Logic
- Timeframe: Predicts whether BTC price will be ±$25 higher (HIGH) or lower (LOW) after 3 minutes
- Entry Signals: Generates HIGH/LOW signals when confidence exceeds threshold (default 75%)
- Verification: Automatically tracks and displays win/loss statistics in real-time
5-Layer Filter System
The indicator uses a sophisticated scoring system (0-100 points):
1. Trend Filter (25 points) - Analyzes EMA alignments and price momentum
2. Leading Indicators (25 points) - RSI and MACD divergence analysis
3. Volume Confirmation (20 points) - Detects unusual volume patterns
4. Support/Resistance (15 points) - Identifies key price levels
5. Momentum Alignment (15 points) - Measures acceleration and deceleration
Pattern Recognition
Automatically detects and visualizes:
- Double Tops/Bottoms - Reversal patterns
- Triangles - Ascending, descending, symmetrical
- Channels - Trending price channels
- Candlestick Patterns - Engulfing, hammer, hanging man
Multi-Timeframe Analysis
- Uses 1-minute and 5-minute data for confirmation
- Aligns multiple timeframes for higher probability trades
- Monitors trend consistency across timeframes
Key Features
Display Panels
1. Statistics Panel (Top Right)
- Overall win rate percentage
- Hourly performance (wins/losses)
- Daily performance
- Current system status
2. Analysis Panel (Left Side)
- Market trend analysis
- RSI status (overbought/oversold)
- Volume conditions
- Filter scores for each component
- Final HIGH/LOW/WAIT decision
Visual Signals
- Green Triangle (↑) = HIGH prediction
- Red Triangle (↓) = LOW prediction
- Yellow Background = Entry opportunity
- Blue Background = Waiting for result
Configuration Options
Basic Settings
- Range Width: Target price movement (default $50 = ±$25)
- Min Confidence: Minimum confidence to enter (default 75%)
- Max Daily Trades: Risk management limit (default 5)
Filters (Can be toggled on/off)
- Trend Filter
- Volume Confirmation
- Support/Resistance Filter
- Momentum Alignment
Display Options
- Show/hide signals, statistics, analysis
- Minimal Mode for cleaner charts
- EMA line visibility
Important Risk Warnings
Binary Options Trading Risks:
1. High Risk Product - Binary options are extremely risky and banned in many countries
2. Not Investment Advice - This tool is for educational/analytical purposes only
3. No Guaranteed Returns - Past performance doesn't predict future results
4. Capital at Risk - You can lose your entire investment in seconds
Technical Limitations:
- Requires stable internet connection
- Performance varies with market conditions
- High volatility can reduce accuracy
- Not suitable for news events or low liquidity periods
Best Practices
1. Paper Trade First - Test thoroughly on demo accounts
2. Risk Management - Never risk more than 1-2% per trade
3. Market Conditions - Works best in normal volatility conditions
4. Avoid Major Events - Don't trade during major news releases
5. Monitor Performance - Track your actual results vs displayed statistics
Setup Instructions
1. Add to TradingView chart (BTC/USD preferred)
2. Use 30-second or 1-minute chart timeframe
3. Adjust settings based on your risk tolerance
4. Monitor F-Score (should be >65 for entries)
5. Wait for clear HIGH/LOW signals with high confidence
Alert Configuration
The indicator provides three alert types:
- HIGH Signal alerts
- LOW Signal alerts
- General entry opportunity alerts
Legal Disclaimer
Binary options trading may not be legal in your jurisdiction. Many countries including the USA, Canada, and EU nations have restrictions or outright bans on binary options. Always check local regulations and consult with financial advisors before trading.
Remember: This is a technical analysis tool, not a money-printing machine. Successful trading requires discipline, risk management, and continuous learning. The displayed statistics are historical and don't guarantee future performance.

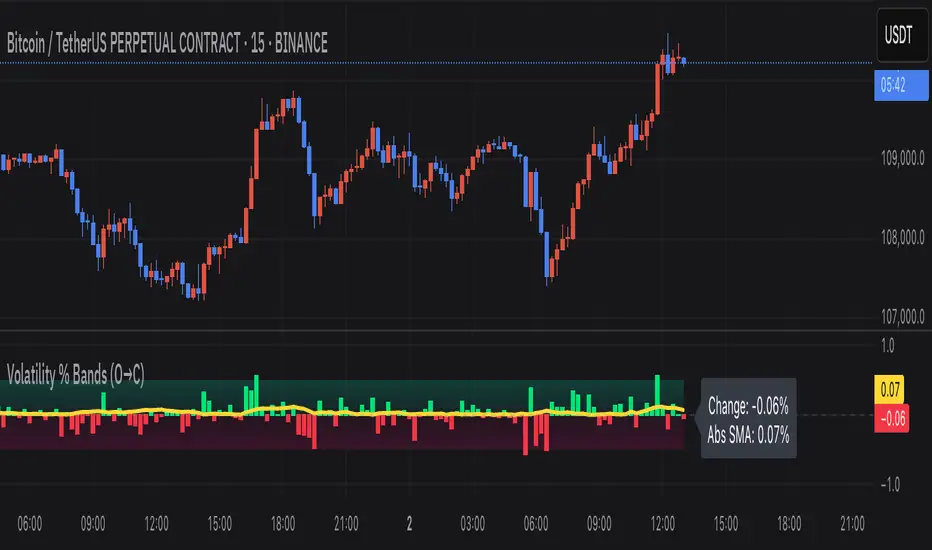
Volatility % Bands (O→C)Volatility % Bands (O→C) is an indicator designed to visualize the percentage change from Open to Close of each candle, providing a clear view of short-term momentum and volatility.
**Histogram**: Displays bar-by-bar % change (Close vs Open). Green bars indicate positive changes, while red bars indicate negative ones, making momentum shifts easy to identify.
**Moving Average Line**: Plots the Simple Moving Average (SMA) of the absolute % change, helping traders track the average volatility over a chosen period.
**Background Bands**: Based on the user-defined Level Step, ±1 to ±5 zones are highlighted as shaded bands, allowing quick recognition of whether volatility is low, moderate, or extreme.
**Label**: Shows the latest candle’s % change and the current SMA value as a floating label on the right, making it convenient for real-time monitoring.
This tool can be useful for volatility breakout strategies, day trading, and short-term momentum analysis.
Benchmark Relative Performance BRPBenchmark Relative Performance (BRP) is a comprehensive technical analysis tool that compares any stock's performance against a chosen benchmark (QQQ, SPY, IWM, etc.) to identify outperformance and underperformance patterns.
Key Features:
Dual-line visualization: Shows both ticker and relative strength performance
Dynamic color coding: 5-level color system indicating performance strength
Customizable benchmark: Choose from any ticker via TradingView's symbol picker
Volume weighting: Optional volume analysis for stronger signal confirmation
Performance zones: Visual thresholds for strong/moderate performance levels
Compact info table: Real-time performance status and values
What It Shows:
Benchmark Performance Line (Blue): Shows your chosen benchmark's percentage performance
Relative Strength Line (Color-coded): Shows how much the ticker outperforms/underperforms
Fill Area: Visual gap between ticker and benchmark performance
Performance Zones: Dotted lines marking significant performance thresholds
Color System:
Green: Strong outperformance (above custom threshold)
Lime: Standard outperformance
Yellow: Neutral/Equal performance
Orange: Standard underperformance
Red: Strong underperformance (below custom threshold)
Best Used For:
Stock selection and rotation strategies
Sector/ETF relative strength analysis
Identifying momentum shifts vs benchmarks
Portfolio performance evaluation
Market timing based on relative performance
Settings:
Customizable lookback period (default: 20)
Adjustable strong performance threshold (default: 5%)
Optional volume weighting factor
Full table customization (position, colors, fonts)
Performance display (percentage or decimal)
Perfect for traders and investors who want to identify stocks showing relative strength or weakness compared to major market benchmarks.
