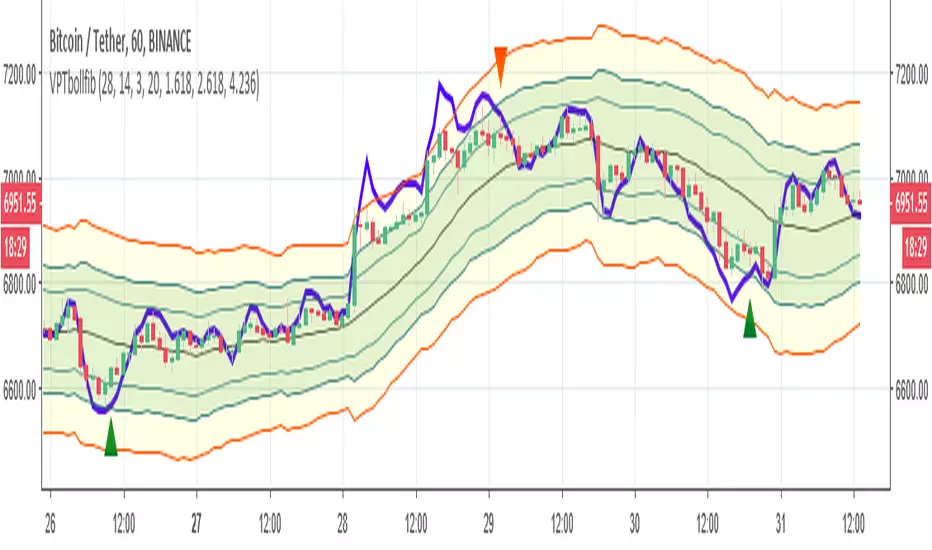
VPTbollfibThis indicator based on VPT (volume indicator that show buy and sell power) and Bollinger fibo lines..
So entry is when VPT crossing up the lower fib.. sell is opposite..
I make it open code so have fun and try to make it better:)
alerts inside
Recherche dans les scripts pour "布林线boll指标使用详细讲解"

Fixed TF BBandsCombined daily and 3D Bollinger Bands into one indicator. It will show the BBands uncoupled from the current candle TF's
MA Study: Different Types and More [NeoButane]A study of moving averages that utilizes different tricks I've learned to optimize them. Included is Bollinger Bands, Guppy (GMMA) and Super Guppy.
The method used to make it MtF should be more precise and smoother than regular MtF methods that use the security function. For intraday timeframes, each number represents each hour, with 24 equal to 1 day. For daily, 3 is 3 day, for weekly, 4 is the 4 weekly, etc. If you're on a higher timeframe than the one selected, the length will not change.
Log-space is used to make calculations work on many cryptos. The rules for color changing Guppy is changed to make it not as choppy on MAs other than EMA. Note that length does not affect SWMA and VWAP and source does not affect VWAP.
A short summary of each moving average can be found here: medium.com
List of included MAs:
ALMA: Arnaud Legoux
Double EMA
EMA: Exponential
Hull MA
KAMA: Kaufman Adaptive
Linear Regression Curve
LSMA: Least Squares
SMA: Simple
SMMA/RMA: Smoothed/Running
SWMA: Symm. Weighted
TMA: Triangular
Triple EMA
VWMA: Volume Weighted
WMA: Weighted
ZLEMA: Zero Lag
VWAP: Vol Weighted Average
Welles Wilder MA

Projecting From Stability & Low RSIStable periods that are projected can be found using Bollinger Band Percent Width Crossing historically low RSI.

Gunbot - Bbands - UnlockedThis is a repost, the first version was locked and I am unable to unlock it. So I'm simply publishing it anew.
Original Post
Original Description
This is more of a test run than anything. Gunbot approximation courtesy of Vosechu and the original can be found here.

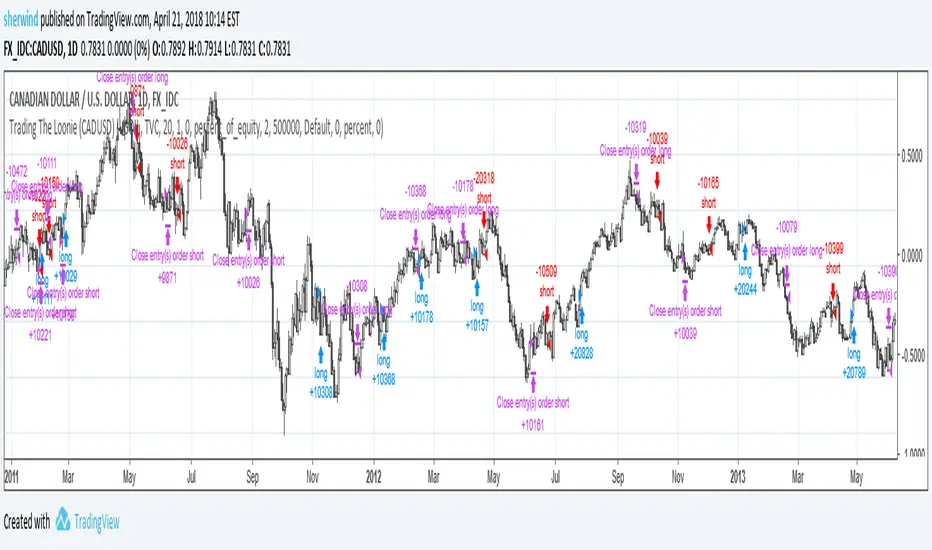
Trading The Loonie (CADUSD)A port of the trading strategy described at technical.traders.com
"In “Trading The Loonie,” which appeared in the December 2015 issue of STOCKS & COMMODITIES, author Markos Katsanos
explains the heavy correlation between the Canadian dollar and crude oil. He then goes on to describe how one could
trade this correlation. Using similar logic as that employed in Bollinger Bands, Katsanos has built a study to
provide buy and sell signals for trading the Canadian dollar future."
See Also:
- Backtesting and forwardtesting (of TradingView Strategies)
- 9 Mistakes Quants Make that Cause Backtests to Lie (blog.quantopian.com)
- When Backtests Meet Reality (financial-hacker.com)
- Why MT4 backtesting does not work (www.stevehopwoodforex.com)
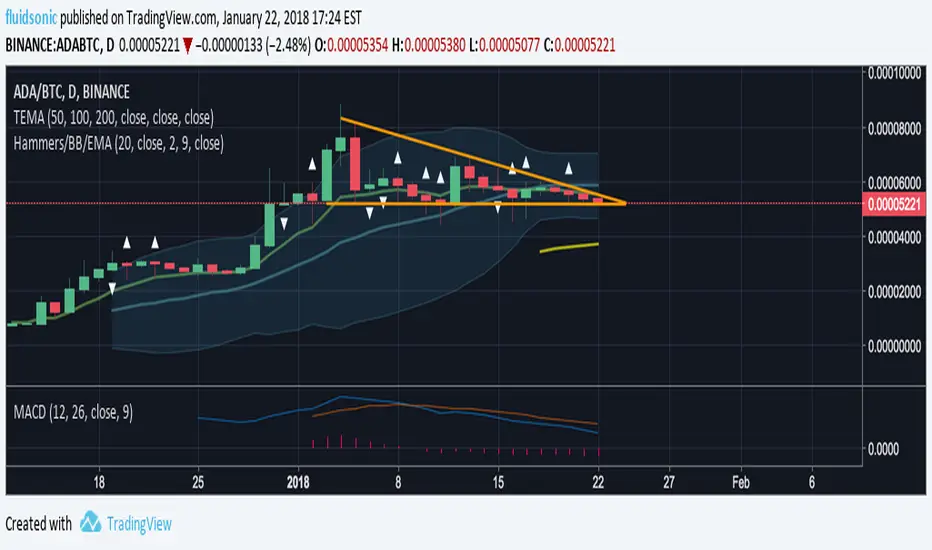
Hammers, Bollinger Bands & Moving Average ExponentialShows indicators above/below hammer-like candles.
Also adds BB & EMA in order to reduce active indicator count.

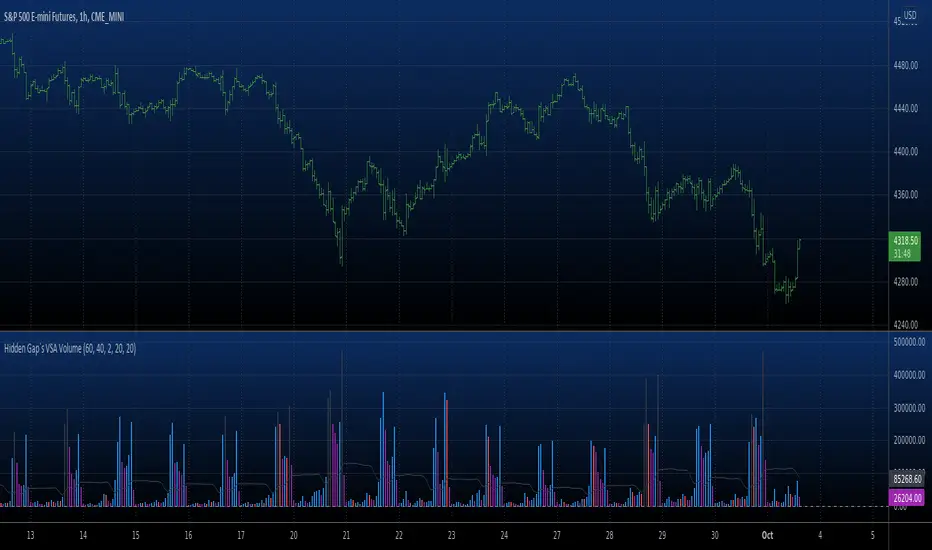
Hidden Gap`s VSA Volume If Volume is less then the previous 20 intervals, Volume is gray.
If Volume is greater then the previous 40 intervals, Volume is black.
If Volume is less then the previous 2 intervals, Volume is purple.
If Volume is less then the previous, Volume is red.
If Volume is greater then the previous, Volume is blue.
Other - white.
You can add on the indicator a 2.5 Standart Deviation of a 20 period
Bollinger Band Shifted 3 periods forward.
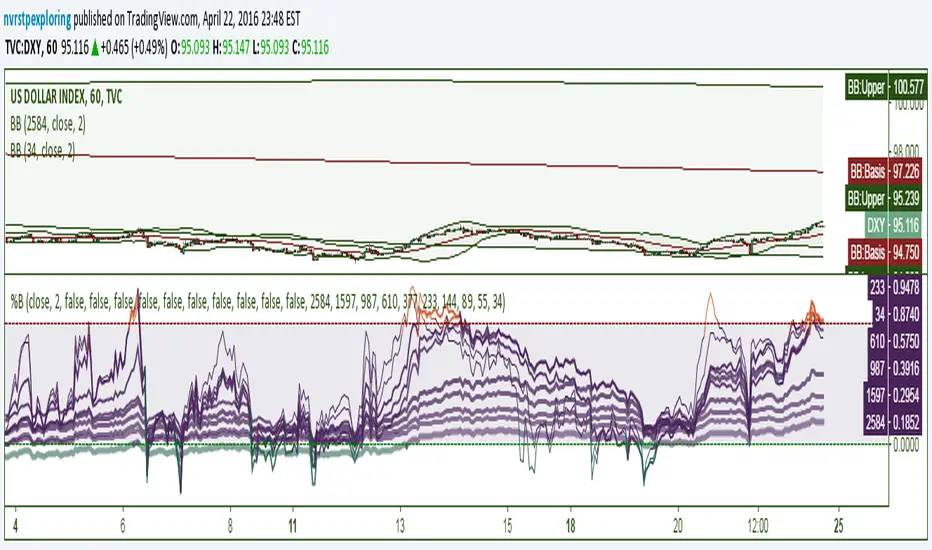
%BsAn indicator with 10 configurable %B lines for identifying trends, overbought and oversold conditions, and reversal points. %B is a linear representation of a securities relationship to the Upper and Lower Bollinger Bands. The best opportunities arise when a security is oversold in a bullish trend and overbought in a bearish trend. The longer %B trend-lines in this indicator are very useful for major reversals. They can be used to indicate the high or low of the day on a 1-minute chart or show a multi-year reversal point.
%B = (Current Price - Lower Band) / (Upper Band - Lower Band)
Indicator: MFI or RSI enclosed by Bollinger BandsIndicator allows choosing either MFI or RSI and draws a BB over it to identify oversold / overbought conditions.
Oversold/Overbought breaches are highlighted using different colors for easy identification. Has helped me a lot during sudden pumps to identify the tops, hope you find a use for this.
Bollinger Bands + RSI [Uncle Sam Trading]The Bollinger Bands + RSI indicator combines two popular technical analysis tools, Bollinger Bands (BB) and the Relative Strength Index (RSI), into a unified framework designed to assess both market volatility and momentum. This indicator provides both visual signals on the chart, and allows you to set alerts. It is intended to help traders identify potential overbought/oversold conditions, trend reversals, and to refine trade entry and exit points.
Key Features:
Bollinger Bands: The indicator plots Bollinger Bands, which consist of a basis line (typically a 20-period Simple Moving Average), an upper band (basis + 2 standard deviations), and a lower band (basis - 2 standard deviations). The bands dynamically adjust to market volatility, widening during periods of increased volatility and contracting during periods of decreased volatility.
Relative Strength Index (RSI): The RSI, a momentum oscillator, is plotted in a separate pane below the price chart. It measures the magnitude of recent price changes to evaluate overbought or oversold conditions in the price of a stock or other asset. Traditional interpretation uses 70 and 30 as overbought and oversold levels, respectively.
Overbought/Oversold Zones Highlighting: This indicator uniquely highlights overbought and oversold zones directly on the price chart based on the RSI values. When the RSI is above the overbought level (default 70), a red-shaded area is displayed. When the RSI is below the oversold level (default 30), a green-shaded area is displayed. These visual cues enhance the identification of potential trend reversals.
Buy and Sell Signals: The indicator generates buy signals when the price crosses above the lower Bollinger Band and the RSI is below the oversold level (if the RSI filter is enabled). Sell signals are generated when the price crosses below the upper Bollinger Band and the RSI is above the overbought level (if the RSI filter is enabled). These signals are plotted as green upward-pointing triangles (buy) and red downward-pointing triangles (sell) on the chart.
Customizable Parameters: Users can adjust various settings, including:
Bollinger Bands Length: The number of periods used to calculate the moving average and standard deviation.
Bollinger Bands Standard Deviation: The multiplier used to determine the distance of the upper and lower bands from the basis.
RSI Length: The number of periods used to calculate the RSI.
RSI Overbought/Oversold Levels: The threshold values that define overbought and oversold conditions for the RSI.
Use RSI Filter for Signals: Enable/disable the RSI filter for buy and sell signals.
Colors: The colors of the Bollinger Bands, RSI, overbought/oversold levels, and zone highlights can be customized to suit user preferences.
Alerts: The indicator supports customizable alerts for various conditions, including:
Buy Signal: Triggered when a buy signal is generated.
Sell Signal: Triggered when a sell signal is generated.
Price Crossed Upper BB: Triggered when the price crosses above the upper Bollinger Band.
Price Crossed Lower BB: Triggered when the price crosses below the lower Bollinger Band.
RSI Overbought: Triggered when the RSI crosses above the overbought level.
RSI Oversold: Triggered when the RSI crosses below the oversold level.
How to Use:
The Bollinger Bands + RSI indicator can be used in various ways, including:
Identifying Potential Trend Reversals: Price crosses above the lower band coupled with an oversold RSI (and highlighted zone) may signal a bullish reversal. Conversely, a price cross below the upper band with an overbought RSI (and highlighted zone) may indicate a bearish reversal.
Confirming Trend Strength: In an uptrend, the price may "ride" the upper band, while in a downtrend, it may "ride" the lower band.
Exit Signals: Crossing the opposite band while in a trade, particularly with confirming RSI signals, is often used to identify potential exit points.
Combined with Other Analysis: This indicator works well in conjunction with other technical analysis tools, such as trend lines, support/resistance levels, chart patterns, and moving average-based strategies.
Disclaimer:
This indicator is for educational and informational purposes only and should not be considered as financial advice. Trading involves risk, and past performance is not indicative of future results. Always conduct thorough research and consider your risk tolerance before making any trading decisions.

Bollinger Bands & SuperTrend Strategy by Tradinggg HubThis TradingView Pinescript combines Bollinger Bands and a custom SuperTrend indicator to generate trading signals.
Bollinger Bands:
Bollinger Bands are a popular volatility indicator that consists of three lines:
* Basis: A simple moving average (SMA) of the price (default length is 20 periods).
* Upper Band: The basis plus a standard deviation multiplier (default is 2).
* Lower Band: The basis minus a standard deviation multiplier (default is 2).
These bands expand and contract as volatility increases or decreases, helping traders identify potential overbought and oversold conditions.
SuperTrend:
The SuperTrend indicator is a trend-following tool that aims to identify the direction of the price trend. It uses the Average True Range (ATR) to determine the volatility of the market and sets levels above and below the price to indicate potential trend reversals.
How the Strategy Works:
1. Bollinger Bands: The script plots Bollinger Bands around the price, providing insight into the current volatility and potential overbought or oversold conditions.
2. SuperTrend: The script calculates and plots a custom SuperTrend indicator based on user-defined ATR period and factor. It helps visualize the current trend direction and potential trend reversals.
3. Buy Signals: A buy signal is generated when the following conditions are met:
- The price crosses above the SuperTrend line.
- The price is above the Bollinger Bands basis line.
4. Sell Signals: A sell signal is generated when one of the following conditions is met:
- The price crosses below the SuperTrend line.
- The price is below the Bollinger Bands basis line.
Key Parameters:
* Bollinger Bands Length: The number of periods used to calculate the basis (SMA) of the Bollinger Bands.
* Bollinger Bands Multiplier: The factor used to calculate the standard deviation for the upper and lower bands.
* SuperTrend ATR Period: The number of periods used to calculate the Average True Range (ATR) for the SuperTrend.
* SuperTrend Factor: The factor used to determine the distance of the SuperTrend levels from the price.
Customization:
Feel free to experiment with different parameter values to optimize the strategy for your preferred asset and time frame.
Disclaimer:
This script is intended for educational and informational purposes only. It should not be considered as financial advice. Always conduct thorough research and consider your own risk tolerance before making any trading decisions.
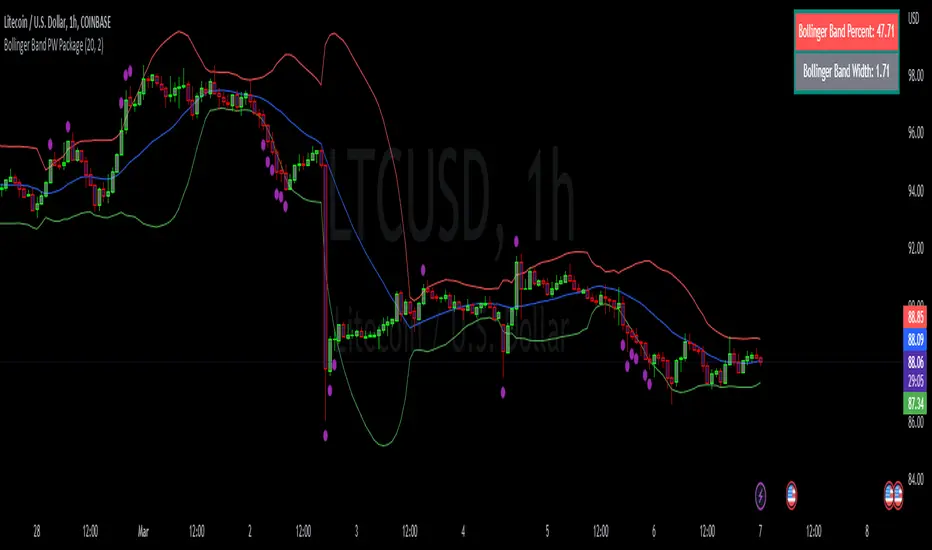
Bollinger Band PW PackageThis script creates a Bollinger Band Package with Bollinger Band Percent and Width displayed on chart. The indicator also prints signals when price closes above or below the Bollinger Bands using shapes (circles by default). Bollinger Bands were created by John Bollinger, and consist of three lines plotted on a chart: the basis line (typically a moving average, 20 sma by default), an upper line (equal to the basis plus a certain number of standard deviations of the price, 2), and a lower line (equal to the basis minus the same number of standard deviations, 2 by default).
The script calculates the Bollinger Bands for a given input parameters by taking the length of the moving average and the number of standard deviations to use for the upper and lower bands. It then calculates the Bollinger Bands using these input parameters.
The script defines two functions: get_bb_percent() and get_bb_width(). The get_bb_percent() function calculates the percentage distance between the closing price and the lower band, as a percentage of the total distance between the upper and lower bands. This value is commonly referred to as the "Bollinger Band Percent". The get_bb_width() function calculates the percentage distance between the upper and lower bands, as a percentage of the basis line. This value is commonly referred to as the "Bollinger Band Width".
The script creates a table at the middle right of the chart, where the Bollinger Band Percent and Width values are displayed. The table is designed with two rows, one for the Bollinger Band Percent value and the other for the Bollinger Band Width value.
The script plots the three Bollinger Bands lines on the chart. The basis line is plotted in blue, the upper band line in red, and the lower band line in green.
The script then plots the shapes that signify closures above and below the bands using plotshape. The shapes and colors are customizable in the settings menu.
This indicator is designed to have all three components and a visual aid to assist Bollinger Band technical analysis in one script which can be helpful in determining potential trading opportunities. We thank John Bollinger for his contribution to technical analysis and trading.
Please give feedback and modify to your liking.
Bollinger ALTswap Alert v1.0 (MA28 Rotation ALT↔BTC)Inspired by: Bollinger Awesome Alert R1 by JustUncleL
What is it?
BBALTSWAP overlays Bollinger Bands (20, 2), a 3-EMA, and a Rotation MA (default 28), then gives state-change alerts to rotate between ALT ↔ BTC on any ALT/BTC chart.
Core rotation rule
• Rotate → ALT when close > Bollinger middle and close > MA28.
• Rotate → BTC when close < Bollinger middle and close < MA28.
• Otherwise: Wait (no rotation).
Labels only print when the state changes (to avoid spam). You can also compute the rotation on a higher timeframe (default 4h) while viewing a lower one (e.g., 1h).
Optional extras
• Breakout arrows (scalping-style) when 3-EMA crosses the Bollinger middle with an Awesome Oscillator direction filter.
• Bollinger Squeeze coloring (relative width) to highlight expansion/contraction.
• Min bars between labels to throttle how often rotation labels appear.
Inputs (highlights)
• Use EMA for Bollinger / Rotation MA
• Bollinger length & multiplier
• AO fast/slow lengths
• Higher-timeframe selector for rotation (default 240 = 4h)
• Show breakout arrows / show “Wait” / min bars between labels
How to use (simple playbook)
1. Chart: open your ALT/BTC pair (e.g., ETHBTC).
2. Direction: leave rotation HTF at 4h for steadier signals.
3. Execution: take rotations on bar close; manage entries on your lower TF (1h/15m) if desired.
4. Override check (optional): when BTCUSDT is in a fresh breakout, prefer BTC even if ALT flashes briefly.
Alerts
Add two alerts, Once per bar close:
• “Rotate to ALT (state change)”
• “Rotate to BTC (state change)”
Notes
• Works on any ALT/BTC pair.
• The breakout arrows are optional and independent from the rotation signals.
• This tool is educational; not financial advice.

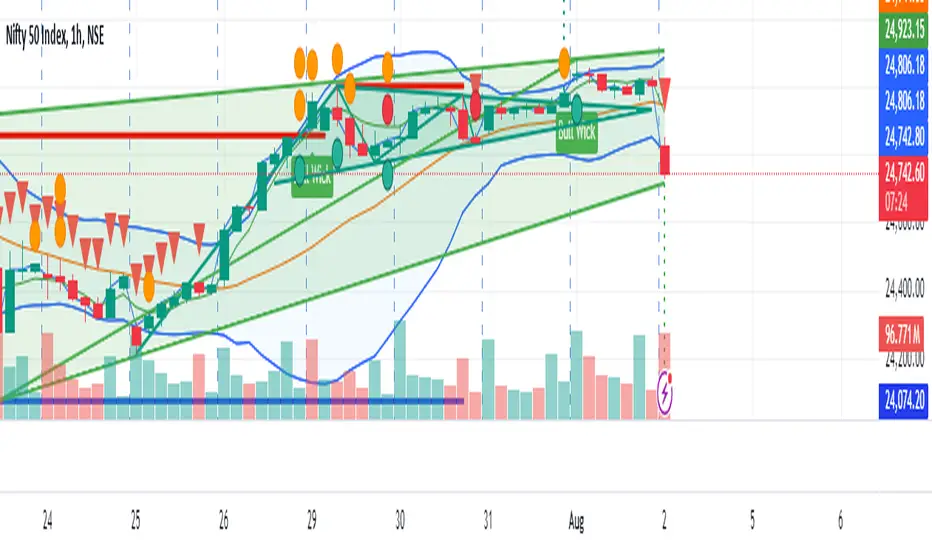
Bollinger Bands (SMA 21, 2.618σ)Indicator Description: Bollinger Bands (2.618σ, 21 SMA) + RSI with Fibonacci
This custom indicator combines Bollinger Bands and Relative Strength Index (RSI), enhanced with Fibonacci-based configurations, to provide confluence signals for rejection candles, reversal setups, and continuation patterns.
Bollinger Bands Settings (Customized)
Middle Band → 21-period Simple Moving Average (SMA)
Upper Band → SMA + 2.618 standard deviations
Lower Band → SMA − 2.618 standard deviations
These parameters expand the bands compared to the traditional (20, 2.0) settings, making them better suited for volatility extremes and higher timeframe swing analysis.
Color Scheme
Middle Band = Orange
Upper Band = Red
Lower Band = Green
This color-coding emphasizes key rejection levels visually.
Candle Rejection Logic
The indicator is designed to highlight potential rejection candles when price interacts with the outer Bollinger Bands:
At the Upper Band, rejection signals suggest overextension and potential downside reaction.
At the Lower Band, rejection signals suggest oversold conditions and potential upside reaction.
Rejection Candle Types Tracked
Hammer (bullish reversal, lower rejection wick at bottom band)
Inverted Hammer (bearish reversal, upper rejection wick at top band)
Doji candles (indecision at band extremes)
Double Top formations near the upper band
Double Bottom formations near the lower band
Relative Strength Index (RSI) Settings
RSI is configured with Fibonacci retracement levels instead of traditional 30/70 thresholds.
Fibonacci sequence levels used include:
23.6% (0.236)
38.2% (0.382)
50% (0.5)
61.8% (0.618)
78.6% (0.786)
This alignment with Fibonacci ratios provides deeper market structure insights into momentum strength and exhaustion points.
Trading Confluence Zones
Upper Band + RSI at 0.618–0.786 zone → High probability bearish rejection.
Lower Band + RSI at 0.236–0.382 zone → High probability bullish reversal.
Band interaction + Doji or Hammer candles → Stronger signal confirmation.
Use Cases
Identifying trend exhaustion when price repeatedly fails to break above the upper band.
Spotting accumulation or distribution phases when price consolidates around Fibonacci-based RSI zones.
Detecting false breakouts when candle patterns (like Doji or Inverted Hammer) occur beyond the bands.
Why 2.618 Deviation & 21 SMA?
Standard Bollinger Bands (20, 2.0) capture ~95% of price action.
By widening to 2.618σ, we target extreme volatility outliers — areas where reversals are statistically more likely.
A 21-period SMA aligns better with common cycle lengths (3 trading weeks on daily charts) and Fibonacci-related time cycles.
Practical Strategy
Step 1: Watch when price touches or pierces the upper/lower band.
Step 2: Check for candle rejection patterns (Hammer, Inverted Hammer, Doji, Double Top/Bottom).
Step 3: Confirm with RSI Fibonacci levels for confluence.
Step 4: Trade with the prevailing trend or look for reversal setups if multiple confluence factors align.
Cautions
Not all touches of the bands signal reversals — strong trends can ride along the bands for extended periods.
Always combine with price action structure, volume, and higher timeframe trend bias.
📌 Summary
This indicator blends volatility-based bands with Fibonacci momentum analysis and classical candle rejection patterns. The combination of Bollinger Bands (21, 2.618σ) and RSI Fibonacci levels helps traders detect high-probability rejection zones, reversal opportunities, and overextended conditions with improved accuracy over traditional default settings.

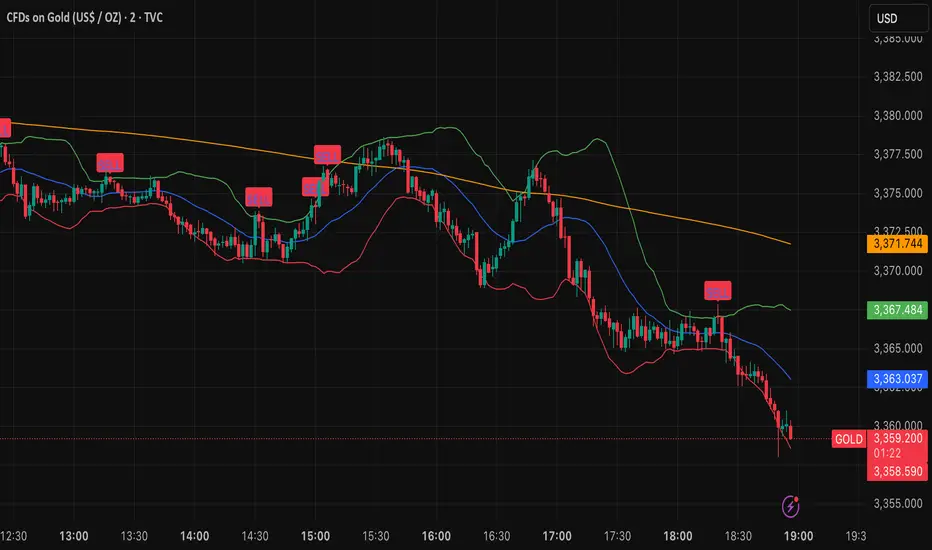
Bollinger Bands (SMA) with Trend Filtered Buy/SellOverview
This indicator is a trend-following Bollinger Bands tool based on SMA, enhanced with a 200 SMA filter to display BUY/SELL signals only in the direction of the prevailing trend.
Instead of showing every possible reversal, it focuses on high-probability entries aligned with the trend.
Key Features
Feature Description
Bollinger Bands (SMA) Plots upper, lower, and middle bands using Simple Moving Average (SMA) and standard deviation.
200 SMA Trend Filter Determines the overall market trend (bullish or bearish).
BUY/SELL Signals Generates signals when price reacts from Bollinger Bands.
Trend Filtering Only BUY signals above the 200 SMA, only SELL signals below the 200 SMA.
Alert Function TradingView alerts can be triggered when a signal occurs.
Toggle ON/OFF Option to enable or disable signal display.
Signal Logic
BUY Signal
Price is above the 200 SMA (uptrend)
Previous candle closed below the lower Bollinger Band
Current candle closes back inside the band → Confirmed rebound → BUY signal
SELL Signal
Price is below the 200 SMA (downtrend)
Previous candle closed above the upper Bollinger Band
Current candle closes back inside the band → Confirmed pullback → SELL signal
How to Use
Trend-Following Entries:
Enter trades only in the trend direction, improving accuracy and reducing countertrend trades.
Filter Out False Signals:
The 200 SMA filter removes noise from opposite-trend signals.
Alerts:
Receive notifications when a valid BUY/SELL setup appears without watching the chart constantly.
This indicator is ideal for traders who want to focus on high-probability trend-following setups, especially in markets like Forex or Gold, where strong one-way moves often occur.
このインジケーターは、SMAベースのボリンジャーバンドにトレンドフィルター(200SMA)を追加し、トレンドフォロー型のBUY/SELLシグナルを表示するツールです。
短期の逆張りではなく、大きなトレンド方向に沿ったシグナルだけを出すように設計されています。
主な機能
機能 説明
ボリンジャーバンド (SMA) 期間を指定した単純移動平均(SMA)を基準に、標準偏差で上下のバンドを表示
200SMA(トレンド判定) 現在の相場が上昇トレンドか下降トレンドかを判断
BUY/SELLシグナル ボリンジャーバンドの反発を検出してシグナル表示
トレンドフィルター 200SMAより上ならBUYのみ、200SMAより下ならSELLのみ表示
アラート機能 BUY/SELLシグナル発生時にTradingViewのアラートで通知可能
ON/OFF切替 BUY/SELLシグナルの表示はスイッチでON/OFF可能
シグナルロジック
BUYシグナル
200SMAより上にいる
前の足で価格がボリンジャーバンド下限を下抜け
現在の足でバンド内に戻る → 反発確認 → BUYシグナル表示
SELLシグナル
200SMAより下にいる
前の足で価格がボリンジャーバンド上限を上抜け
現在の足でバンド内に戻る → 反落確認 → SELLシグナル表示
トレードでの使い方
トレンドフォロー型エントリー
→ 200SMAを基準に、相場の方向に沿ったエントリーだけを狙う
逆張りのフィルタリング
→ トレンドに逆らう無駄なシグナルを表示しない
アラート通知
→ チャートを見ていなくても、シグナル発生時に通知可能
このインジケーターは「トレンドフォローの精度を高めたいトレーダー」向けです。
特にゴールドやFXで、一方向の強いトレンドが出やすい相場で有効です。
Bollinger Band StrategyDescription of the Bollinger Band Breakout Strategy
This trading strategy, credited to Siddhart Bhanushali, is a momentum-based approach that uses Bollinger Bands and a 22-period Simple Moving Average (SMA) to identify high-probability breakout trades. It focuses on detecting periods of low volatility (contraction) followed by high volatility (expansion) to enter trades with a favorable risk-reward ratio. The strategy is designed to capture significant price movements in trending markets, with clear rules for entry, stop loss, and profit targets.
Strategy Overview
The strategy generates buy and sell signals based on specific conditions involving the 22-period SMA and Bollinger Bands. It aims to enter trades when the price breaks out of a consolidation phase, confirmed by the direction of the SMA and the behavior of a green or red candle relative to the Bollinger Bands. The minimum target for each trade is a 1:2 risk-reward ratio.
Credit
This strategy is credited to Siddhart Bhanushali, who designed it to leverage Bollinger Band breakouts in trending markets, providing a clear and systematic approach to trading with defined risk-reward parameters.
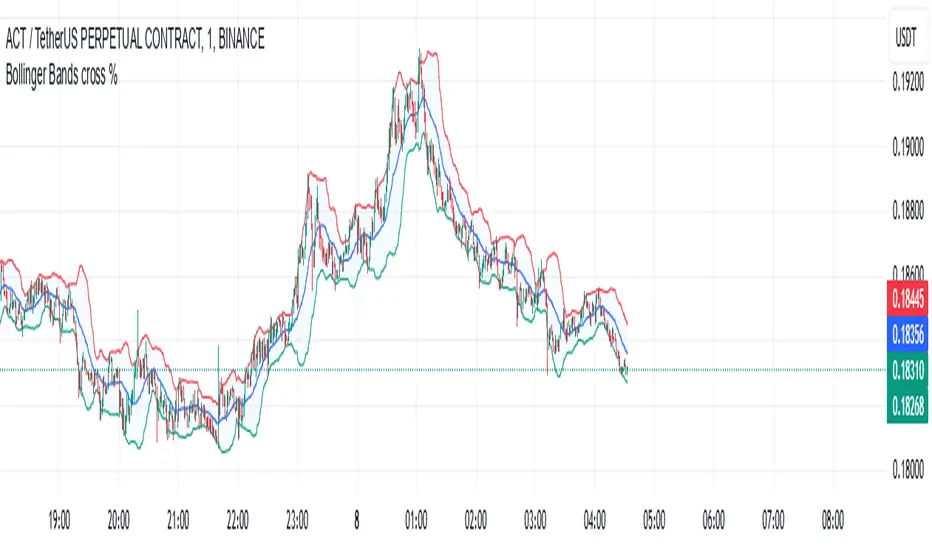
Bollinger Bands cross %The BB strategy (Bollinger Bands strategy) on TradingView utilizes the Bollinger Bands indicator to help traders identify market volatility and potential entry points. The Bollinger Bands indicator consists of three main components:
Middle Band: This is the simple moving average (SMA), usually calculated over a 20-period. It represents the average price over a specific period.
Upper Band and Lower Band: These bands are created by adding and subtracting a multiple of the standard deviation (typically 2) from the middle band. The upper and lower bands help determine the level of price volatility.
How the BB Strategy Works:
Break above the Upper Band: When the price moves above the upper band, it might signal that the market is in an "overbought" condition. This could be a sign to consider selling, but it could also continue if the trend is strong.
Break below the Lower Band: When the price moves below the lower band, it might signal that the market is in an "oversold" condition, which could be a signal to buy if the trend is reversing.
Squeeze (Coiling): When the Bollinger Bands contract, often referred to as a "squeeze," it indicates that the market may be preparing for a strong price move. This is a critical signal in the BB strategy because the narrowing bands signify low volatility and a potential breakout in price.
Specific Strategy:
Buy when price touches the lower band and shows signs of reversal (bullish reversal): If the price touches the lower band, you might wait for a reversal signal, such as a bullish candlestick pattern or confirmation from other indicators like RSI or MACD, indicating oversold conditions.
Sell when price touches the upper band and shows signs of reversal (bearish reversal): Similarly, when the price touches the upper band, you could wait for a bearish reversal signal, such as a bearish candlestick pattern or confirmation from other indicators, and then sell.
Trend-following when bands are expanding: If the Bollinger Bands are expanding and the price continues in the same direction, it could signal a trend-following opportunity.
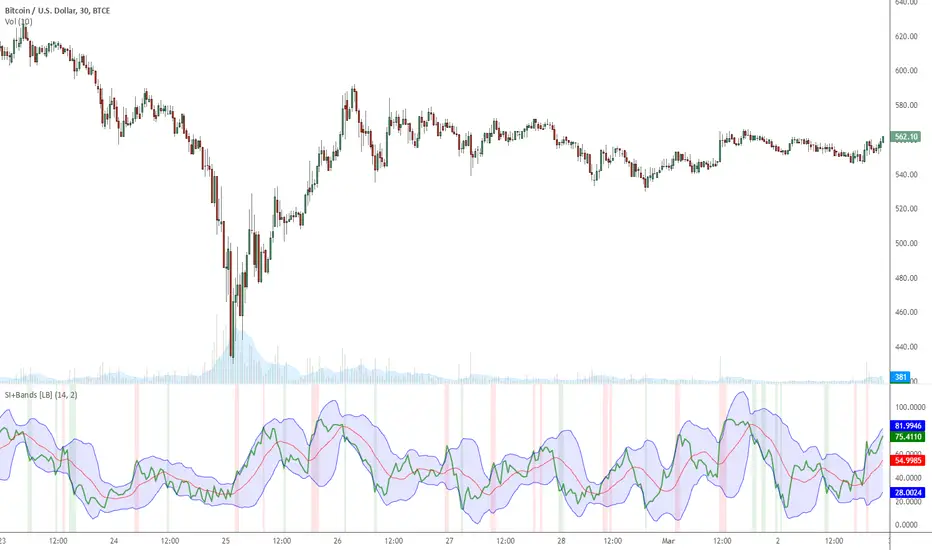
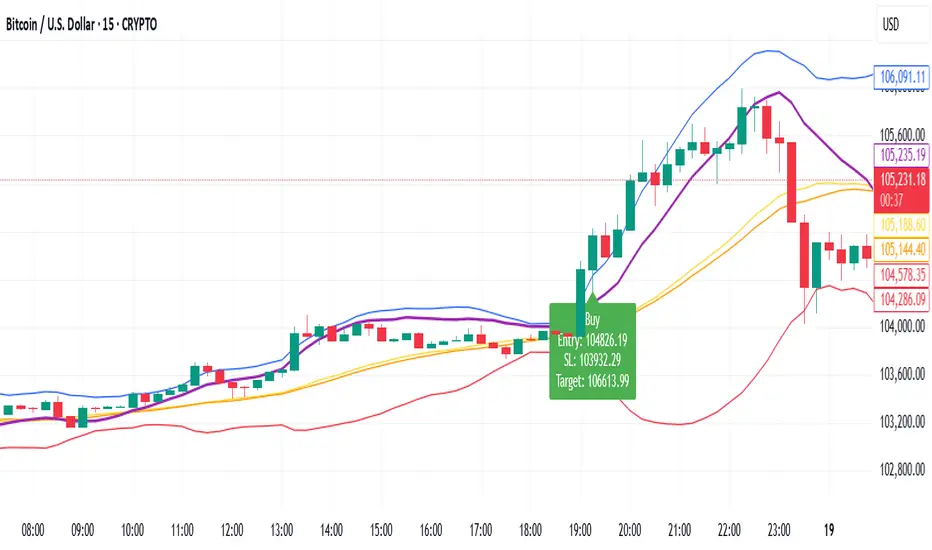
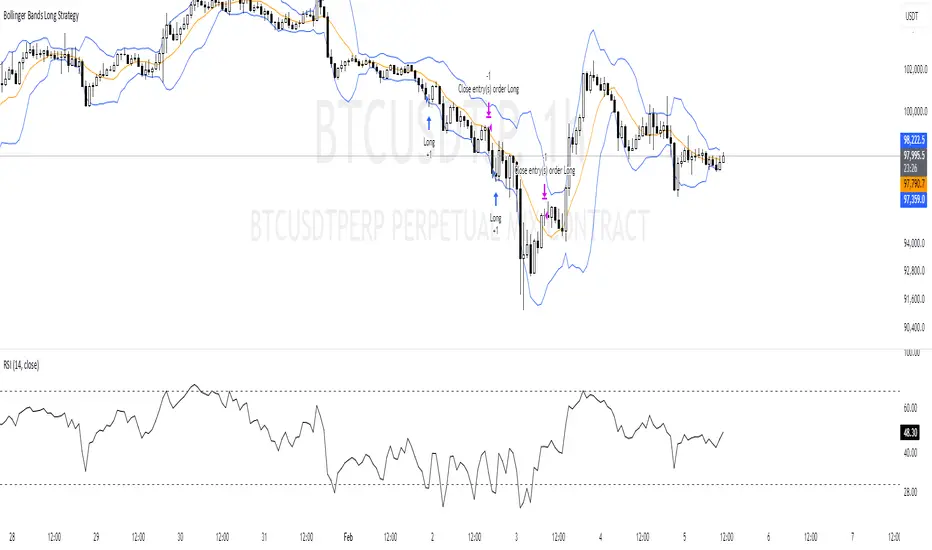
Bollinger Bands Long Strategy
This strategy is designed for identifying and executing long trades based on Bollinger Bands and RSI. It aims to capitalize on potential oversold conditions and subsequent price recovery.
Key Features:
- Bollinger Bands (10,2): The strategy uses Bollinger Bands with a 10-period moving average and a multiplier of 2 to define price volatility.
- RSI Filter: A trade is only triggered when the RSI (14-period) is below 30, ensuring entry during oversold conditions.
- Entry Condition: A long trade is entered immediately when the price crosses below the lower Bollinger Band and the RSI is under 30.
- Exit Condition: The position is exited when the price reaches or crosses above the Bollinger Band basis (20-period moving average).
Best Used For:
- Identifying oversold conditions with a strong potential for a rebound.
- Markets or assets with clear oscillations and volatility e.g., BTC.
**Disclaimer:** This strategy is for educational purposes and should be used with caution. Backtesting and risk management are essential before live trading.
Bollinger Bands CustomThe indicator is a customized version of Bollinger Bands with added trading signals. This indicator is designed to help traders identify potential entry (buy) and exit (sell) points based on the interaction between the price and the Bollinger Bands. Below, I will explain in detail its purpose, how it works, and how to use it.
Purpose of the Indicator
The main purpose of this indicator is:
Identify market volatility: Bollinger Bands expand and contract based on price volatility.
Provide trading signals: The indicator generates buy signals (BUY) when the price crosses the lower band and sell signals (SELL) when the price crosses the upper band.
Help identify dynamic support and resistance levels: The upper and lower bands act as dynamic resistance and support levels.
How the Indicator Works
The indicator is based on three main components:
Moving Average (SMA): It calculates the simple moving average (SMA) of the price over a specified period (length).
Bollinger Bands:
The upper band is calculated as the moving average plus a standard deviation multiplied by a factor (mult).
The lower band is calculated as the moving average minus a standard deviation multiplied by the same factor.
Trading signals:
A BUY signal is generated when the price crosses above the lower band.
A SELL signal is generated when the price crosses below the upper band.
How to Use the Indicator
Here is a step-by-step guide on how to use the indicator on TradingView:
1. Add the Indicator to the Chart
Copy the Pine Script code you created.
Open TradingView and go to the Pine Editor.
Paste the code and click "Add to Chart."
The indicator will be displayed directly on the price chart.
2. Customize the Parameters
You can customize the following parameters:
Moving Average Length (length): Set the period for the moving average (default is 20).
Price Source (source): Choose the price to use (default is the closing price).
Standard Deviation Multiplier (mult): Set the multiplier for the standard deviation (default is 2.0).
3. Interpret the Signals
BUY Signal: When you see a "BUY" label below a candle, it means the price has crossed above the lower band. This could indicate a buying opportunity.
SELL Signal: When you see a "SELL" label above a candle, it means the price has crossed below the upper band. This could indicate a selling opportunity.
4. Use Bollinger Bands as Support and Resistance
If the price approaches the upper band, it might indicate a resistance level.
If the price approaches the lower band, it might indicate a support level.
5. Monitor the Colored Background
The chart background turns light green when there is a BUY signal and light red when there is a SELL signal. This helps you quickly identify signals.
Practical Example
Suppose you are analyzing a daily chart of a stock or cryptocurrency:
If the price crosses above the lower band, the indicator will show a "BUY" label. You might consider this as a signal to open a long position.
If the price crosses below the upper band, the indicator will show a "SELL" label. You might consider this as a signal to close a long position or open a short position.
Limitations and Considerations
False signals: In range-bound markets, Bollinger Bands can generate many false signals. It is advisable to use this indicator in combination with other technical analysis tools.
Extreme volatility: During periods of high volatility, the bands expand, and signals may become less reliable.
Confirmation: It is always good practice to confirm signals with other indicators (e.g., RSI, MACD) or candlestick analysis.
Conclusion
My indicator is a useful tool for identifying potential trading opportunities based on Bollinger Bands. However, as with any indicator, it is important to use it in combination with other forms of analysis and risk management to maximize effectiveness. Happy trading! 🚀
