AI Agent PRIMEFLOW v1AI Agent PRIMEFLOW v1 — Trend + Breakout + Smart Stops
*By AI Agent Community*
## Overview
PRIMEFLOW v1 is a clean, rules-based signal tool that fires only when **trend + regime + market structure** align.
It combines a **baseline trend**, a **volatility regime filter** (ATR z-score), and **Donchian breakouts**, with **ATR bands** and **Chandelier-style stops** for risk control. Optional **HTF confirmation** keeps entries in sync with higher-timeframe bias.
> Built from public trading concepts (EMA/KAMA/HMA baselines, Donchian breakout, ATR trailing). No proprietary code used.
---
## What it does (3-Layer Confirmation)
1. **Trend** – EMA50/200 relationship + user-selectable baseline (EMA/HMA/KAMA).
2. **Regime** – ATR% z-score filter reduces chop; “Conservative/Balanced/Aggressive” modes adjust threshold.
3. **Structure** – Donchian breakout confirms momentum beyond recent range.
Only when all three align do BUY/SELL labels appear. ATR bands and dynamic stops are plotted for exits and trailing.
---
## Signals & Risk
* **Long**: Trend up (EMA50>EMA200), regime trending, price crosses above baseline **and** breaks the prior Donchian high.
* **Short**: Mirror conditions to the downside.
* **Stops**: Auto-plotted **Long/Short Stop** (ATR-based, Chandelier-style).
* **Targets**: Consider 1.5–2× ATR or ATR bands; keep a runner with trailing stop.
---
## Inputs (key)
* **Signal Mode**: Conservative / Balanced / Aggressive (regime threshold).
* **Use Heikin Ashi Source** (optional smoothing).
* **Structure Lookback (Donchian)**.
* **Volatility Lookback** (for ATR z-score).
* **Baseline Type & Length**: EMA / HMA / KAMA.
* **Trend Filter EMAs**: Fast (default 50) vs Slow (default 200).
* **HTF Confirmation**: set a higher TF (blank = off).
* **ATR Length & Multiplier** (bands & stops).
* **Style toggles**: Bands, regime background, labels.
---
## Recommended Presets
**XAUUSD – M15 (scalping/intraday)**
* Mode: *Balanced* · Baseline: *EMA 50* · Donchian: *20* · ATR: *10 × 2.5* · HTF: *H1*.
**XAUUSD – H1 (intraday)**
* Baseline: *KAMA 50* · Donchian: *25* · ATR: *14 × 2.5* · HTF: *H4*.
**BTCUSDT – H1 (crypto)**
* Baseline: *EMA 100* · Donchian: *30* · ATR: *14 × 2.0* · HTF: *H4* · Mode: *Conservative* in chop.
---
## Alerts (ready)
Create alerts **Once Per Bar Close**:
* **PRIMEFLOW Long** – long entry condition met.
* **PRIMEFLOW Short** – short entry condition met.
* **Trail Flip (Long)** – long trailing stop flips (exit/trim).
* **Trail Flip (Short)** – short trailing stop flips.
Tip: Route alerts to your bot/Telegram/WA webhook. Include placeholders (e.g., `{{ticker}} | {{interval}} | {{close}} | LONG/SHORT | SL: {{plot("Long Stop")}}`).
---
## Best Practices
* Avoid taking breakouts that are **>1.5× ATR** away from baseline (overextended).
* Re-enter on pullbacks while trend & regime remain valid.
* Around high-impact news (NFP/FOMC), wait 15–30 minutes after release.
* Use **HTF 4×** your chart TF (e.g., M15→H1, H1→H4).
---
## Who it’s for
Swing/scalp traders who want higher-quality trend entries with **built-in structure confirmation** and **clear risk lines**, especially on **XAUUSD** and **BTC**.
---
## Notes
* This is an **indicator** (not a strategy). A strategy/backtest version can be provided.
* Educational purposes only. Not financial advice. Trading involves risk.
**Tags:** trend, breakout, ATR, Donchian, chandelier stop, regime filter, XAUUSD, BTC, scalping, intraday, multi-timeframe, heikin ashi
**Changelog**
v1.0 – Initial release: 3-Layer Confirmation, ATR bands/stops, HTF bias, 4 alerts.
Recherche dans les scripts pour "恒生指数期货+cfd"

DeMarkerThe DeMarker indicator assesses demand and directional market trends as a way to time market entries and exits, and is particularly suitable fo

Futures Time Zones with Session SelectionMark the time period with color to help traders identify the trading range.


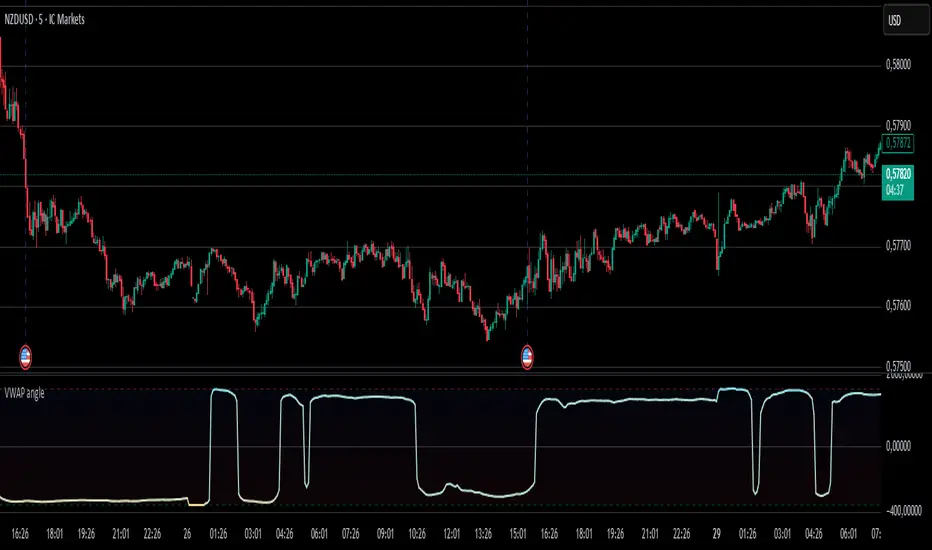
VWAP angleVWAP Angle Indicator
The VWAP Angle indicator is a technical analysis tool designed to measure the directional momentum of the Volume Weighted Average Price (VWAP). Rather than simply plotting the VWAP line itself, this indicator calculates the angle of the VWAP's trajectory over a specified lookback period. It converts the slope into degrees using arctangent mathematics, normalized by the Average True Range (ATR) to account for price volatility. The result is a momentum oscillator that ranges from -100 to +100, providing traders with a clear visual representation of whether the VWAP is trending sharply upward, downward, or moving sideways.
The indicator features customizable overbought and oversold zones (defaulting to +65 and -65 respectively) with color-coded bands to help identify potential reversal points or extreme market conditions. A dynamic color gradient transitions from cyan (bullish angles) to orange (bearish angles), making it easy to spot trend changes at a glance. The visualization includes multiple threshold bands at ±65 and ±80 levels, with shaded regions that intensify as the angle reaches extreme values, helping traders identify when momentum may be overextended.
Built-in alert functionality notifies traders when the VWAP angle crosses into overbought or oversold territories, with optional visual labels appearing directly on the indicator panel. This makes it particularly useful for automated trading strategies or for traders who want real-time notifications of potential trend exhaustion or reversal setups. The indicator works best when combined with other technical tools to confirm signals and filter out false alerts during choppy or ranging market conditions.
Buyer/Seller DominanceBuyer/Seller Dominance Indicator
The Buyer/Seller Dominance indicator is a sophisticated market analysis tool that combines Market Profile methodology with volume analysis to identify which side of the market is in control. It analyzes price distribution across a higher timeframe by calculating the Point of Control (POC) and Value Area, then evaluates where the current price sits relative to these key levels. The indicator processes Time Price Opportunity (TPO) data across 20 price channels to build a comprehensive volume profile of each trading session.
The dominance score is calculated using multiple factors including price position relative to POC, Value Area boundaries, volume imbalance between upper and lower profile sections, price momentum, and volume trends. This multi-factor approach provides a robust measure of market sentiment, smoothed using an EMA to filter out noise. The resulting dominance histogram visually represents whether buyers (positive values) or sellers (negative values) are controlling the market.
The indicator generates clear buy and sell signals when dominance crosses key threshold levels, with additional visual aids including background coloring to show market state (buyer/seller/neutral), overbought/oversold levels at ±50, and an information table displaying current market conditions. It's fully customizable with adjustable timeframes, sensitivity settings, Value Area percentages, and color schemes to suit different trading styles and preferences.RetryClaude can make mistakes. Please double-check responses.

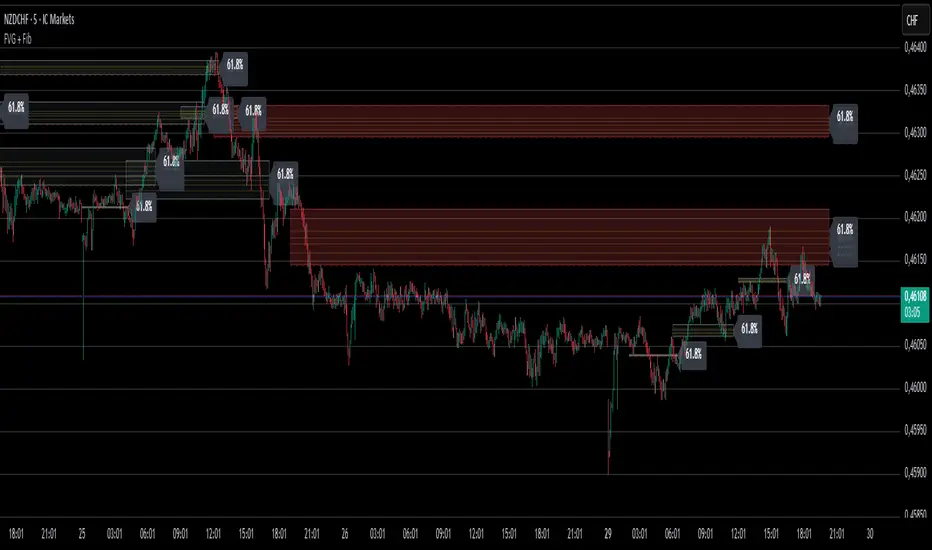
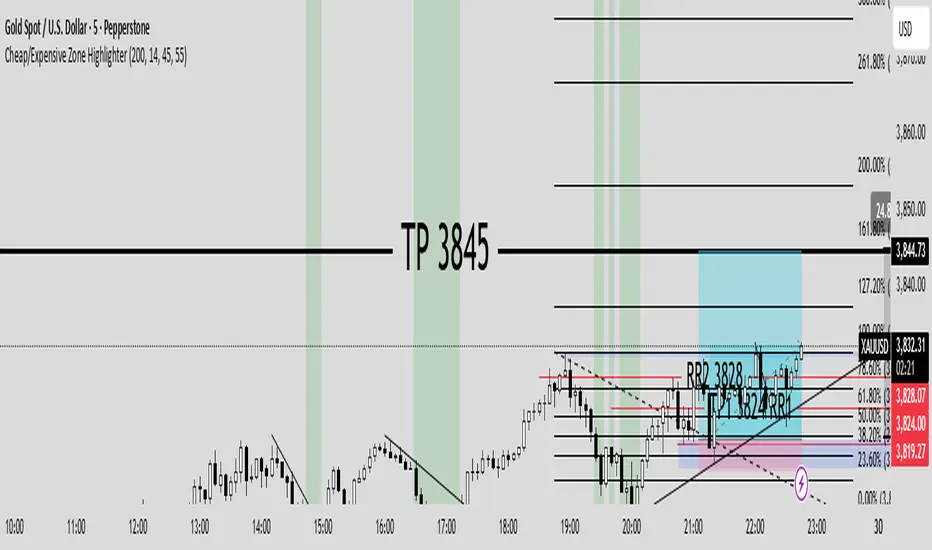
FVG + FIBONACCIThe FVG + FIBONACCI indicator is a sophisticated trading tool that combines Fair Value Gap (FVG) detection with Fibonacci analysis across multiple timeframes. It automatically identifies bullish and bearish Fair Value Gaps - price areas where there is no overlap between consecutive candles, creating "gaps" that often act as significant support and resistance zones. The indicator works on any selected higher timeframe while displaying results on the current chart, making it versatile for various trading strategies and timeframe analyses.
What sets this indicator apart is its integration of Fibonacci retracement levels within each detected FVG zone. Once a Fair Value Gap is identified, the indicator automatically draws key Fibonacci levels (23.6%, 38.2%, 50%, 61.8%, and optionally 78.6%) within the gap, providing precise entry and exit points for traders. Additionally, it offers Fibonacci extensions (127.2%, 161.8%, and 261.8%) that project potential price targets beyond the FVG boundaries, helping traders plan their profit-taking strategies more effectively.
The indicator includes comprehensive customization options, allowing users to control the appearance of FVG zones, Fibonacci levels, and extension lines with different colors and styles. It features intelligent zone management with configurable maximum counts and extension lengths, automatic validity checking that grays out filled gaps, and multiple alert conditions for when price enters FVG zones or touches Fibonacci levels. The tool is designed for both swing and intraday traders who want to combine the powerful concepts of Fair Value Gaps with precise Fibonacci-based entry and exit strategies.

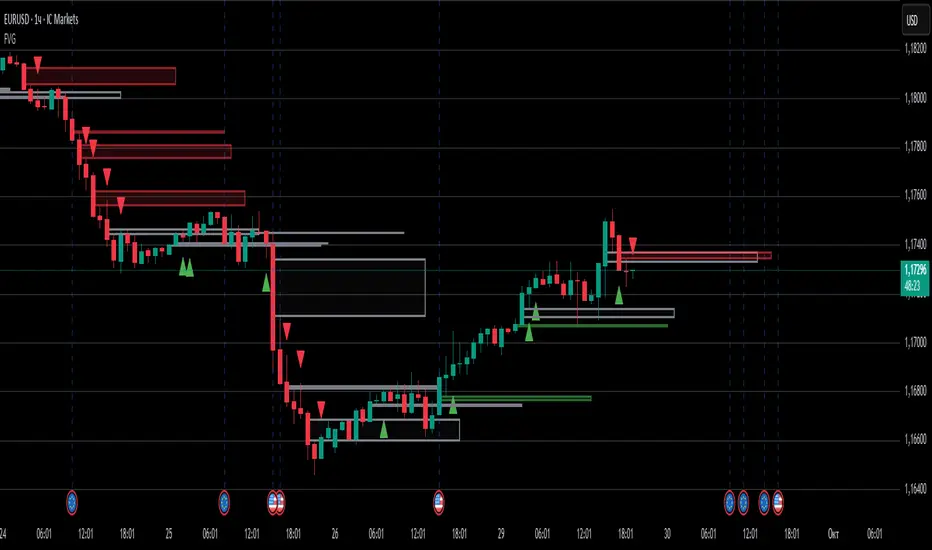
FVG (Fair Value Gaps)The FVG (Fair Value Gaps) indicator is a sophisticated technical analysis tool designed to identify and display fair value gaps on trading charts across multiple timeframes. Fair value gaps represent price inefficiencies that occur when there's a complete separation between consecutive candles, creating an unfilled price zone. The indicator detects these gaps by analyzing three consecutive candles: it identifies bullish FVGs when a green middle candle creates a gap where the high of the left candle is below the low of the right candle, and bearish FVGs when a red middle candle creates a gap where the low of the left candle is above the high of the right candle.
The indicator offers comprehensive customization options and intelligent filtering capabilities. Users can select any higher timeframe for FVG detection while viewing on lower timeframes, choose to display only bullish or bearish gaps, and optionally filter for large candles only to focus on more significant market inefficiencies. The system includes automatic management features such as limiting the maximum number of displayed FVGs to prevent chart clutter, customizable extension lengths for forward projection, and a validation system that continuously monitors whether gaps remain unfilled or have been invalidated by subsequent price action.
Visually, the indicator represents FVGs as colored rectangular boxes with dashed border lines, using green for bullish gaps and red for bearish gaps with full transparency control. When FVGs become invalid (filled by price), they automatically change to gray coloring to indicate their status. The indicator includes real-time alert functionality that triggers when price enters or touches FVG zones, making it valuable for both manual trading decisions and automated trading strategies. Additionally, it features a built-in Telegram channel reference for community support and educational resources.

FlowMaster# 🔥 FlowMaster - The Ultimate Market Dominance Indicator
## **Master the Flow. Dominate the Market.**
**FlowMaster** is a revolutionary trading indicator that reveals who's really controlling the market - buyers or sellers. Using advanced Market Profile analysis and multi-timeframe volume dynamics, FlowMaster gives you the edge to trade with the dominant market force.
---
## 🎯 **Key Features**
### **📊 Advanced Market Profile Analysis**
- **Point of Control (POC)** identification for precise entry/exit levels
- **Value Area** calculation with customizable percentage (default 70%)
- **Multi-timeframe analysis** with intelligent auto-selection
- **Volume distribution mapping** across 20 price channels
### **⚡ Real-Time Dominance Detection**
- **Instant buyer/seller identification** with color-coded background
- **Dominance histogram** showing market strength in real-time
- **Volume imbalance analysis** revealing institutional activity
- **Price momentum integration** for trend confirmation
### **🎯 Smart Trading Signals**
- **Precision buy/sell alerts** with customizable sensitivity
- **Cross-over/cross-under detection** for optimal timing
- **False signal filtering** to reduce noise
- **Multi-factor confirmation** for higher accuracy
### **📋 Professional Dashboard**
- **Live market state display** (BUYERS/SELLERS/NEUTRAL)
- **Dominance score** with numerical precision
- **Price vs POC position** for context awareness
- **Volume imbalance percentage** for institutional insight
- **Active timeframe display** for multi-TF analysis
---
## 🚀 **Why FlowMaster?**
### **✅ Trade with Institutional Flow**
Stop guessing market direction. FlowMaster reveals when institutions are accumulating or distributing, giving you the same advantage as professional traders.
### **✅ Multi-Timeframe Precision**
Whether you're scalping 1-minute charts or swing trading daily timeframes, FlowMaster automatically adapts to provide the most relevant higher timeframe context.
### **✅ Visual Clarity**
No complex setups or confusing signals. FlowMaster uses intuitive color coding and clear visual cues that let you make instant trading decisions.
### **✅ Customizable for Your Style**
- **Adjustable sensitivity** (1-20 levels)
- **Custom color schemes** for personal preference
- **Toggle features** to focus on what matters to you
- **Flexible timeframe selection** or intelligent auto-mode
---
## 📈 **Perfect For:**
- **Day Traders** seeking precise entry/exit points
- **Swing Traders** identifying trend changes and continuations
- **Scalpers** needing instant market sentiment feedback
- **Volume Analysts** wanting professional-grade Market Profile tools
- **All Experience Levels** - from beginners to institutional traders
---
## 🎨 **Visual Elements**
- **🟢 Green Background**: Buyers in control
- **🔴 Red Background**: Sellers dominating
- **⚫ Gray Background**: Neutral/consolidation phase
- **📊 Dynamic Histogram**: Real-time dominance strength
- **🎯 Triangle Signals**: Precise buy/sell entry points
- **📊 Information Table**: Complete market overview at a glance
---
## ⚙️ **Technical Specifications**
- **Platform**: TradingView (Pine Script v5)
- **Markets**: Works on ALL instruments (Forex, Stocks, Crypto, Futures)
- **Timeframes**: From 1-minute to Monthly charts
- **Performance**: Optimized for fast execution
- **Alerts**: Built-in notification system for all signals
---
## 🎯 **Get Started in 3 Steps:**
1. **Add FlowMaster** to your TradingView chart
2. **Customize settings** to match your trading style
3. **Watch the magic happen** - start trading with institutional flow!
---
## 💡 **Pro Tip:**
*Use FlowMaster in combination with your favorite support/resistance levels for maximum effectiveness. When price approaches key levels AND FlowMaster shows dominance shift - that's your high-probability trade setup!*
---
**🔥 Transform your trading today. Master the flow with FlowMaster! 🔥**
*"Finally, an indicator that shows me exactly who's in control of the market. My win rate increased dramatically since using FlowMaster!"* - Professional Day Trader
Скрипт с защищённым кодом
Этот скрипт опубликован с закрытым исходным кодом. Однако вы можете использовать его свободно и без каких-либо ограничений — читайте подробнее здесь.
Smart-Day-Trader
t.me/smart_day_trader
Мои профили:
Отказ от ответственности
Все виды контента, которые вы можете увидеть на TradingView, не являются финансовыми, инвестиционными, торговыми или любыми другими рекомендациями. Мы не предоставляем советы по покупке и продаже активов. Подробнее — в Условиях ис

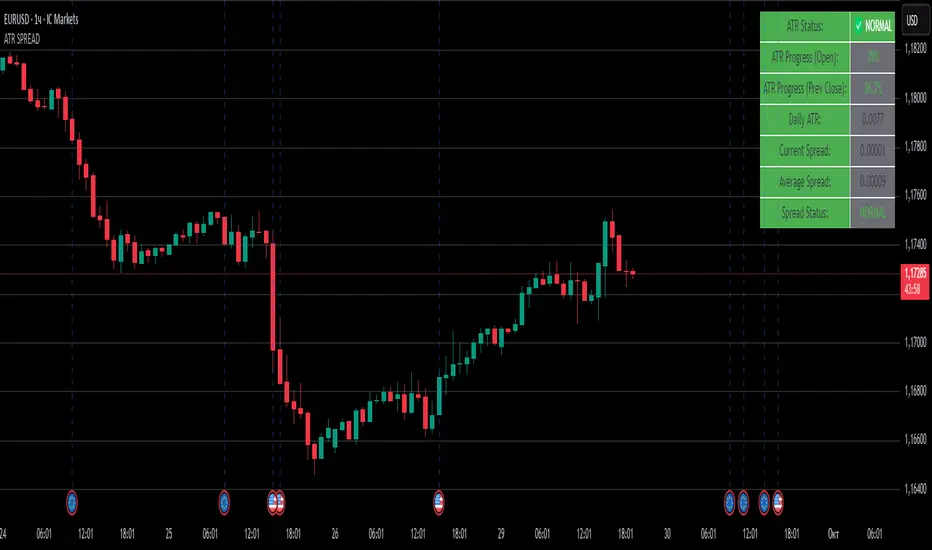
ATR SPREADThis is a comprehensive ATR SPREAD indicator for TradingView that combines volatility monitoring with spread analysis. Here's what it does and why it's useful:
Core Functionality
ATR Progress Tracking:
Monitors how much of the daily ATR (Average True Range) has been "consumed" during the current trading day
Calculates progress from two reference points: day's open and previous day's close
Displays progress as percentages or absolute values
Provides color-coded visual feedback (green → yellow → orange → red) based on ATR consumption levels
Spread Monitoring with Advanced Filtering:
Tracks current market spreads using multiple methods (minute high-low ranges, tick-to-tick differences)
Calculates rolling average spread to establish baseline conditions
Implements sophisticated filtering to exclude anomalous spread readings that could skew analysis
Key Features
Smart Filtering System:
Automatically filters out abnormal spreads during session opens
Excludes spreads that are too large relative to price or ATR
Removes outliers that exceed normal spread multiples
Maintains data quality for accurate analysis
Multi-Level Alert System:
ATR threshold alerts (50%, 80%, 100% consumption)
Customizable warning threshold (default 70%)
Spread expansion warnings and alerts
Session start notifications
Professional Dashboard:
Customizable information panel showing real-time metrics
Multiple positioning options and visual themes
Displays ATR status, progress percentages, current/average spreads
Color-coded status indicators for quick assessment
Trading Applications
Risk Management:
Helps traders understand how much daily volatility has been used up
Assists in position sizing based on remaining expected movement
Identifies periods of unusual market conditions
Market Condition Assessment:
Monitors liquidity conditions through spread analysis
Detects when spreads widen beyond normal levels
Filters out unreliable data during volatile periods
Entry/Exit Timing:
High ATR consumption may suggest limited further movement
Low ATR consumption early in the day might indicate potential for larger moves
Spread conditions help assess execution quality expectations
This indicator is particularly valuable for intraday traders, scalpers, and anyone who needs to monitor market microstructure conditions alongside volatility metrics. It provides a comprehensive view of both price movement potential (ATR) and execution environment quality (spreads) in a single, professional-grade tool.
FVGFVG (Fair Value Gap) Indicator
The Fair Value Gap (FVG) indicator is a powerful tool designed to identify price imbalance zones that often act as critical support and resistance levels in the market. An FVG occurs when there is a gap between the high of one candle and the low of another candle two periods away, creating an unfilled price area that the market tends to revisit. These zones represent areas where institutional orders may be waiting and can provide high-probability trading opportunities.
This indicator automatically detects both bullish and bearish FVGs across any selected timeframe while ensuring complete reliability with no repainting. It uses only confirmed bar data with lookahead protection, making it suitable for live trading and backtesting. The tool features customizable visual elements including zone colors, transparency levels, and timeframe labels, along with automatic mitigation tracking that monitors when FVGs get filled by price action.
Key features include multi-timeframe analysis, extending zones to the right for ongoing relevance, flexible display options for both active and mitigated FVGs, and built-in alert system for new FVG formations. The indicator also provides comprehensive labeling options and maintains a clean chart by automatically managing the maximum number of displayed zones, making it an essential tool for traders following smart money concepts and institutional trading strategies.
Cheap/Expensive Zone Highlighter V.2 Publicindicator Cheap/Expensive Zone Highlighter Ver2
Uptrend = Based on price> EMA200 (O+H+L+C)/4
Cheap zone = RSI<45
Dowtrend = Based on price< EMA200 (O+H+L+C)/4
Expensive Zone= RSI>55
Cheap/Expensive Zone Highlighter V.2 indicator Cheap/Expensive Zone Highlighter Ver2
Uptrend = Based on price> EMA200 (O+H+L+C)/4
Cheap zone = RSI<45
Dowtrend = Based on price< EMA200 (O+H+L+C)/4
Expensive Zone= RSI>55

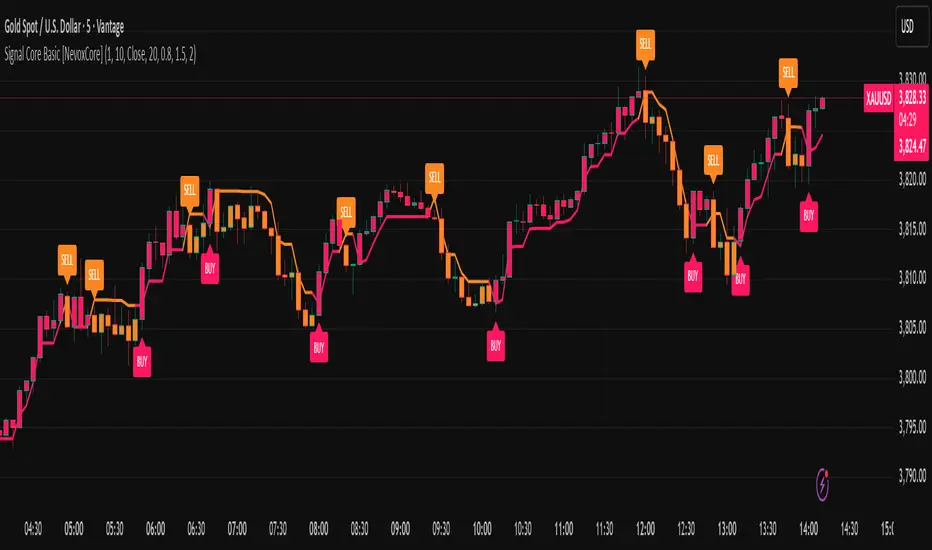
Signal Core Basic [NevoxCore]⯁ OVERVIEW
Signal Core Basic is a clean and functional ATR-based trailing stop with BUY/SELL signals.
It modernizes the classic "UT-style" concept with adaptive sensitivity, multi-source inputs (Close, Heikin-Ashi, ZLEMA, KAMA), and compact visuals.
The tool is designed for traders who want a clear, minimal, and reliable base indicator without repainting issues.
⯁ HOW IT WORKS
Calculates an ATR-based trailing stop (nLoss = Key × ATR).
Adaptive mode scales sensitivity depending on trend strength (trend/range detection).
Trailing stop flips when price crosses from one regime to the other.
BUY/SELL signals trigger only when confirmed and not blocked by cooldown.
Label ring-buffer ensures chart stays clean (max 50 labels).
Bar coloring optional (solid), auto-disabled when classic red/green colors are enabled.
⯁ KEY FEATURES
ATR-based trailing stop with adjustable sensitivity.
Adaptive key (trend/range aware).
Multiple compute sources: Close, Heikin-Ashi, ZLEMA, KAMA.
Global confirm-on-close switch (no repaint).
Early-flip protection (cooldown).
Compact BUY/SELL labels with auto-cleanup (max 50).
Optional solid bar coloring.
Alerts with ticker, timeframe, and price included.
⯁ SETTINGS (quick overview)
Visual: Classic Colors, Show Labels, Plot Trailing Stop, Barcolor ON/OFF.
Source & Sensitivity: Key Value, ATR Length, Compute Source.
Advanced: Adaptive Key toggle with min/max bounds.
Global: Confirm on bar close.
Extras: Cooldown protection (bars).
⯁ ALERTS (built-in)
Basic Long: BUY signal.
Basic Short: SELL signal.
Each alert includes {{ticker}} {{interval}} @ {{close}}.
⯁ HOW TO USE
Use as a trailing stop and regime filter.
Combine BUY/SELL signals with your strategy rules.
Enable cooldown for cleaner signals in choppy markets.
Try ZLEMA or Heikin-Ashi as compute source for smoother performance.
⯁ WHY IT’S DIFFERENT
Unlike generic UT-style scripts, Signal Core Basic adds adaptive sensitivity, multiple input sources, and strict non-repaint safety.
The visuals follow NevoxCore’s design standards: compact, minimal, and clean — ready for live trading with alerts.
⯁ DISCLAIMER
Backtest and paper-trade before using live. Not financial advice.
Performance depends on market, timeframe, and parameters.
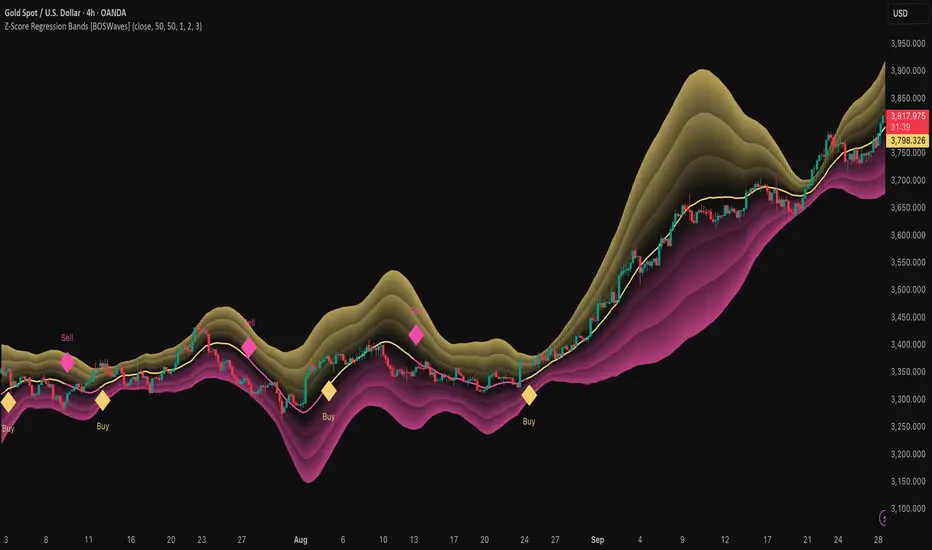
Z-Score Regression Bands [BOSWaves]Z-Score Regression Bands – Adaptive Trend and Volatility Insight
Overview
The Z-Score Regression Bands is a trend and volatility analysis framework designed to give traders a clear, structured view of price behavior. It combines Least Squares Moving Average (LSMA) regression, a statistical method to detect underlying trends, with Z-Score standardization, which measures how far price deviates from its recent average.
Traditional moving average bands, like Bollinger Bands, often lag behind trends or generate false signals in noisy markets. Z-Score Regression Bands addresses these limitations by:
Tracking trends accurately using LSMA regression
Normalizing deviations with Z-Scores to identify statistically significant price extremes
Visualizing multiple bands for normal, strong, and extreme moves
Highlighting trend shifts using diamond markers based on Z-Score crossings
This multi-layered approach allows traders to understand trend strength, detect overextensions, and identify periods of low or high volatility — all from a single, clear chart overlay. It is designed for traders of all levels and can be applied across scalping, day trading, swing trading, and longer-term strategies.
Theoretical Foundation
The Z-Score Regression Bands are grounded in statistical and trend analysis principles. Here’s the idea in plain terms:
Least Squares Moving Average (LSMA) – Unlike standard moving averages, LSMA fits a straight line to recent price data using regression. This “best-fit” line shows the underlying trend more precisely and reduces lag, helping traders see trend changes earlier.
Z-Score Standardization – A Z-Score expresses how far the LSMA is from its recent mean in standard deviation units. This shows whether price is unusually high or low, which can indicate potential reversals, pullbacks, or acceleration of a trend.
Multi-Band Structure – The three bands represent: Band #1: Normal range of price fluctuations; Band #2: Significant deviation from the trend; Band #3: Extreme price levels that are statistically rare. The distance between bands dynamically adapts to market volatility, allowing traders to visualize expansions (higher volatility) and contractions (lower volatility).
Trend Signals – When Z-Score crosses zero, diamonds appear on the chart. These markers signal potential trend initiation, continuation, or reversal, offering a simple alert for shifts in market momentum.
How It Works
The indicator calculates and plots several layers of information:
LSMA Regression (Trend Detection)
Computes a line that best fits recent price points.
The LSMA line smooths out minor fluctuations while reflecting the general direction of the market.
Z-Score Calculation (Deviation Measurement)
Standardizes the LSMA relative to its recent average.
Positive Z-Score → LSMA above average, negative → LSMA below average.
Helps identify overbought or oversold conditions relative to the trend.
Multi-Band Construction (Volatility Envelope)
Upper and lower bands are placed at configurable multiples of standard deviation.
Band #1 captures typical price movement, Band #2 signals stronger deviation, Band #3 highlights extreme moves.
Bands expand and contract with volatility, giving an intuitive visual guide to market conditions.
Trend Signals (Diamonds)
Appear when Z-Score crosses zero.
Indicates moments when momentum may shift, helping traders time entries or exits.
Visual Interpretation
Band width = volatility: wide bands indicate strong movement; narrow bands indicate calm periods.
LSMA shows underlying trend direction, while bands show how far price has strayed from that trend.
Interpretation
The Z-Score Regression Bands provide a multi-dimensional view of market behavior:
Trend Analysis – LSMA line slope shows general market direction.
Momentum & Volatility – Z-Score indicates whether the trend is accelerating or losing strength; band width indicates volatility levels.
Price Extremes – Price touching Band #2 or #3 may suggest overextension and potential reversals.
Trend Shifts – Diamonds signal statistically significant changes in momentum.
Cycle Awareness – Standard deviation bands help distinguish normal market fluctuations from extreme events.
By combining these insights, traders can avoid false signals and react to meaningful structural shifts in the market.
Strategy Integration
Trend Following
Enter trades when diamonds indicate momentum aligns with LSMA direction.
Use Band #1 and #2 for stop placement and partial exits.
Breakout Trading
Watch for narrow bands (low volatility) followed by price pushing outside Band #1 or #2.
Confirm with Z-Score movement in the breakout direction.
Mean Reversion/Pullback
If price reaches Band #2 or #3 without continuation, expect a pullback toward LSMA.
Exhaustion & Reversals
Flattening Z-Score near zero while price remains at extreme bands signals trend weakening.
Tighten stops or scale out before a potential reversal.
Multi-Timeframe Confirmation
High timeframe LSMA confirms the main trend.
Lower timeframe bands provide refined entry and exit points.
Technical Implementation
LSMA Regression : Best-fit line minimizes lag and captures trend slope.
Z-Score Standardization : Normalizes deviation to allow consistent interpretation across markets.
Multi-Band Envelope : Three layers for normal, strong, and extreme deviations.
Trend Signals : Automatic diamonds for Z-Score zero-crossings.
Band Fill Options : Optional shading to visualize volatility expansions and contractions.
Optimal Application
Asset Classes:
Forex : Capture breakouts, overextensions, and trend shifts.
Crypto : High-volatility adaptation with adjustable band multipliers.
Stocks/ETFs : Identify trending sectors, reversals, and pullbacks.
Indices/Futures : Track cycles and structural trends.
Timeframes:
Scalping (1–5 min) : Focus on Band #1 and trend signals for fast entries.
Intraday (15m–1h) : Use Bands #1–2 for continuation and breakout trades.
Swing (4h–Daily) : Bands #2–3 capture trend momentum and exhaustion.
Position (Daily–Weekly) : LSMA trend dominates; Bands #3 highlight regime extremes.
Performance Characteristics
Strong Performance:
Trending markets with moderate-to-high volatility
Assets with steady liquidity and identifiable cycles
Weak Performance:
Flat or highly choppy markets
Very short timeframes (<1 min) dominated by noise
Integration Tips
Combine with support/resistance, volume, or order flow analysis for confirmation.
Use bands for stops, targets, or scaling positions.
Apply multi-timeframe analysis: higher timeframe LSMA confirms main trend, lower timeframe bands refine entries.
Disclaimer
The Z-Score Regression Bands is a trading analysis tool, not a guaranteed profit system. Its effectiveness depends on market conditions, parameter selection, and disciplined risk management. Use it as part of a broader trading strategy, not in isolation.
Scalper - Pattern Recognition & Price Action with Divergence Scalper - Pattern Recognition & Price Action with Divergence
Overview
An educational indicator designed to demonstrate comprehensive technical analysis concepts through integrated pattern recognition, price action analysis, and divergence detection. This tool combines traditional candlestick patterns with modern institutional concepts and advanced divergence analysis for educational market study.
Educational Purpose & Originality
Core Educational Concepts
This indicator serves as a learning platform for understanding:
- **Pattern Recognition Methodology**: Systematic identification of candlestick formations
- **Price Action Theory**: Modern institutional footprint analysis
- **Divergence Analysis**: Momentum divergence detection across multiple oscillators
- **Confluence Systems**: Multi-signal integration and validation techniques
Original Implementation Features
1. Enhanced Pattern Detection Library
- **Volatility-Filtered Patterns**: ATR-based validation for pattern significance
- **Volume-Confirmed Formations**: Integration of volume analysis with pattern detection
- **Multi-Candle Pattern Recognition**: Three-candle formations and complex patterns
- **Context-Aware Detection**: Patterns validated against market structure
2. Advanced Divergence System
- **Multi-Oscillator Analysis**: RSI, CCI, and MACD divergence detection
- **Four Divergence Types**: Regular bullish/bearish and hidden bullish/bearish
- **Pivot-Based Detection**: Systematic swing high/low identification
- **Weighted Signal Integration**: Divergences integrated into confluence scoring
3. Modern Price Action Concepts
- **Fair Value Gaps (FVG)**: Identification of institutional inefficiencies
- **Order Block Detection**: Volume-validated accumulation/distribution zones
- **Dynamic Support/Resistance**: Touch-count validated levels with ATR tolerance
- **Breakout Analysis**: Volume-confirmed price breakouts
4. Intelligent Confluence System
- **Multi-Signal Aggregation**: Combines patterns, oscillators, divergences, and breakouts
- **Weighted Scoring Algorithm**: Different signal types receive appropriate weighting
- **Visual Confluence Display**: Clear indication of high-probability setups
- **Reason Tracking**: Shows which signals contribute to confluence
How to Use
Initial Configuration
1. **Enable Desired Components**: Toggle individual analysis modules based on learning focus
2. **Adjust Sensitivity Settings**: Configure pattern detection parameters for your market
3. **Select Divergence Options**: Choose oscillators and divergence types to monitor
4. **Set Confluence Requirements**: Define minimum signals needed for confirmation
Component Settings
Moving Average Configuration
- Four customizable MA lines for multi-timeframe trend analysis
- Selectable MA types (SMA, EMA, WMA, VWMA, HMA)
- Independent timeframe settings for each MA
Pattern Recognition Settings
- **Engulfing Patterns**: Strong engulfing with ATR validation
- **Doji Variations**: Standard, gravestone, and dragonfly detection
- **Hammer/Hanging Man**: Context-validated reversal patterns
- **Star Formations**: Morning and evening star patterns
- **Three Soldiers/Crows**: Momentum continuation patterns
Divergence Detection Parameters
- **Lookback Period**: Adjustable swing detection range
- **Minimum Pivot Strength**: Percentage threshold for valid pivots
- **Oscillator Selection**: RSI, CCI, MACD, or combination
- **Divergence Types**: Regular and hidden divergences
Signal Interpretation
Visual Indicators
- **Pattern Labels**: Clear marking of detected formations
- **Divergence Lines**: Visual connection between price and oscillator pivots
- **Support/Resistance Levels**: Dynamic horizontal levels with validation
- **Confluence Signals**: Large "BULL" or "BEAR" labels for high-probability setups
Dashboard Information
- Real-time oscillator values (RSI, CCI, MACD)
- Current signal count for bulls and bears
- Active divergence status
- Confluence confirmation status
Important Educational Considerations
Learning Focus
- **Pattern Study**: Understand how traditional patterns form and their limitations
- **Divergence Concepts**: Learn to identify momentum shifts before price reversals
- **Confluence Theory**: Practice combining multiple analysis techniques
- **Risk Awareness**: No pattern or signal guarantees future price movement
Limitations for Learning
- **Historical Analysis**: Patterns are identified after formation
- **No Predictive Guarantee**: Educational tool for understanding concepts, not predictions
- **Market Context Required**: Patterns should be considered within broader market context
- **Practice Required**: Effective use requires study and practice
Educational Best Practices
1. **Start Simple**: Enable one component at a time to understand each concept
2. **Paper Trade**: Practice identifying signals without real money risk
3. **Study Failed Signals**: Learn why patterns fail to improve understanding
4. **Combine with Other Analysis**: Use alongside fundamental and sentiment analysis
5. **Document Observations**: Keep a journal of pattern occurrences and outcomes
Technical Components
Indicator Architecture
- **Modular Design**: Independent modules for different analysis types
- **Performance Optimization**: Efficient calculation methods for smooth operation
- **Visual Management**: Controlled use of Pine Script drawing objects
- **Array-Based Storage**: Efficient data management for historical analysis
Calculation Methods
- **ATR-Based Validation**: Volatility-adjusted pattern filtering
- **Volume Analysis**: Comparative volume assessment for confirmation
- **Pivot Detection**: Mathematical identification of swing points
- **Statistical Validation**: Touch-count and tolerance-based S/R levels
Divergence Detection Methodology
Regular Divergences (Reversal Signals)
- **Bullish**: Price lower low + Oscillator higher low
- **Bearish**: Price higher high + Oscillator lower high
Hidden Divergences (Continuation Signals)
- **Hidden Bullish**: Price higher low + Oscillator lower low
- **Hidden Bearish**: Price lower high + Oscillator higher high
Validation Criteria
- Minimum pivot strength requirement (percentage-based)
- Lookback period for swing detection
- Multiple oscillator confirmation option
Confluence Scoring System
Signal Categories
1. **Pattern Signals** (Weight: 1): Candlestick formations
2. **Oscillator Signals** (Weight: 1): RSI/CCI extremes
3. **Breakout Signals** (Weight: 1): Volume-confirmed breaks
4. **Regular Divergences** (Weight: 2): Higher probability reversals
5. **Hidden Divergences** (Weight: 1): Trend continuation signals
Confluence Thresholds
- Adjustable minimum signal requirement (2-6 signals)
- Visual indication when threshold is met
- Detailed reason display for educational understanding
Educational Dashboard
Real-Time Metrics
- Oscillator readings (RSI, CCI, MACD)
- ATR volatility measurement
- Bull/Bear signal counts
- Divergence status
- Confluence confirmation
Customization Options
- Position selection (6 screen locations)
- Color customization for all elements
- Enable/disable individual components
Version Information
- **Version 1.1**: Added comprehensive divergence detection system
- **Educational Focus**: Designed for learning technical analysis concepts
- **Integration**: All components work together in confluence system
Disclaimer
This indicator is designed exclusively for educational purposes to demonstrate technical analysis concepts. It is not financial advice and should not be used as the sole basis for trading decisions. Past patterns and signals do not guarantee future results. Trading involves substantial risk of loss. Users should conduct their own research, practice with demo accounts, and consider seeking advice from qualified professionals before making investment decisions.
Learning Resources
The indicator includes extensive inline comments explaining each calculation and concept. Users are encouraged to study the source code to understand the methodology behind each component. This transparency aids in learning how technical indicators work and their limitations.
---
**Note**: This is an educational tool meant to help traders learn pattern recognition and technical analysis concepts. Success requires practice, additional analysis, and proper risk management.

Gold NY Session Key TimesJust showing to us that news come out, open market, close bond for NY Session Time For Indonesia

LDR 2025 — DayTHIS IS NOT AN INDICATOR!
It's a loving gentle reminder for traders to keep an eye if this LDR day might impact your trading.

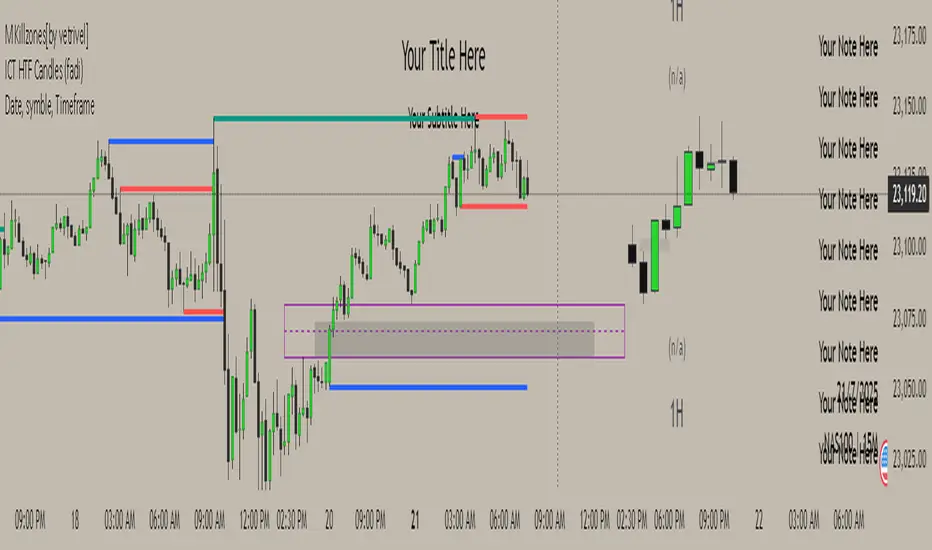
M Killzones[by vetrivel]Cool free style Session indicator, Inspired by TJR trader session times and it's easily changeable. Really this session times changes everything. Basic requirement to use this Discipline and Mindset
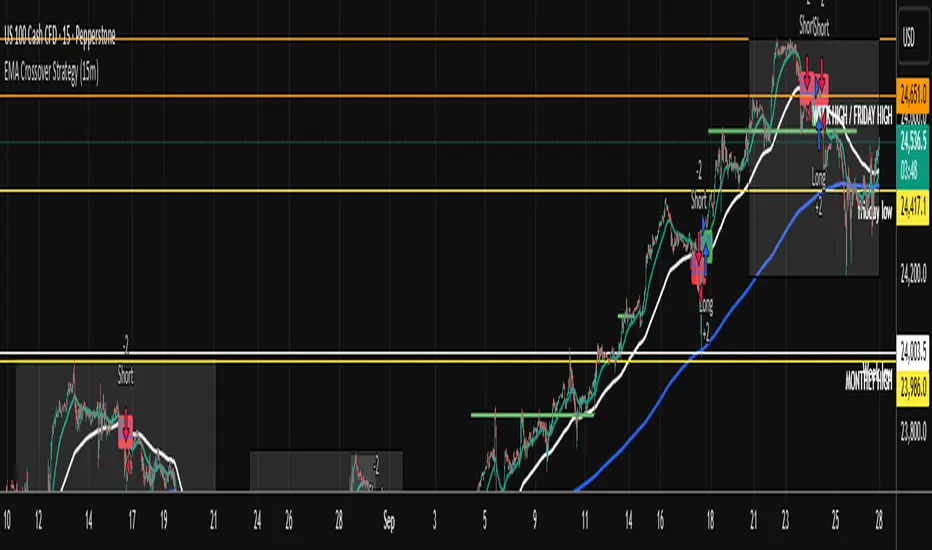
EMA Crossover Strategy (15m)50 and 200 ema crossing when leaving anchor. when 50 and 200 crosses will give you direction of where market is going. wait for a pull back and take trade. sl on highest or lowest point of apex tp open . when you see multiple equal ( low or High) get put of trade.
Effort vs Result TRFxThe Effort vs Result (EVR) indicator is designed to identify high-probability reversal signals based on volume and price action dynamics. It highlights points where the market “effort” (high volume) does not correspond to an immediate “result” (price continuation), providing actionable trade setups for both bullish and bearish scenarios.
Features:
Detects bullish EVR signals when a previous high-volume sell candle is followed by a strong bullish candle that sweeps the previous low.
Detects bearish EVR signals when a previous high-volume buy candle is followed by a strong bearish candle that sweeps the previous high.
Sticky arrows plot automatically above or below the candle, ensuring the signal moves with the price bar.
Considers inside bars, wick size, and relative volume to filter low-quality setups.
Fully compatible with multiple timeframes.
Inputs:
Volume Multiplier: Sets how much higher the current candle’s volume should be compared to the previous candle to count as high volume.
Min Wick % of Candle: Minimum wick size relative to the candle body to filter insignificant bars.
Max Inside Bars to Ignore: Number of inside bars between the previous candle and the EVR candle to ignore minor consolidations.
Usage:
(Green Arrow): Enter long when a green arrow appears below the candle. Place stop-loss slightly below the previous swing low.
(Red Arrow): Enter short when a red arrow appears above the candle. Place stop-loss slightly above the previous swing high.
Can be combined with support/resistance levels, trendlines, or other technical indicators for higher accuracy.
Benefits:
Simple and clean visual signals with tiny arrows that move with candles.
Helps traders identify high-probability reversal points based on volume and price action.
Ideal for intraday and swing trading strategies.

Alerte Croisement EMA9 & SMA12 (Zone remplie)📊 Moving Average 1
Period: 9 → The average is calculated over the last 9 candles (or time periods).
Shift: 0 → No shift; the average is aligned with the current data.
Method: Exponential → Uses an Exponential Moving Average (EMA), which gives more weight to recent data.
Apply to: Close → The average is based on the closing price of each candle.
📊 Moving Average 2
Period: 12 → Calculated over the last 12 periods.
Shift: 0 → No shift.
Method: Simple → Uses a Simple Moving Average (SMA), which gives equal weight to each period.
Apply to: Close → Based on closing prices.
