Recherche dans les scripts pour "科创50指数历史波动率及最大回撤数据"
50-Minute Opening Range BreakoutThis is a test of the opening range with Bearish/Bullish confirmation

50-Line Oscillator // (\_/)
// ( •.•)
// (")_(")
25-Line Oscillator
Description:
The 25-Line Oscillator is a sophisticated technical analysis tool designed to visualize market trends through the use of multiple Simple Moving Averages (SMAs). This indicator computes a series of 26 SMAs, incrementally increasing the base length, providing traders with a comprehensive view of price dynamics.
Features:
Customizable Base Length: Adjust the base length of the SMAs according to trading preferences, enhancing versatility for different market conditions.
Rainbow Effect: The indicator employs a visually appealing rainbow color scheme to differentiate between the various trend lines, making it easy to identify crossovers and momentum shifts.
Crossovers Detection: The script includes logic to detect crossover events between consecutive trend lines, which can serve as signals for potential entry or exit points in trading.
Clear Visualization: Suitable for both novice and seasoned traders, the plots enable quick interpretation of trends and market behavior.
How to Use:
Add the indicator to your chart and customize the base length as desired.
Observe the rainbow-colored lines for trend direction.
Look for crossover events between the SMAs as potential trading signals.
Application: This indicator is particularly useful for swing traders and trend followers who aim to capitalize on market momentum and identify reversals. By monitoring the behavior of multiple SMAs, traders can gain insights into the strength and direction of price movements over various time frames.


AK Simple Moving Average 50 days Simple Moving average suitable for Intraday on 1Hr,30Min.15Min Time frames
1. When candle crossing above SMA Line - Go for Long Entries
2. When candle crossing below SMA Line - Go for short Entries
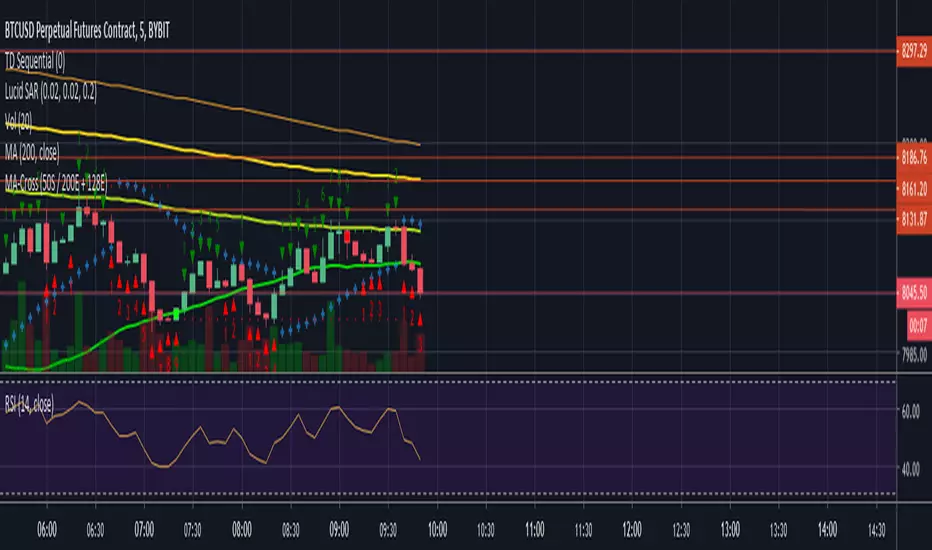
50 SMA / 200 EMA / 128EMA Moving Average CrossFound success using 50SMA vs 200EMA.
128 EMA also charted for it's BTC relevance.


50/100/200 Moving Averages (Pine Script For Copy)by fresca
SCRIPT LANGUAGE
Copy script below and adjust based on your preferences.
-function (change function from "sma" to "ema", "wma" and more)
-length (25 Day, 150 Day or add more averages to the three in this script.)
-color, (red, yellow, etc. or use color hex codes i.e. #FEDA15, #FFAD8F, etc.)
-transparency (set to desired level 1-100)
Or add more options.
RESOURCES
Color hex codes site: www.canva.com
Trading View Pine Script Editor Reference Guide: www.tradingview.com

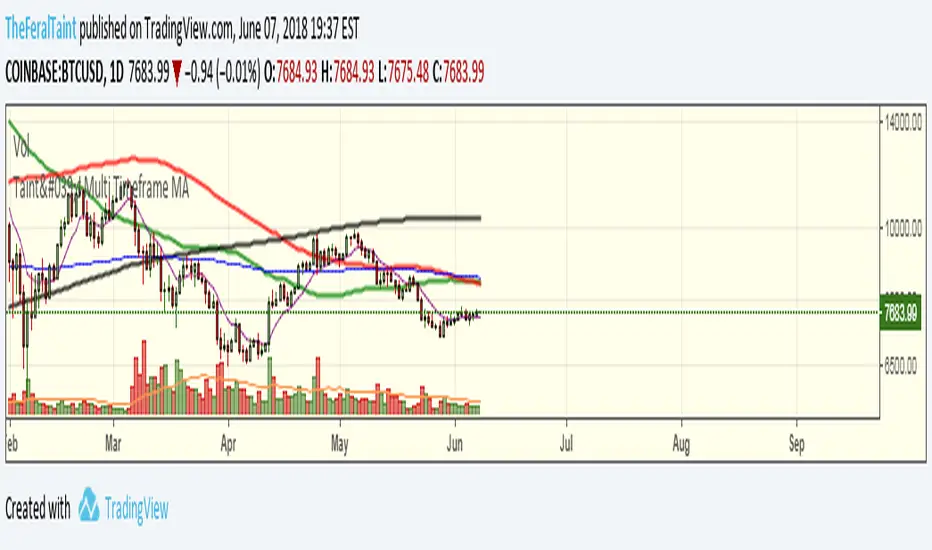
Taint's Multi Time Frame MA50-100-200 SMA with two 200 EMA's all with the ability choose a time frame for each.


MCL RSI Conflux v2.5 — Multi-Timeframe Momentum & Z-Score Full Description
Overview
The MCL RSI Conflux v2.5 is a multi-timeframe momentum model that integrates daily, weekly, and monthly RSI values into a unified composite. It extends the classical RSI framework with adaptive overbought/oversold thresholds and statistical normalization (Z-score confluence).
This combination allows traders to visualize cross-timeframe alignment, identify synchronized momentum shifts, and detect exhaustion zones with higher statistical confidence.
Methodology
The script extracts RSI data from three major time horizons:
Daily RSI (short-term momentum)
Weekly RSI (intermediate trend)
Monthly RSI (macro bias)
Each RSI is optionally smoothed, weighted, and aggregated into a Composite RSI.
A Z-score transformation then measures how far each RSI deviates from its historical mean, revealing when momentum strength is statistically extreme or aligned across timeframes.
Key Features
Multi-Timeframe RSI Engine – Computes RSI across D/W/M intervals with individual weighting controls.
Adaptive Overbought/Oversold Bands – Automatically adjusts OB/OS thresholds based on rolling volatility (standard deviation of daily RSI).
Composite RSI Score – Weighted consensus RSI that represents total market momentum.
Z-Score Confluence Analysis – Identifies when all three timeframes are statistically synchronized.
Z-Composite Histogram – Displays aggregated Z-score strength around the midline (50).
Divergence Detection – Flags confirmed pivot-based bull and bear divergences on the daily RSI.
Dynamic Gradient Background – Shifts from red to green based on composite momentum regime.
Customizable Control Panel – Displays RSI values, Z-scores, state, and adaptive bands for each timeframe.
Integrated Alerts – For crossovers, risk-on/off thresholds, alignment, and Z-confluence events.
Interpretation
All RSI values above 50: multi-timeframe bullish alignment.
All RSI values below 50: multi-timeframe bearish alignment.
Composite RSI > 60: risk-on environment; momentum expansion.
Composite RSI < 45: risk-off environment; momentum contraction.
Adaptive OB/OS hits: potential exhaustion or mean reversion setup.
Green Z-ribbon: all Z-scores positive and aligned (statistical confirmation).
Red Z-ribbon: all Z-scores negative and aligned (broad market weakness).
Divergences: short-term warning signals against the prevailing momentum bias.
Practical Application
Use the Composite RSI as a global momentum gauge for position bias.
Trade only in the direction of higher-timeframe alignment (avoid countertrend RSI).
Combine Z-ribbon confirmation with Composite RSI crosses to filter noise.
Use divergence labels and adaptive thresholds for risk reduction or exit timing.
Ideal for swing traders and macro momentum models seeking trend synchronization filters.
Recommended Settings
Market Mode k-Band Lookback Use Case
Stocks / ETFs Adaptive 0.85 200 Medium-term rotation filter
Crypto Adaptive 1.00 150 Volatility-responsive swing filter
Commodities Fixed 70/30 100 Mean reversion model
Alerts Included
Daily RSI crossed above/below Weekly RSI
Composite RSI > Risk-On threshold
Composite RSI < Risk-Off threshold
All RSI aligned above/below 50
Z-Score Conformity (All positive or all negative)
Overbought/Oversold triggers
Author’s Note
This indicator was designed for research and systematic confluence analysis within Mongoose Capital Labs.
It is not financial advice and should be used in combination with independent risk assessment, volume confirmation, and higher-timeframe context.

0DTE Options - Iron Condor & ButterflyTo help options traders:
Plan and structure Iron Condor or Butterfly spreads in “Setup Mode.”
Track live trades, including P&L, breach risk, and strike distances, in “Live Mode.”
Visualize the trade on the price chart with profit zones, breakeven lines, strike markers, and alerts.
Evaluate market conditions using IV Rank, ATR-based range modeling, and modeled Delta approximation.
Essentially, it turns your TradingView chart into an options risk graph + planning terminal.
⚙️ Core Modes of Operation
🧱 1. Setup Mode
Used for planning new trades. It automatically suggests strikes based on:
ATR (volatility proxy)
IV Rank
Target Delta
Chosen risk tier (High / Mid / Low / Delta)
You can:
Preview recommended short and long strikes.
See estimated credit, width, and risk/reward ratios in a setup table.
Auto-feed these calculated strikes into the Live Mode to track them later.
Example Use:
Before market open, choose Setup Mode → Mid Risk Tier → see what strike widths and credits make sense for the day.
📈 2. Live Mode
Used to track real trades you’ve already opened.
You can:
Paste your real trade data (strikes, credits, etc.) into the 📋 paste field.
Or auto-feed from Setup Mode (if “Auto-Feed” is enabled).
The indicator then plots:
Short/long strikes
Breakevens
Profit/loss zone
Real-time breach detection and delta drift
Alerts when price nears your strikes or exits your safe zone.
Example Use:
After opening an Iron Condor on SPX, paste in 626,628,620,618,1.20,1, and the chart visually shows your safe range and warning zones.
🧮 Built-In Calculations
1. IV Rank (Volatility Environment)
Uses a 20-day log return volatility model to calculate IV Rank (percentile of volatility over the last 252 bars).
You can use this automatically or manually override it if you have data from your broker.
→ High IV Rank (>50) = better for selling Iron Condors (more premium).
2. ATR (Average True Range)
Measures short-term volatility to estimate expected daily price movement.
Used in Setup Mode to model distance between strikes.
3. Strike Calculations (Setup Mode)
Based on risk tier:
High Risk → wide wings, high credit, high potential drawdown
Mid Risk → balanced setup
Low Risk → narrow wings, safer but less credit
Delta Mode → based purely on target delta (e.g., 0.20)
Uses ATR × multiplier to determine how far short strikes should be from current price.
4. Credit Estimation
Based on strike width × IV Rank multiplier:
IV > 50 → 30% of width
IV 30–50 → 25%
IV < 30 → 20%
5. Profit & Loss Modeling
The indicator computes:
Max Profit:
Iron Condor → credit × 100 × contracts
Butterfly → (wing width − debit) × 100 × contracts
Max Loss:
Iron Condor → width − credit
Butterfly → debit × 100 × contracts
Breakevens:
Iron Condor → short strikes ± credit
Butterfly → body ± debit
Current P&L: Approximated by where the underlying is relative to the short/long strikes.
6. Delta Modeling
Estimates each short strike’s modeled delta based on how far it is from current price.
Displays total delta balance to show directional bias.
If Delta drifts too high → market imbalance → consider rolling or adjusting.
7. Breach Detection System
Automatically classifies your trade as:
🟢 In Range: Price between short strikes (safe zone).
🟠 Near Breach: Price close to short strike (risk zone).
🔴 Breached: Price outside long strike (stop or adjust zone).
This dynamically changes color in your profit box and info label.
🎨 Visual Components
Element Meaning Color
Red Line Put side strikes 🔻 Red
Green Line Call side strikes 🔺 Green
Yellow Dotted Lines Breakevens 🟡 Yellow
Green Box Profit zone 🟩 Light green
Orange Box Adjustment zone (near breach) 🟧 Orange
Red Box Breach zone 🟥 Red
White Line Current price ⚪ White
Optional labels display strike details and distances (e.g., “📉 Short Put: 620 – 5 pts away”).
📊 Setup Table (Setup Mode Only)
Displays a grid comparing all risk tiers:
Tier Short Call Short Put Width Est. Credit R:R
High 632 614 4.0 $1.20 0.43
Mid 630 616 3.0 $0.90 0.43
Low 628 618 2.0 $0.60 0.43
Highlighted row = selected risk tier.
This lets you compare how wide/narrow each setup is before committing to a trade.
🧾 Info Box (Live Mode)
Displays real-time stats such as:
🔶 IRON CONDOR | 1 Contract
📊 Calls: 626 / 628 | Puts: 620 / 618
💵 Credit: $1.20 | 💰 Profit: $120 | 🔴 Loss: $180
⬆️ BE: 627.2 | ⬇️ BE: 618.8
📍 Current: $623 | 💵 P&L: +$35.00 (+29.1%)
📏 To Short Call: 3 | To Short Put: 3
📊 Delta: 0.05 | IV Rank: 56% (FAVORABLE)
🔴 BREACH STATUS: In Range
🚨 Alerts
The indicator generates TradingView alerts for:
⚠️ Approaching Call Zone → nearing short call
⚠️ Approaching Put Zone → nearing short put
🛑 Stop Loss Triggered → current P&L exceeds loss threshold
🟠 Near Breach → price entering adjustment zone
🔴 Breached → price outside protection (long strikes)
These alerts can be used with TradingView notifications or webhooks.
🧠 How to Use It Step-by-Step
A. Planning (Setup Mode)
Set mode to “Setup.”
Adjust:
Risk Tier (High / Mid / Low / Delta)
Target Delta (0.15–0.30 recommended)
Strike Interval (e.g., 1.0 or 5.0)
Check Setup Table → see suggested strikes & credits.
Optionally toggle Auto-Feed → Live to send to live mode later.
B. Executing (Broker)
Confirm and enter your trade in your brokerage (use the strikes shown).
Record your strikes, net credit/debit, and number of contracts.
C. Tracking (Live Mode)
Switch to “Live” mode.
Paste your strikes in the 📋 Paste Data field:
Iron Condor Example: 626,628,620,618,1.20,1
Butterfly Example: 600,620,640,2.50,2
The chart updates:
Lines = your strikes
Boxes = profit/risk zones
Labels = strike info, distance to price
Info box = P&L, delta, IV rank, breach status
Set alerts for automatic notifications.
D. Managing the Trade
When the chart turns orange or red, you’re approaching or breaching a strike.
Use this signal to roll, hedge, or close your trade.
Monitor Gamma Risk: warning appears when price nears short strikes (explosive delta risk).
📌 Summary
Feature Description
Mode Switching Plan (Setup) or Track (Live)
IV Rank & ATR Modeling Estimates volatility environment
Auto Strike Planning Suggests strikes based on risk/delta
Visual Range Map Profit, breakeven, and adjustment zones
Real-Time Alerts Warns when nearing or breaching strikes
Trade Info Box Displays live risk, reward, delta, IV, and P&L
Setup Table Compares setups across risk tiers
Fully Configurable Works for Iron Condors or Butterflies

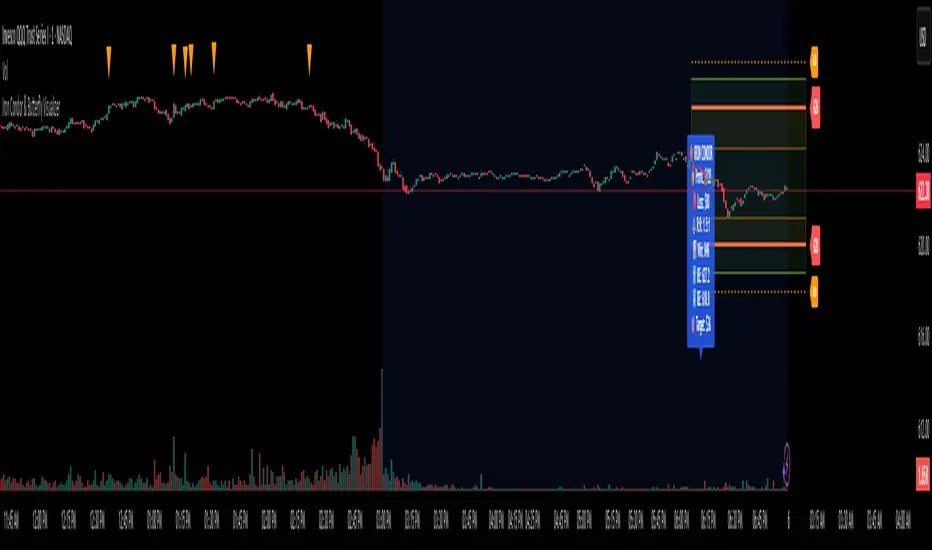
Iron Condor & Butterfly VisualizerIt helps you visualize and manage your option spread by:
Plotting strike prices and breakeven lines directly on the chart.
Showing profit/loss zones, adjustment zones, and alerts when price nears critical levels.
Calculating risk/reward, probability of profit, theta decay, IV condition, and trade score.
🎯 2. Inputs & Configuration
You input your trade details as a comma-separated string:
For an Iron Condor
ShortCall, LongCall, ShortPut, LongPut, Credit, Contracts, Target%
Example: 626,628,620,618,1.20,1,30
For a Butterfly Spread
LowerWing, Body, UpperWing, Debit, Contracts, Target%
Example: 600,620,640,2.50,2,50
The indicator automatically parses this and knows which strategy type you selected.
You can also control:
Visuals (profit zones, breakevens, labels)
Risk (stop loss %, adjustment zones)
Account/risk sizing
Market conditions (IV Rank, current IV, DTE)
⚙️ 3. Data Parsing & Strategy Recognition
The code reads your pasted string, splits it by commas, and determines:
Which strikes are short vs long (or wings/body for Butterfly)
Whether the strategy is credit (Iron Condor) or debit (Butterfly)
Calculates net credit/debit, contract size, and profit target
📈 4. Profit/Loss Calculations
It dynamically calculates:
Max Profit
Iron Condor: net credit × 100 × contracts
Butterfly: (wing width − debit) × 100 × contracts
Max Loss
Iron Condor: difference between strikes minus credit
Butterfly: debit × 100 × contracts
Breakeven points
Iron Condor: short strikes ± net credit
Butterfly: body ± debit
Current P&L relative to the live price (close).
⚖️ 5. Risk & Position Sizing
It checks:
Stop-loss trigger (% of max loss)
Adjustment alert if price nears short strikes
Recommended contract size based on account size and % risk per trade
Actual % of account at risk
⏱️ 6. Time Decay & IV Analysis
If you input days to expiration, it shows:
Theta (approx daily time decay)
Decay progress bar (% of 30-day cycle)
IV condition:
Green: favorable (>50 IV Rank)
Yellow: neutral (30–50)
Red: poor (<30)
🧮 7. Trade Scoring
It gives a Trade Score (0–100) based on:
IV Rank (favorable market)
Risk/Reward ratio
Probability of profit
Default 20 baseline points
This helps gauge whether the setup is statistically attractive.
🧠 8. Visualizations
When the indicator runs, it draws on your chart:
Lines
Red = short strikes
Orange dashed = long strikes
Yellow dotted = breakeven levels
Boxes
Green = profit zone
Orange shaded = adjustment zones (approaching danger)
Labels (optional)
Strike labels (call/put prices)
Info box summarizing:
Profit, loss, risk/reward
Breakevens, theta, target, gamma risk flag
🚨 9. Alerts
The script triggers TradingView alerts when:
Price nears call or put adjustment zones
Profit target is hit
Stop loss is hit
These help you manage the trade without constant monitoring.
🧭 10. In Practice
You’d:
Copy the option strikes and trade details from your broker or analyzer.
Paste them into 📋 PASTE YOUR TRADE DATA HERE.
The indicator plots:
Profit/loss region
Adjustment warnings
Key metrics
Alerts if your trade is in danger or near target.
TMA SWING USE HOURLY TFTma Swing use hourly is a very strong potential buy and sell signal strategy where it give buy signal when 50 ema croses 200 ema and vise versa
TMA BUY TMA buy mometum indiactor , which helps you to identify mometum traders very simple . it gfives buy signal when you price croses 50 ema .

TFX AVERAGESThis indicator created by TFX features the EMA's of 5, 10, 20, 50, 200. These indicators will show the averages of candles.

Trappp's Advanced Multi-Timeframe Trading ToolkitTrappp's Advanced Multi-Timeframe Trading Toolkit
This comprehensive trading script by Trappp provides a complete market analysis framework with multiple timeframe support and resistance levels. The indicator features:
Key Levels:
· Monthly (light blue dashed) and Weekly (gold dashed) levels for long-term context
· Previous day high/low (yellow) with range display
· Pivot-based support/resistance (pink dashed)
· Premarket levels (blue) for pre-market activity
Intraday Levels:
· 1-minute opening candle (red)
· 5-minute (white), 15-minute (green), and 30-minute (purple) session levels
· All intraday levels extend right throughout the trading day
Technical Features:
· EMA 50/200 cross detection with alert labels
· Candlestick pattern recognition near key levels
· Smart proximity detection using ATR
· Automatic daily/weekly/monthly updates
Trappp's script is designed for traders who need immediate visual reference of critical price levels across multiple timeframes, helping identify potential breakouts, reversals, and pattern-based setups with clear, color-coded visuals for quick decision-making.

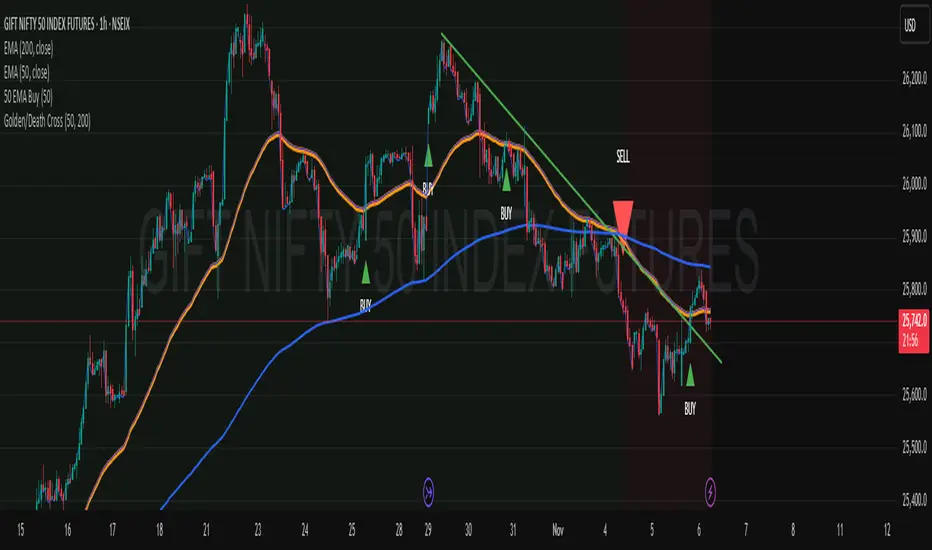
Multi SMA + Golden/Death + Heatmap + BB**Multi SMA (50/100/200) + Golden/Death + Candle Heatmap + BB**
A practical trend toolkit that blends classic 50/100/200 SMAs with clear crossover labels, special 🚀 Golden / 💀 Death Cross markers, and a readable candle heatmap based on a dynamic regression midline and volatility bands. Optional Bollinger Bands are included for context.
* See trend direction at a glance with SMAs.
* Get minimal, de-cluttered labels on important crosses (50↔100, 50↔200, 100↔200).
* Highlight big regime shifts with special Golden/Death tags.
* Read momentum and volatility with the candle heatmap.
* Add Bollinger Bands if you want classic mean-reversion context.
Designed to be lightweight, non-repainting on confirmed bars, and flexible across timeframes.
# What This Indicator Does (plain English)
* **Tracks trend** using **SMA 50/100/200** and lets you optionally compute each SMA on a higher or different timeframe (HTF-safe, no lookahead).
* **Prints labels** when SMAs cross each other (up or down). You can force signals only after bar close to avoid repaint.
* **Marks Golden/Death Crosses** (50 over/under 200) with special labels so major regime changes stand out.
* **Colors candles** with a **heatmap** built from a regression midline and volatility bands—greenish above, reddish below, with a smooth gradient.
* **Optionally shows Bollinger Bands** (basis SMA + stdev bands) and fills the area between them.
* **Includes alert conditions** for Golden and Death Cross so you can automate notifications.
---
# Settings — Simple Explanations
## Source
* **Source**: Price source used to calculate SMAs and Bollinger basis. Default: `close`.
## SMA 50
* **Show 50**: Turn the SMA(50) line on/off.
* **Length 50**: How many bars to average. Lower = faster but noisier.
* **Color 50** / **Width 50**: Visual style.
* **Timeframe 50**: Optional alternate timeframe for SMA(50). Leave empty to use the chart timeframe.
## SMA 100
* **Show 100**: Turn the SMA(100) line on/off.
* **Length 100**: Bars used for the mid-term trend.
* **Color 100** / **Width 100**: Visual style.
* **Timeframe 100**: Optional alternate timeframe for SMA(100).
## SMA 200
* **Show 200**: Turn the SMA(200) line on/off.
* **Length 200**: Bars used for the long-term trend.
* **Color 200** / **Width 200**: Visual style.
* **Timeframe 200**: Optional alternate timeframe for SMA(200).
## Signals (crossover labels)
* **Show crossover signals**: Prints triangle labels on SMA crosses (50↔100, 50↔200, 100↔200).
* **Wait for bar close (confirmed)**: If ON, signals only appear after the candle closes (reduces repaint).
* **Min bars between same-pair signals**: Minimum spacing to avoid duplicate labels from the same SMA pair too often.
* **Trend filter (buy: 50>100>200, sell: 50<100<200)**: Only show bullish labels when SMAs are stacked bullish (50 above 100 above 200), and only show bearish labels when stacked bearish.
### Label Offset
* **Offset mode**: Choose how to push labels away from price:
* **Percent**: Offset is a % of price.
* **ATR x**: Offset is ATR(14) × multiplier.
* **Percent of price (%)**: Used when mode = Percent.
* **ATR multiplier (for ‘ATR x’)**: Used when mode = ATR x.
### Label Colors
* **Bull color** / **Bear color**: Background of triangle labels.
* **Bull label text color** / **Bear label text color**: Text color inside the triangles.
## Golden / Death Cross
* **Show 🚀 Golden Cross (50↑200)**: Show a special “Golden” label when SMA50 crosses above SMA200.
* **Golden label color** / **Golden text color**: Styling for Golden label.
* **Show 💀 Death Cross (50↓200)**: Show a special “Death” label when SMA50 crosses below SMA200.
* **Death label color** / **Death text color**: Styling for Death label.
## Candle Heatmap
* **Enable heatmap candle colors**: Turns the heatmap on/off.
* **Length**: Lookback for the regression midline and volatility measure.
* **Deviation Multiplier**: Band width around the midline (bigger = wider).
* **Volatility basis**:
* **RMA Range** (smoothed high-low range)
* **Stdev** (standard deviation of close)
* **Upper/Middle/Lower color**: Gradient colors for the heatmap.
* **Heatmap transparency (0..100)**: 0 = solid, 100 = invisible.
* **Force override base candles**: Repaint base candles so heatmap stays visible even if your chart has custom coloring.
## Bollinger Bands (optional)
* **Show Bollinger Bands**: Toggle the overlay on/off.
* **Length**: Basis SMA length.
* **StdDev Multiplier**: Distance of bands from the basis in standard deviations.
* **Basis color** / **Band color**: Line colors for basis and bands.
* **Bands fill transparency**: Opacity of the fill between upper/lower bands.
---
# Features & How It Works
## 1) HTF-Safe SMAs
Each SMA can be calculated on the chart timeframe or a higher/different timeframe you choose. The script pulls HTF values **without lookahead** (non-repainting on confirmed bars).
## 2) Crossover Labels (Three Pairs)
* **50↔100**, **50↔200**, **100↔200**:
* **Triangle Up** label when the first SMA crosses **above** the second.
* **Triangle Down** label when it crosses **below**.
* Optional **Trend Filter** ensures only signals aligned with the overall stack (50>100>200 for bullish, 50<100<200 for bearish).
* **Debounce** spacing avoids repeated labels for the same pair too close together.
## 3) Golden / Death Cross Highlights
* **🚀 Golden Cross**: SMA50 crosses **above** SMA200 (often a longer-term bullish regime shift).
* **💀 Death Cross**: SMA50 crosses **below** SMA200 (often a longer-term bearish regime shift).
* Separate styling so they stand out from regular cross labels.
## 4) Candle Heatmap
* Builds a **regression midline** with **volatility bands**; colors candles by their position inside that channel.
* Smooth gradient: lower side → reddish, mid → yellowish, upper side → greenish.
* Helps you see momentum and “where price sits” relative to a dynamic channel.
## 5) Bollinger Bands (Optional)
* Classic **basis SMA** ± **StdDev** bands.
* Light visual context for mean-reversion and volatility expansion.
## 6) Alerts
* **Golden Cross**: `🚀 GOLDEN CROSS: SMA 50 crossed ABOVE SMA 200`
* **Death Cross**: `💀 DEATH CROSS: SMA 50 crossed BELOW SMA 200`
Add these to your alerts to get notified automatically.
---
# Tips & Notes
* For fewer false positives, keep **“Wait for bar close”** ON, especially on lower timeframes.
* Use the **Trend Filter** to align signals with the broader stack and cut noise.
* For HTF context, set **Timeframe 50/100/200** to higher frames (e.g., H1/H4/D) while you trade on a lower frame.
* Heatmap “Length” and “Deviation Multiplier” control smoothness and channel width—tune for your asset’s volatility.
