Session Opens - Asia, London, NY - VtrendThis script is designed to show the market session opens, for Asia, London and New York.
I couldn't find anything that fit my requirements so I decided to code one up!
You can either have symbols below, LO, AO and NYO - or background colors representing open times.. Or indeed both!
There are no alerts currently coded in, will update this one if i get enough requests.
Timeframe wise, works best under 1 hour, will not plot above that.
Also it does not plot the weekend open times.
Sessions

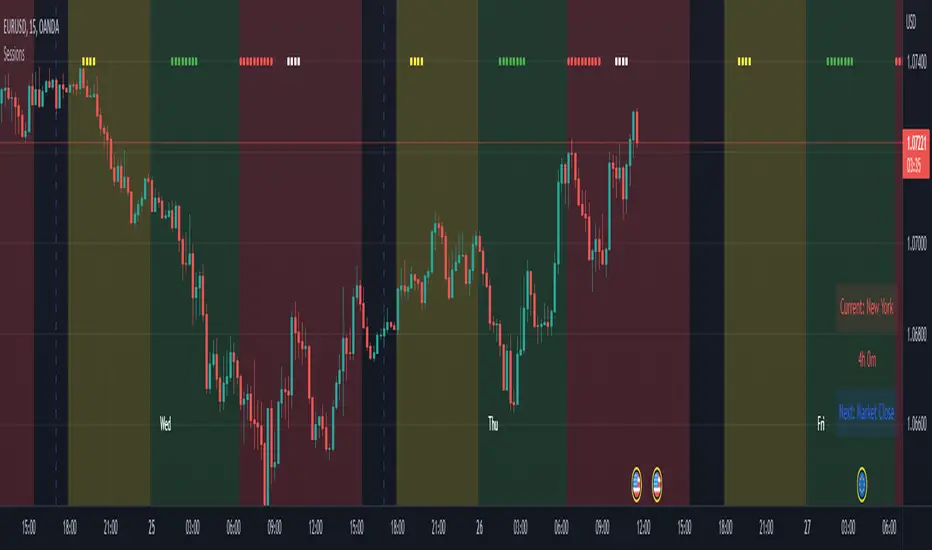
Advanced Time SessionsIntroducing Advanced Time Sessions , this tool uses a 24 hour look ahead plot - this is to help inform the trader about not just the current session but the next one coming up. Now traders, at a quick glance can see what session they trading in, how much time till the sessions close, what is the next session, and when the daily market close is! Main features of the tool include daily dividers, day labels and kill zone highlighters.
This tool is a day traders dream to have this subtle and stylish data at a glance letting you focus on more strategically placing your trades based around time and price!
EURUSD - 15m
EURUSD - 5m
Smart Money Concepts used with Advanced Time Sessions

Advanced Time SessionsIntroducing a new improved Sessions indicator, still using that 24 hour look ahead plotting, this time with a twist of eye pleasing data. Now traders at a quick glance can see what session they trading in, time till its done, and what is the next session. Including daily dividers, day labels and kill zone highlighters. This tool is a day traders dream to have this subtle and stylish data at a glance letting you focus on more strategically placing your trades based around time and price!
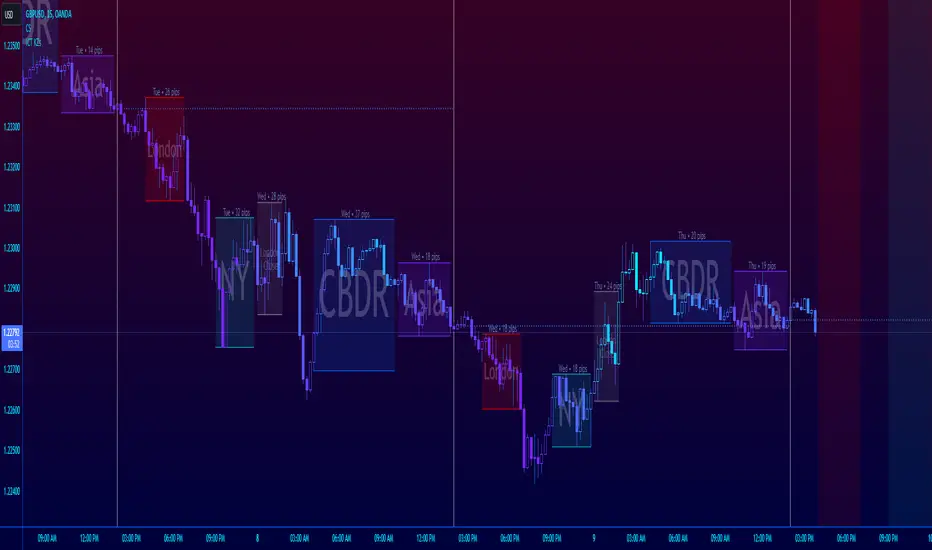
ICT Session Killzone Boxes & DeviationsICT Killzone Sessions Boxes & Deviations is a convenience indicator that marks out past and future ICT killzones for Asia, London, and New York, London Close and CBDR.
The boxes highlights the highest and lowest candle opens of that session/killzone, which is what the deviations are based on. Two lines mark out the highest high and lowest low of that session.
This indicator also includes New York midnight opening price and a vertical divider showing you that time.
Future killzones are also marked out.
All times are set to GMT-4 so these boxes should work across most exchanges. Times and code can be changed if a few don't match up.
Included are week of day labels for your convenience.
For those who are unfamiliar, ICT Killzones are optimal times to look for trades during or before a session, often providing entry for trades with orderblock tests, FVG fills or stophunts.
Please note: This indicator only works well on 1HR timeframe and below. The default max timeframe setting is set to 15min, which can be changed in the menu.
There may be some bugs so please highlight anything you find in the comments below :)
Shout out to @Ryazn for all the ideas!
CRYPTO MARKET SESSION ANALYZER INDICATORCrypto Market Session Analyzer is an easy-to-use yet powerful analysis tool that helps the trader visualize and analyze price movements over three different trading sessions:
1) European Session
2) US session
3) Asian session
Automatically tracks the corresponding levels for each market session.
This indicator can be used on all timeframes equal to or less than 15 minutes.
Although this is a simple indicator to use, some care must be taken when using it. The trader must be careful to set the correct times for each session according to his UTC timezone. By default the indicator uses UTC. If your console is set to UTC + 2 for example, you will need to take this into account and align the times correctly. You can adjust the time for each session from the user interface. Following the example, if the opening of the UE session is set to 9 and UTC of your console is set to UTC + 2, the script will proceed to create the level at opening time 11.
HOW IT WORK
The indicator automatically draws a horizontal line at the open and a horizontal line at the close of each session. The indicator clears past support and resistance every 24 hours to provide a clean and easy-to-read chart, updating new levels session after session.
Blue indicates the EU session.
Orange indicates the US session.
Purple indicates the Asian session.

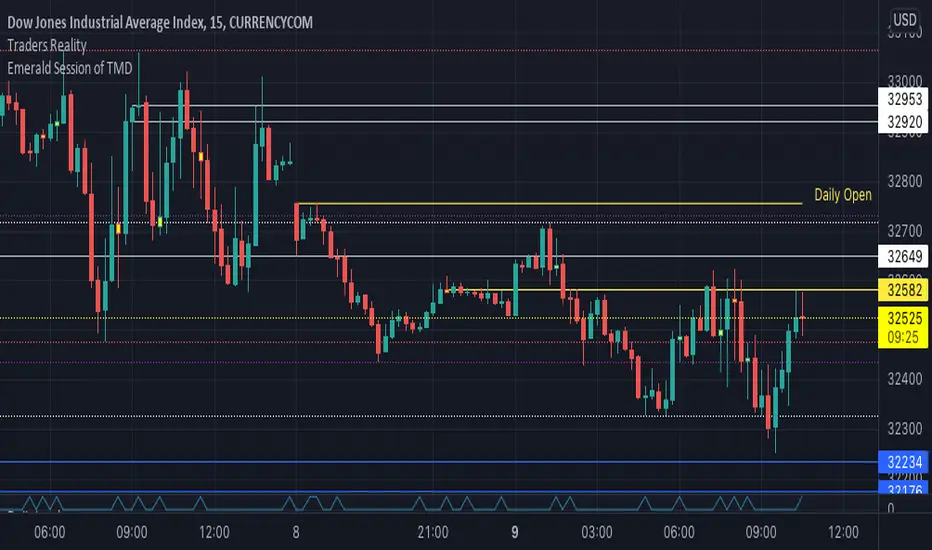
Emerald Session of TMDThis indicator is a sessions indicator that will plot the high and low of the previously closed Asia, London and New York sessions. Once the current session has closed, you will see new lines for that session be plotted for new levels to consider for the following trading period. The opening and closing of each session is a reactive spot for price action and can help you determine where manipulation is likely to occur. No matter the session you're trading, the levels from each of the other sessions is still significant and should be considered for price manipulation.
This indicator is different than others in the sense that it is simple in layout and doesn't detract with large shadows over the candles, but instead horizontal lines for those sessions. You can customize the thickness of the horizontal session line within the settings, as well as if you'd prefer to have the background present as a shadow or not.
Past sessions are visualized with one simple dot, just for reference.
Trading Sessions - SonarlabThe Trading Sessions indicator shows the most significant trading sessions for the Forex market, such as London, New York and Asian.
The sessions are presented as colored boxes on the chart, thereby clearly indicating open and close times of a particular session, as well as its trading range.
How is this Forex market session indicator used?
Traders normally use trading sessions to determine the volatile hours throughout the day, since the trading activities vary from one stock exchange to another.
London and New York market trading sessions are considered to be the most volatile, especially during the 4-hour overlap.
There are also strategies aiming only at the opening of the London session or those that allow trading only during the Asian session.
Backtesting
When testing out your strategy this Indicator can be handy to use while backtesting in Tradingviews replay mode. Only backtest the sessions you will normally trade.
Settings:
For each session:
Time beginning - end
Show session range or only beginning
Colors
Overlay type: BOX/ Background/ High - Low
Display settings statistics
ADR
Mid line (50%)
Range

Market Maker Volatility Diameter V2 by Hawkeye Charting***German Description below***
Hey guys,
we are proud to publish the Market Maker Volatility Diameter V2!
Our goal with this indicator is to provide an All-in-one indicator, combining some special tools of open source scripts as well as some of our own developments and the algorithm of our MMVD V1.
We will create a video series very soon, where we will explain each aspect of the tool, your options and of course our trading strategies with this indicator.
You have the following technical tools and information combined in this indicator, which can each be shown and hidden:
- Psychological Ranges (Weekly Opening High/ Low for Crypto and Forex)
- Market Maker Sessions (Sydney, Asia, London, NY)
- Trade Cloud (algorithm developed by Hawkeye Charting)
- Fibonacci Cloud (inspired by watching paid offerings, coded by Hawkeye Charting)
- Display Moving Averages (select the visualization of up to 6 moving averages. You can change for each of these 6 MA's the type and the length.)
- Display Major Trend Cloud (developed by Hawkeye Charting)
- PVSRA Candle Colors
- Vector Candle Zones
- Pivots
- Pivot Fibonacci Levels (developed by Hawkeye Charting)
- OHLC-Levels
- Average Daily, Weekly, Monthly Ranges
- Volume Profile for Intraday Trading for up to 8 days.
We hope especially for people, who can not afford the Pro offering from TradingView, to give access to a good indicator, which includes many tools and alerts.
Our goal is to lower the barriers for new entrants and of course to protect people, to pay for indicators, which are completely insane priced.
Only, that you get an idea: the whole indicator has only cost me about 100 h of work (for a single person!), and I'm no Pine script expert, so don't get fooled when someone offers you insane amounts for an indicator...
There is no holy grail. Each indicator works only with calculations on previous data.
We appreciate seeing that you guys like this work, so please leave a like and a follow and share this indicator.
*****German Description*****
Hey Leute,
wir sind stolz, unsere 2. Version des Market Maker Volatility Diameter zu veröffentlichen!
Unser Ziel ist es, mit diesem Indikator eine All-In-One Lösung anzubieten, welche einige nicht ganz geläufige Tools sowie unsere eigenen Entwicklungen und natürlich den Algorithmus des MMVD V1 vereinen.
Wir werden in naher Zukunft eine Video Serie veröffentlichen, in welcher wir Stück für Stück jeden Aspekt des Werkzeugs, die Einstellungsmöglichkeiten sowie unsere Trading Strategien mit diesem Indikator erklären werden.
Ihr habt die folgenden technischen Werkzeuge und Informationen in diesem Indikator vereint, welche jede einzeln an- oder abgewählt und eingestellt werden können:
- Psychological Ranges (Weekly Opening High/ Low für Krypto and Forex)
- Market Maker Sessions (Sydney, Asia, London, NY)
- Trade Cloud (Algorithmus von Hawkeye Charting entwickelt)
- Fibonacci Cloud (inspiriert von der Beobachtung eines Paid-Indikators, Code geschrieben von Hawkeye Charting)
- Moving Averages (Ihr könnt die Darstellung von bis zu 6 Gleitenden Durchschnitten auswählen und für jeden dieser Durchschnitte den Typ und die Länge ändern.)
- Display Major Trend Cloud (entwickelt von Hawkeye Charting)
- PVSRA Candle Colors
- Vector Candle Zones
- Pivots
- Pivot Fibonacci Levels (entwickelt von Hawkeye Charting)
- OHLC-Levels
- Average Daily, Weekly, Monthly Ranges
- Volume Profile für Intraday Trading, Darstellungsmöglichkeit für 3-8 Tage
Wir hoffen, dass wir speziell für Leute, die sich nicht das PRO-Abo aufwärts von TradingView leisten können, Zugang zu einem guten Indikator, welche viele Werkzeuge und Alarme vereint gewährleisten zu können.
Unser Ziel ist es, die Eintrittsbarrieren für neue Marktteilnehmer senken und natürlich Leute vor wahnsinnigen Paid-Angeboten beschützen zu können.
Nur, damit ihr eine Vorstellung bekommt: den gesamten Indikator hat mich lediglich 100h Arbeit gekostet (für eine einzelne Person!), und ich bin kein Pine Script Experte. Also lasst euch bitte nicht verar******, wenn euch Paid-Angebote erreichen, mit dem Versprechen, den "zu 95% erfolgreich" Indikator erwerben zu können.
Es gibt keinen heiligen Gral, jeder Indikator arbeitet nur mit Berechnung von Vergangenheitswerten.
Wir würden uns riesig freuen, wenn euch diese Arbeit gefällt und ihr uns Likes und Follows hinterlasst und ihr diesen Indikator teilt.

All Forex Sessions in One Script OnlyDraws all Forex Sessions:
*it works only with forex*
These Sessions can show Daily Highs and Lows:
- Pre-London / London
- Pre-New York / New York
It's possible to hide Highs and Lows having full background for these sessions
Daily Session Breaks
- Mondays use a different color
- Asian Boxes every day
- All Sessions Ranges/Colors are editable
-All elements (pre-London/London/Pre-New York/New York/Asian Boxes/Session Breaks) can be switched off independently

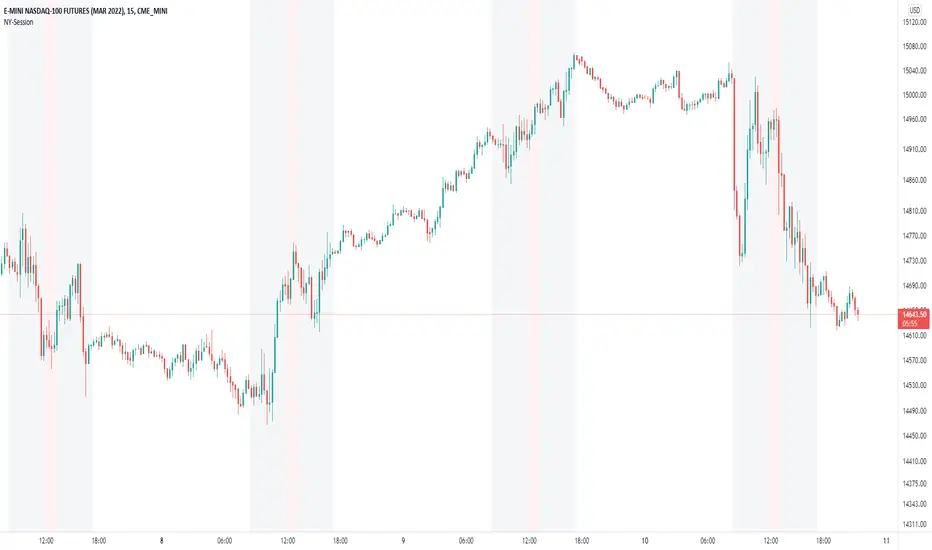
Session Bar CountingIf you follow Al Brooks - he has a bar counting overlay from the start of the session.
The timing is set to Trading View - EXCHANGE TIME - so customise the start of the session you like.
Enjoy!

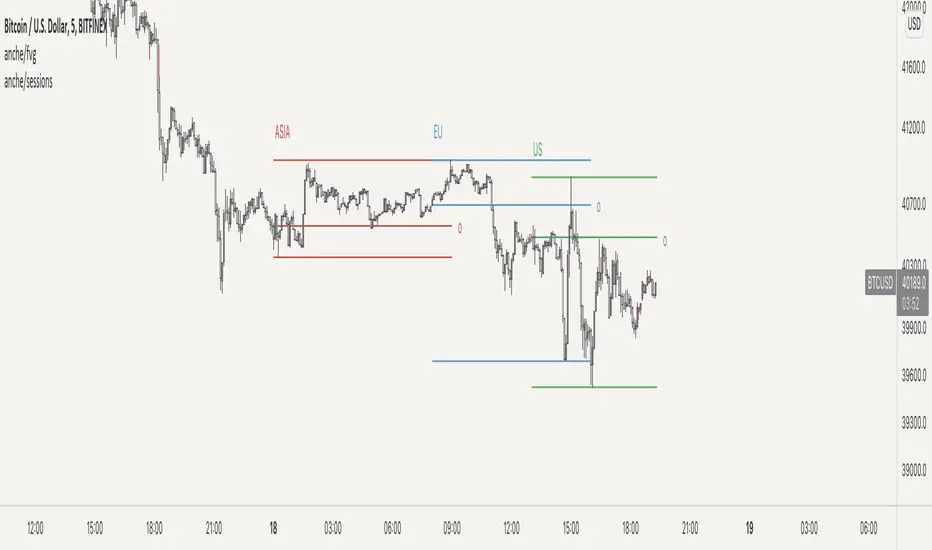
Market Sessions (including extended hours) by Anche█ MARKET SESSIONS BY ANCHE
this script allows you to define up to 4 different sessions and plot those on your chart. It makes it easy to see when these sessions started and ended and what the price level is when the session opened. It's for example beneficial to see when sessions overlap, because at those times there might be more volume , because more people are active within a market.
█ CONCEPTS
• plotting these sessions onto a chart can help you see overlap of 2 or more sessions. An overlap means more market participants, which can hint to an increase in volume .
• when the indicator shows all historic sessions, you can spot certain trends, for example that an asian market is generally more bearish and EU more bullish , or vice versa.
█ FEATURES
• up to 4 sessions
• customisable session labels
• customisable session times
• extended hours (on/off)
• timezone sync
• show past sessions
█ VISUAL FEATURES
• session plotted by top + bottom line or a box
• show session open
• customisable colors per session
• customisable lines (width/style/color)
• different visual settings for extended hours
• customisable label sizes
AltSessionHello World
It’s no secret that trading sessions play a massive role in market movement and liquidity. We can clearly see in the image about how important identifying international trading hours are for a trader.
The Asian session starts around 1am GMT and often has a bearish bias through this session lasting for a few hours, after which Frankfurt and London traders start to come online and can often reverse the Asian sentiment.
The London session is the best session to trade traditionally starting around 7am GMT before the American traders come online and reverse market once again.
We have designed this indicator to help identify different trading hours easily with a background shade on the chart and also high/lows of the training session, as these levels can often be revisited.
We hope you find this indicator useful and please feel free to drop a comment if you have any updates you wish to be made or any future indicator script ideas, thank you.

[DisDev] 12 Candle|Round#|Future SessionsThis indicator has many components; below, each component is explained and how it can be used as a trading tool.
1) Future Lines
a. Vertical lines are projected into the future to mark the beginning of each of the three major markets, Tokyo, London, and New York.
b. When major markets open, this can cause an increase in price action. So this component provides the trader with a reminder of when the next major market opens.
c. Also, the days of the week are displayed to allow the user to backtest price reaction for certain days of the week easily (e.g., Major Markets reopening after the weekend).
2) 12 Hour Candle Sessions High and Low
a. As price intersects with the beginning of the session, the vertical line disappears, and two corresponding horizontal lines begin. These horizontal lines dynamically adjust to mark each session's high and low, and a semi-transparent box fills the space between the high and low lines.
b. The duration of each session is a three-hour window, which each consists of 12 Fifteen-Minute Candles. This marks the hour prior to equity markets open, the opening hour, and the post-open hour.
c. The sessions highs and lows can be selected within the settings show for a 24 hour period. This assists the trader with session range breakouts; three examples of how this could be traded are below.
Example 1
d. The Tokyo and London session high kept the price action within a range. Once it broke the range, the Tokyo and London session highs were used as support, resulting in a range breakout.
Example 2
e. The below picture shows price action failing to break London Session Low and New York Session High; this is followed by Tokyo Low acting as resistance and price moving down 9%.
Example 3
f. Below price action with an increased volume of 323% (based on the average of the last 10 bar) fails to break the Tokyo High on the 1st attempt. The second attempt fails on 241% volume. The third attempt at 475% breaks the range, completing the range breakout seeing a move of 3.4% in price.
4) High of Day (HOD) and Low of Day (LOD)
a. As the trading day unfolds, we mark the HOD (d-High) and LOD (d-Low) with blue dotted horizontal lines. Then at the start of the next trading day, the former High and Low become the Previous Day High (pd-High) and Low (pd-Low) and are changed to dashes.
b. These high and low levels add extra confluence with the session high and lows for Swing Failure Patterns (SFP) and confirmation of trends.
5) Round Numbers
a. As humans, it's hard to use just any number to make sense of things. We prefer to use round numbers. This is important for trading as many traders will automatically use round numbers as their stop losses.
b. This indicator component reminds users of this fact and displays round numbers such as 00, 25, 50, and 75. The indicator automatically calculates and displays lines for the round numbers for as many as twelve levels above and below the current price.
c. Below are examples of how round numbers are broken to trigger stop losses; you may want to break the habit of using round numbers as your stop losses.
Below is the indicator in full swing, displaying all the elements described above.

Sessions with High/Low DiffThe main purpose of this indicator is to facilitate backtesting, but it may also be useful for traders to easily identify the current
active/open trading sessions on lower-timeframe charts.
This indicator also tracks the session high/low difference and plots it as a label on the last candle of the session once the last
bar of that session has finished printing and a new candle opened. The position and direction of the label is based on the
session open and close - if the session open is greater than the session close (which would equate to the equivalent of a red candle),
the label will be printed UNDER the last candle, and vice versa if the session close is above the session open.
The number printed inside the label is the difference between the session high and the session low, scaled to the minimum tick value of the chart.
Note #1: There is a Pinescript maximum of 500 labels allowed on any chart. While I could have gotten fancy and done some wizardry with label arrays,
I didn't really see a point to it. If labels are enabled for all 4 sessions at the same time, that would still have them available for the past 125
sessions, which would be about 6 months (approx 252 trading days per year, and this would cover 125 of them). If you limit to 2 sessions, you double
your potential look-back to almost a year (250 days out of the 252 average trading days each year), and for a single session, you double it yet again
to just under 2 years.
Note #2: As this indicator tracks open, high, low, and close for each session, it can potentially be enhanced (or forked) to construct "session candles".
I'm not sure what use this would be to anyone, but the pieces are there should someone find a use for it.
While it would be easy to add alerts on sessions opening/closing, I didn't see a purpose or value in that as it would be little more than a
glorified alarm clock. If I get enough demand to add them, I will gladly consider it.

DTFL FOREX OverlayThese tools are used by FOREX traders who primarily follow the DTFL trading strategy, however, they can easily be utilized by any other FOREX trader looking for an all-in-one indicator that includes sessions, previous high/lows, session values, various moving averages and lockable ADR/ATR lines.

MILK (My Intraday Lazy Kit)I made this script to group information considered useful in forex day trading, of course it can be used on crypto or other markets.
First of all, feel free to suggest any improvement/new feature you would consider interesting for such an use. This is not especially a final version and I'm sure other relevant information can be added in this tool.
Current features are the following
An international clock showing time and session status (open/closed) for 5 different cities. You can modify it in parameters.
Drawings of previous days/weeks open/high/low/close prices, which will be often used as supports and resistances zones.
The Clock shows
City
Time (with a bgcolor corresponding to the "period" of the day (Morning, Afternoon, Evening, Night)
Session status (Cyan when the corresponding session is open, blue when it's closed)
Price levels names are
YTD-H : Yesterday's high
YTD-L : Yesterday's low
YTD-C : Yesterday's close
YTD-O : Yesterday's open
PWH : Previous week high
PWL : Previous week low
PWO : Previous week open
PWC : Previous week close
Levels width and colors can be modified.
You can also enable/disable the clock, and daily or weekly levels in the options panel.
Nothing more to say for now, I mainly integrated information I like to have, but I'll probably add new features in it if I get some.

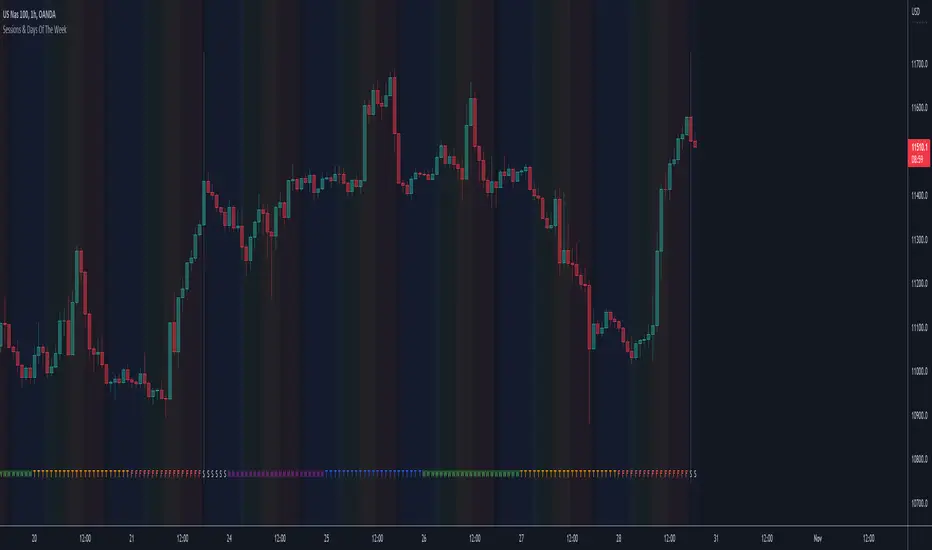
Sessions & Days Of The WeekTraders tend to focus their energy on specific sessions or time periods. This indicator will plot the days of the week, and also highlight the following sessions: Frankfurt (2:00am - 11:00am EST), London (3:00am - 12:00pm EST), New York (8:00am - 5:00pm EST), Sydney (5:00pm - 2:00am EST), Tokyo (7:00pm - 4:00am EST).
It’s important to be aware that Session Open and Close times will vary based on the time of year, as countries shift over to daylight savings time.
Market Sessions Open/Close LevelsThis indicator displays the market open and close price levels for the main trading sessions (Sydney, Tokyo, Frankfurt, London and New York). The Daily Line changes color depending on if price is trading above or below the level. Feel free to add or replace levels depending on your trading style and trading times.

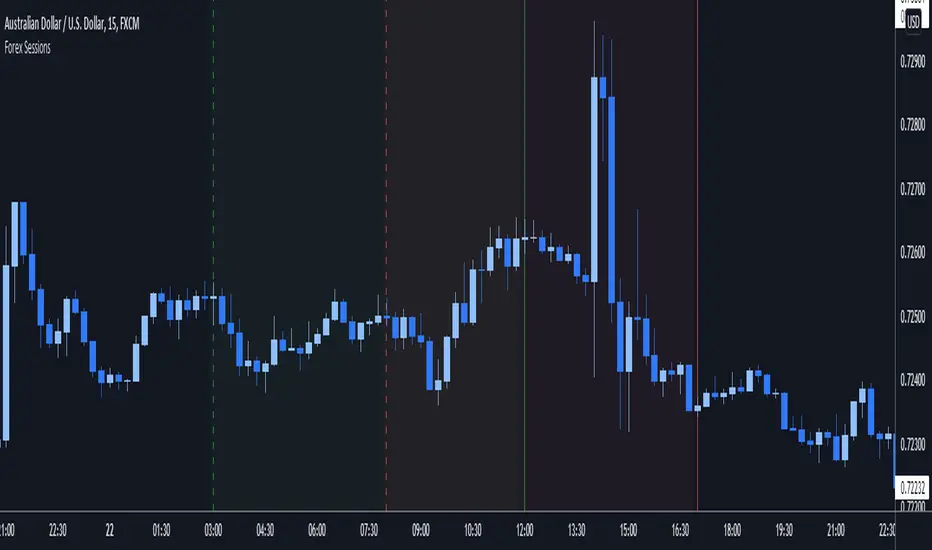
Forex Trading SessionsThere are a million Forex Trading Session indicators out there, but I couldn't find one with all of the following requirements:
1. Automatically show the Sessions that actually affect the current pair (for instance, Tokyo session doesn't matter when trading EURGBP)
2. Editable colors or at the very least no distracting colors
3. Editable times for each exchange session
4. Unique indication of the start of a session vs the end of a session. (Sometimes, I don't notice a background going from Navy Blue to Black)
This indicator has everything I could ever want in a Sessions Tool:
Subdued default colors
Editable colors
Editable session ranges
Obvious, but not obnoxious indication of start and stop
Automatically hide irrelevant Sessions
Cheers. EFX
Forex sessions with daylight savingsThis will adjust with Daylight Savings (DS) however you will need to update the start and end dates of DS once each year. That said, it's valid for 2021 and I'll try to remember to update this script each year so people don't have up to do the update of the DL start and end dates.
If there is a way to know these dates automatically in pine script someone please let me know.
Notice that Sydney has an offset of -1 instead of 1 for DS since being on the other side of the planet (sorry flat Earthers but this is a side-effect of a globe) they need to put their clocks backwards for DS instead of forwards.
Features:
Shows sessions for: Frankfurt, London, New York, Sydney & Tokyo
Includes Daylight savings changes
Has a legend you can display and hide to see which colors are for which sessions around the world
Allows you to show or hide each session individually
Allows you to display the legend in the same opacity as the indicators or 0 opacity to make it more readable.
This is my first public script so feedback most welcomed.

Next Session OpenThis script simply displays the next market open time with a vertical line.
Market open may be subject to special treatment as a trader (higher volatility, different move aspects, etc)
To make it possible to adjust to your trading style, this script allows you to configure:
Session open hours in UTC
Vertical line colors
Enable or disable lines
The line style
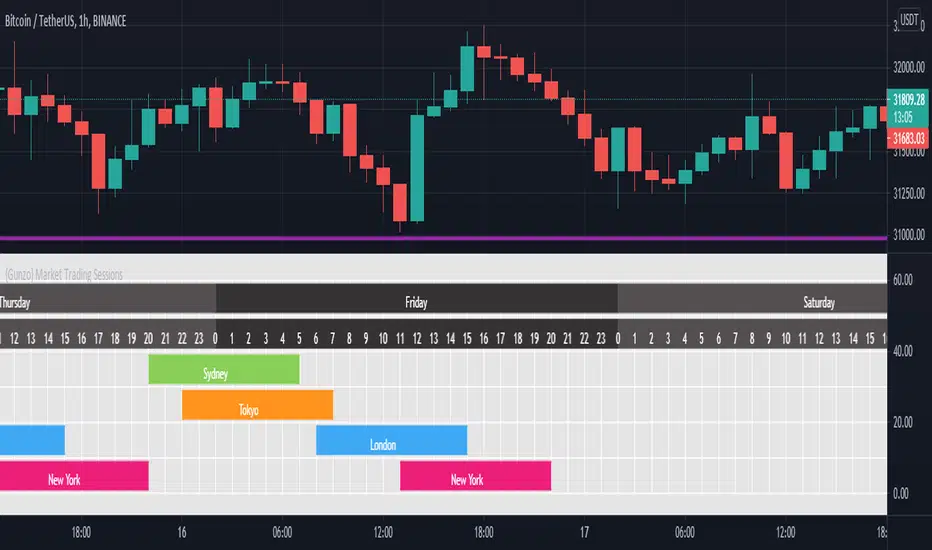
{Gunzo} Market Trading Sessions (Tokyo, London, New York)Market Trading Sessions is a tool designed to help traders to find the best times of the day for price action trading. It displays non-overlapping visuals for the major trading sessions : Oceania, Asia, Europe, and USA.
OVERVIEW :
This tool has been designed to match all the following requirements that I needed for optimal usage :
Display opening and closing of main markets
See clearly market sessions (non-overlapping colors)
Display Sydney session if wanted
Display GMT hours and days
Visually pleasing design and colors
Highly configurable
As I had trouble finding a script matching all these criteria, I created this tool and I'm sharing it with the TradingView community, hoping you will find it useful too.
SETTINGS :
Display market sessions on weekends : Display theoretical market sessions times on the weekend which can be useful for non forex markets.
Display session for Oceania\Sydney : Display "Oceania\Sydney" trading session
Display session for Asia\Tokyo : Display "Asia\Tokyo" trading session
Display session for Europe\London : Display "Europe\London" trading session
Display session for USA\New York : Display "USA\New York" trading session
Display session names : Display names of the session on the visual
Oceania color : Configurable color for the "Oceania\Sydney" sessions
Asia color : Configurable color for the "Asia\Tokyo" sessions
Europe color : Configurable color for the "Europe\London" sessions
USA color : Configurable color for the "USA\New York" sessions
Background color : Configurable color for the table background
Border color : Configurable color for the table borders
Text color : Configurable color for the table text
Header color : Configurable color for the table header (even days)
Header color (alternate) : Configurable color for the table header (odd days)