8 Separate Moving AveragesCOINBASE:BTCUSD Combine all your moving averages into one indicator.
This indicator allows for 8 separate moving averages, which can individually be configured as simple or exponential to any lengths you wish.
Allowing you to make room for other indicators.
Since is just moving averages, it can be used in any market.
Find me on twitter. Handle @Samih .
Moyenne mobile simple (SMA)

5 lines_Moving Average EMA/SMA 5本の移動平均線It is all in one. You can use 5 moving average lines with this one indicator only.
The way is easy. Just add this one indicator. Continue to enter your favorite periods in the setting.
If there is unnecessary lines, just remove the check boxes.
オールインワンです。
この1つのインジケーターを追加するだけで 5つの移動平均線 が使えます。
追加したら、設定から好きな期間を入力してください。不要な線があれば、チェックを外すだけです。
無料プランの人は移動平均線を3本追加するだけで、制限いっぱいになってしまいます。
これを使えば、最大5本分の移動平均線を引くことができます。
もっとたくさん線を引きたい方はご相談ください。
増やします(笑)

High Timeframe SMA & EMAThis indicator adds daily and weekly SMA & EMA to whatever your current timeframe is.

SMA/pivot/Bollinger/MACD/RSI en pantalla gráficoMulti-indicador con los indicadores que empleo más pero sin añadir ventanas abajo.
Contiene:
Cruce de 3 medias móviles
La idea es no tenerlas en pantalla, pero están dibujadas también. Yo las dejo ocultas salvo que las quiera mirar para algo.
Lo que presento en pantalla es la media lenta con verde si el cruce de las 3 marca alcista, amarillo si no está claro y rojo si marca bajista.
Pivot
Normalmente los tengo ocultos pero los muestro cuando me interesa. Están todos aunque aparezcan 2 seguidos.
Bandas de Bollinger
No dibujo la línea central porque empleo la media como tal.
Parabollic SAR
Lo empleo para dibujar las ondas de Elliott como postula Matías Menéndez Larre en el capítulo 11 de su libro "Las ondas de Elliott". Así que, aunque se puede mostrar, lo mantengo oculto y lo que muestro es dónde cambia (SAR cambio).
MACD
No está dibujado porque necesitaría sacarlo del gráfico.
Marco en la parte superior cuándo la señal sobrepasa al MACD hacia arriba o hacia abajo con un flecha indicando el sentido de esta señal.
RSI
Similar al MACD pero en la parte inferior.
Probablemente, programe otro indicador para visualizar en una ventanita MACD, RSI y volumen todo junto. El volumen en la principal hay veces que no te permite ver bien alguna sombra y los otros 2 te quitan mucho espacio para graficar si los tienes permanentemente en 2 ventanas separadas.
Zero Phase Filtering [Repaint] - ExperimentalImportant !
The indicator is for experimental purpose only, it must not be used as a decisional tool but only as a visual one (like Zig-Zag, Fractal etc). The information this indicator display is uncertain and subject to drastic changes over time. If you have further question feel free to pm me.
Introduction
Most of the filters you will find are causal, this mean that they depend on present and past input values, this explain the lag they produce. Non causal filters however will use future input values. A well know way to get a zero-phase filter is by using the forward backward method, but this is not possible in pinescript as i recall. So we have to use some kind of function that will display future values, this is possible using the security function in version 2 or the one in version 3 using barmerge.lookahead_on .
The Use Of A Repainting Indicator
Its always better to filter data in order to have a clearer view of what is happening, this can be useful when doing some forecasting or doing less formal kind of analysis. However since it repaint you cant use it as a signal provider or use signals of other indicators using this filter as source.
For example if you want to forecast a smooth indicator, the forecast of this indicator under normal circumstances could still have lag associated with it, so you would have to react before your forecast, this wont happen if you apply this filter as your indicator source.
The Filter
We smooth with a simple moving average the price provided by the security function twice, length control the smoothing level. Since security depend on the time frame you are in you must select your time frame in the indicator parameter selection window.
Filtering using 45 minutes time frame close price in a 5 minutes chart, we fix this by selecting our time frame.
Consider the fact that the input of the indicator is just periodic price, so sometimes the lag can sometimes be less or more than 0 and the estimation not centered.
The indicator can work on time frames up to 1h, after that the filter have some lag, i tried fixing this and i ended up having data errors.
Applying our filter as source for the rsi oscillator.
Conclusion
It is possible to have a kind of zero-phase filters, but it would be better if pinescript could support backward indexing thus making us able to do forward backward filtering.
Since noise can affect our analysis, applying smoothing without having to use offset in plot can be considered useful.

CryptoSimmons SMA and TrendThis was made trying to match the indicator Kazonomics uses on his charts.
I think it comes pretty close.
I made it by combining AK Trend indicator and Madrid Moving Average indicator.
RSI + SMAx3Ceci est un script assez simple, un RSI comme celui qui est intégré mais avec la possibilité de tracer 3 droites de plus permettant ainsi de soulager certains chartiste qui pourrant régler la position de ces droites (horizontales) avec une parfaite précision.
S'ajoute à celà 3 moyennes mobiles arithmétique intégrées à l'indicateur RSI.
__________________________________________
This is a pretty simple script, with three lines to help relieve some chartists that make it possible to position these (horizontal) positions with perfect precision.
Add to this 3 arithmetic moving averages integrated in the RSI indicator.
__________________________________________
Este es un script bastante simple, un RSI como el que está integrado pero con la posibilidad de dibujar 3 líneas más, lo que permite liberar a algunos chartistas que pueden ajustar la posición de estas líneas (horizontal) con una precisión perfecta.
Agregue a esto 3 promedios móviles aritméticos integrados en el indicador RSI.
__________________________________________
Dies ist ein ziemlich einfaches Skript, ein RSI wie der, der integriert ist, aber mit der Möglichkeit, 3 weitere Linien zu zeichnen, wodurch einige Chartisten entlastet werden können, die die Position dieser Linien (horizontal) mit einer perfekten Genauigkeit einstellen können.
Hinzu kommen 3 in den RSI-Indikator integrierte arithmetische gleitende Durchschnitte.

Multi SMA EMA WMA HMA BB (5x8 MAs Bollinger Bands) MAX MTF - RRBMulti SMA EMA WMA HMA 4x7 Moving Averages with Bollinger Bands MAX MTF by RagingRocketBull 2019
Version 1.0
All available MAX MTF versions are listed below (They are very similar and I don't want to publish them as separate indicators):
ver 1.0: 4x7 = 28 MTF MAs + 28 Levels + 3 BB = 59 < 64
ver 2.0: 5x6 = 30 MTF MAs + 30 Levels + 3 BB = 63 < 64
ver 3.0: 3x10 = 30 MTF MAs + 30 Levels + 3 BB = 63 < 64
ver 4.0: 5(4+1)x8 = 8 CurTF MAs + 32 MTF MAs + 20 Levels + 3 BB = 63 < 64
ver 5.0: 6(5+1)x6 = 6 CurTF MAs + 30 MTF MAs + 24 Levels + 3 BB = 63 < 64
ver 6.0: 4(3+1)x10 = 10 CurTF MAs + 30 MTF MAs + 20 Levels + 3 BB = 63 < 64
Fib numbers: 8, 13, 21, 34, 55, 89, 144, 233, 377
This indicator shows multiple MAs of any type SMA EMA WMA HMA etc with BB and MTF support, can show MAs as dynamically moving levels.
There are 4 MA groups + 1 BB group, a total of 4 TFs * 7 MAs = 28 MAs. You can assign any type/timeframe combo to a group, for example:
- EMAs 9,12,26,50,100,200,400 x H1, H4, D1, W1 (4 TFs x 7 MAs x 1 type)
- EMAs 8,13,21,30,34,50,55,89,100,144,200,233,377,400 x M15, H1 (2 TFs x 14 MAs x 1 type)
- D1 EMAs and SMAs 8,13,21,30,34,50,55,89,100,144,200,233,377,400 (1 TF x 14 MAs x 2 types)
- H1 WMAs 13,21,34,55,89,144,233; H4 HMAs 9,12,26,50,100,200,400; D1 EMAs 12,26,89,144,169,233,377; W1 SMAs 9,12,26,50,100,200,400 (4 TFs x 7 MAs x 4 types)
- +1 extra MA type/timeframe for BB
There are several versions: Simple, MTF, Pro MTF, Advanced MTF, MAX MTF and Ultimate MTF. This is the MAX MTF version. The Differences are listed below. All versions have BB
- Simple: you have 2 groups of MAs that can be assigned any type (5+5)
- MTF: +2 custom Timeframes for each group (2x5 MTF) +1 TF for BB, TF XY smoothing
- Pro MTF: 4 custom Timeframes for each group (4x3 MTF), 1 TF for BB, MA levels and show max bars back options
- Advanced MTF: +4 extra MAs/group (4x7 MTF), custom Ticker/Symbols, Timeframe <>= filter, Remove Duplicates Option
- MAX MTF: +2 subtypes/group, packed to the limit with max possible MAs/TFs: 4x7, 5x6, 3x10, 4(3+1)x10, 5(4+1)x8, 6(5+1)x6
- Ultimate MTF: +individual settings for each MA, custom Ticker/Symbols
MAX MTF version tests the limits of Pinescript trying to squeeze as many MAs/TFs as possible into a single indicator.
It's basically a maxed out Advanced version with subtypes allowing for mixed types within a group (i.e. both emas and smas in a single group/TF)
Pinescript has the following limits:
- max 40 security calls (6 calls are reserved for dupe checks and smoothing, 2 are used for BB, so only 32 calls are available)
- max 64 plot outputs (BB uses 3 outputs, so only 61 plot outputs are available)
- max 50000 (50kb) size of the compiled code
Based on those limits, you can only have the following MAs/TFs combos in a single script:
1. 4x7, 5x6, 3x10 - total number of MTF MAs must always be <= 32, and you can still have BB and Num Levels = total MAs, without any compromises
2. 5(4+1)x8, 6(5+1)x6, 4(3+1)x10 - you can use the Current Symbol/Timeframe as an extra (+1) fixed TF with the same number of MTF MAs
- you don't need to call security to display MAs on the Current Symbol/Timeframe, so the total number of MTF MAs remains the same and is still <= 32
- to fit that many MAs into the max 64 plot outputs limit you need to reduce the number of levels (not every MA Group will have corresponding levels)
Features:
- 4x7 = 28 MAs of any type
- 4x MTF groups with XY step line smoothing
- +1 extra TF/type for BB MAs
- 2 MA subtypes within each group/TF
- 4x7 = 28 MA levels with adjustable group offsets, indents and shift
- supports any existing type of MA: SMA, EMA, WMA, Hull Moving Average (HMA)
- custom tickers/symbols for each group
- show max bars back option
- show/hide both groups of MAs/levels/BB and individual MAs
- timeframe filter: show only MAs/Levels with TFs <>= Current TF
- hide MAs/Levels with duplicate TFs
- support for custom TFs that are not available in free accounts: 2D, 3D etc
- support for timeframes in H: H, 2H, 4H etc
Notes:
- Uses timeframe textbox instead of input resolution dropdown to allow for 240 120 and other custom TFs
- Uses symbol textbox instead of input symbol to avoid establishing multiple dummy security connections to the current ticker - otherwise empty symbols will prevent script from running
- Possible reasons for missing MAs on a chart:
- there may not be enough bars in history to start plotting it. For example, W1 EMA200 needs at least 200 bars on a weekly chart.
- for charts with low/fractional prices i.e. 0.00002 << 0.001 (default Y smoothing step) decrease Y smoothing as needed (set Y = 0.0000001) or disable it completely (set X,Y to 0,0)
- for charts with high price values i.e. 20000 >> 0.001 increase Y smoothing as needed (set Y = 10-20). Higher values exceeding MAs point density will cause it to disappear as there will be no points to plot. Different TFs may require diff adjustments
- TradingView Replay Mode UI and Pinescript security calls are limited to TFs >= D (D,2D,W,MN...) for free accounts
- attempting to plot any TF < D1 in Replay Mode will only result in straight lines, but all TFs will work properly in history and real-time modes. This is not a bug.
- Max Bars Back (num_bars) is limited to 5000 for free accounts (10000 for paid), will show error when exceeded. To plot on all available history set to 0 (default)
- Slow load/redraw times. This indicator becomes slower, its UI less responsive when:
- Pinescript Node.js graphics library is too slow and inefficient at plotting bars/objects in a browser window. Code optimization doesn't help much - the graphics engine is the main reason for general slowness.
- the chart has a long history (10000+ bars) in a browser's cache (you have scrolled back a couple of screens in a max zoom mode).
- Reload the page/Load a fresh chart and then apply the indicator or
- Switch to another Timeframe (old TF history will still remain in cache and that TF will be slow)
- in max possible zoom mode around 4500 bars can fit on 1 screen - this also slows down responsiveness. Reset Zoom level
- initial load and redraw times after a param change in UI also depend on TF. For example: D1/W1 - 2 sec, H1/H4 - 5-6 sec, M30 - 10 sec, M15/M5 - 4 sec, M1 - 5 sec. M30 usually has the longest history (up to 16000 bars) and W1 - the shortest (1000 bars).
- when indicator uses more MAs (plots) and timeframes it will redraw slower. Seems that up to 5 Timeframes is acceptable, but 6+ Timeframes can become very slow.
- show_last=last_bars plot limit doesn't affect load/redraw times, so it was removed from MA plot
- Max Bars Back (num_bars) default/custom set UI value doesn't seem to affect load/redraw times
- In max zoom mode all dynamic levels disappear (they behave like text)
- Dupe check includes symbol: symbol, tf, both subtypes - all must match for a duplicate group
- For the dupe check to work correctly a custom symbol must always include an exchange prefix. BB is not checked for dupes
Good Luck! Feel free to learn from/reuse the code to build your own indicators.

Moving Average 300 by WM - Bitcoin reversal key ?Bonjour à tous, c'est un grand plaisir que nous ajoutons le MA 300 à votre boîte à outils ce qui à mon avis pourrait constituer un support essentiel pour la tendance BTC dans un proche avenir. Nous pensons qu'il serait possible que le Bitcoin puisse mettre un terme à la tendance baissière en l'effleurant :-) Historiquement le Bitcoin n'a jamais descendu sous la barre du MA 200. Je vous souhaite de connaître beaucoup de succès lors de vos prochaines transactions et n'oubliez pas la tendance est votre amis!! Crypto Mercy xx
WM
We are movement

Volume, Relative Volume HighlightThe indicator plots regular volume bars.
The highlight is given by the current cumulative volume for the day, compared to a custom average (standard 20 periods). The stronger the color, the higher the relative volume is. Stocks moving of higher relative volume have higher chances of making predictable moves.


Triple Moving Averages & BBTriple SMAs (default 50 100 200) that turn green when trending up and red when trending down.
Includes standard bollinger bands which can be turned off.
Combines these 4 indicators into just 1.

Multi SMA EMA WMA HMA BB (4x5 MAs Bollinger Bands) Adv MTF - RRBMulti SMA EMA WMA HMA 4x5 Moving Averages with Bollinger Bands Advanced MTF by RagingRocketBull 2019
Version 1.0
This indicator shows multiple MAs of any type SMA EMA WMA HMA etc with BB and MTF support, can show MAs as dynamically moving levels.
There are 4 MA groups + 1 BB group, a total of 4 TFs * 5 MAs = 20 MAs. You can assign any type/timeframe combo to a group, for example:
- EMAs 12,26,50,100,200 x H1, H4, D1, W1 (4 TFs x 5 MAs x 1 type)
- EMAs 8,10,13,21,30,50,55,100,200,400 x M15, H1 (2 TFs x 10 MAs x 1 type)
- D1 EMAs and SMAs 8,10,12,26,30,50,55,100,200,400 (1 TF x 10 MAs x 2 types)
- H1 WMAs 7,77,89,167,231; H4 HMAs 12,26,50,100,200; D1 EMAs 89,144,169,233,377; W1 SMAs 12,26,50,100,200 (4 TFs x 5 MAs x 4 types)
- +1 extra MA type/timeframe for BB
There are several versions: Simple, MTF, Pro MTF, Advanced MTF and Ultimate MTF. This is the Advanced MTF version. The Differences are listed below. All versions have BB
- Simple: you have 2 groups of MAs that can be assigned any type (5+5)
- MTF: +2 custom Timeframes for each group (2x5 MTF) +1 TF for BB, TF XY smoothing
- Pro MTF: 4 custom Timeframes for each group (4x3 MTF), 1 TF for BB, MA levels and show max bars back options
- Advanced MTF: +2 extra MAs/group (4x5 MTF), custom Ticker/Symbols, Timeframe <>= filter, Remove Duplicates Option
- Ultimate MTF: +individual settings for each MA, custom Ticker/Symbols
Features:
- 4x5 = 20 MAs of any type
- 4x MTF groups with XY step line smoothing
- +1 extra TF/type for BB MAs
- 4x5 = 20 MA levels with adjustable group offsets, indents and shift
- supports any existing type of MA: SMA, EMA, WMA, Hull Moving Average (HMA)
- custom tickers/symbols for each group - you can compare MAs of the same symbol across exchanges
- show max bars back option
- show/hide both groups of MAs/levels/BB and individual MAs
- timeframe filter: show only MAs/Levels with TFs <>= Current TF
- hide MAs/Levels with duplicate TFs
- support for custom TFs that are not available in free accounts: 2D, 3D etc
- support for timeframes in H: H, 2H, 4H etc
Notes:
- Uses timeframe textbox instead of input resolution dropdown to allow for 240 120 and other custom TFs
- Uses symbol textbox instead of input symbol to avoid establishing multiple dummy security connections to the current ticker - otherwise empty symbols will prevent script from running
- Possible reasons for missing MAs on a chart:
- there may not be enough bars in history to start plotting it. For example, W1 EMA200 needs at least 200 bars on a weekly chart.
- price << default Y smoothing step 5. For charts with low/fractional prices (i.e. 0.00002 << 5) adjust X Y smoothing as needed (set Y = 0.0000001) or disable it completely (set X,Y to 0,0)
- TradingView Replay Mode UI and Pinescript security calls are limited to TFs >= D (D,2D,W,MN...) for free accounts
- attempting to plot any TF < D1 in Replay Mode will only result in straight lines, but all TFs will work properly in history and real-time modes. This is not a bug.
- Max Bars Back (num_bars) is limited to 5000 for free accounts (10000 for paid), will show error when exceeded. To plot on all available history set to 0 (default)
- Slow load/redraw times. This indicator becomes slower, its UI less responsive when:
- Pinescript Node.js graphics library is too slow and inefficient at plotting bars/objects in a browser window. Code optimization doesn't help much - the graphics engine is the main reason for general slowness.
- the chart has a long history (10000+ bars) in a browser's cache (you have scrolled back a couple of screens in a max zoom mode).
- Reload the page/Load a fresh chart and then apply the indicator or
- Switch to another Timeframe (old TF history will still remain in cache and that TF will be slow)
- in max possible zoom mode around 4500 bars can fit on 1 screen - this also slows down responsiveness. Reset Zoom level
- initial load and redraw times after a param change in UI also depend on TF. For example:
D1/W1 - 2 sec, H1/H4 - 5-6 sec, M30 - 10 sec, M15/M5 - 4 sec, M1 - 5 sec.
M30 usually has the longest history (up to 16000 bars) and W1 - the shortest (1000 bars).
- when indicator uses more MAs (plots) and timeframes it will redraw slower. Seems that up to 5 Timeframes is acceptable, but 6+ Timeframes can become very slow.
- show_last=last_bars plot limit doesn't affect load/redraw times, so it was removed from MA plot
- Max Bars Back (num_bars) default/custom set UI value doesn't seem to affect load/redraw times
- In max zoom mode all dynamic levels disappear (they behave like text)
1. based on 3EmaBB, uses plot*, barssince and security functions
2. you can't set certain constants from input due to Pinescript limitations - change the code as needed, recompile and use as a private version
3. Levels = trackprice implementation
4. Show Max Bars Back = show_last implementation
5. swma has a fixed length = 4, alma and linreg have additional offset and smoothing params
6. Smoothing is applied by default for visual aesthetics on MTF. To use exact ma mtf values (lines with stair stepping) - disable it
Good Luck! You can explore, modify/reuse the code to build your own indicators.

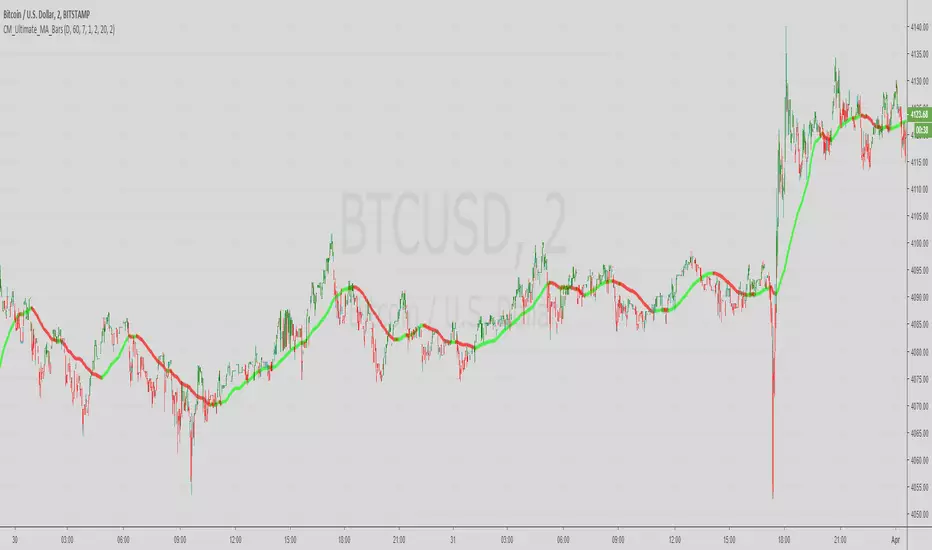
Up Down Alerts with MA Control - v2.0this update is meant for use with regular candles, but it will mimic the color pattern of heikin ashi candles and allow alerts based on the heikin ashi patterns. Also there are alerts for when the price is above a set moving average.
was going to just update the original script but there are a lot of changes to make it smoother etc, original script:
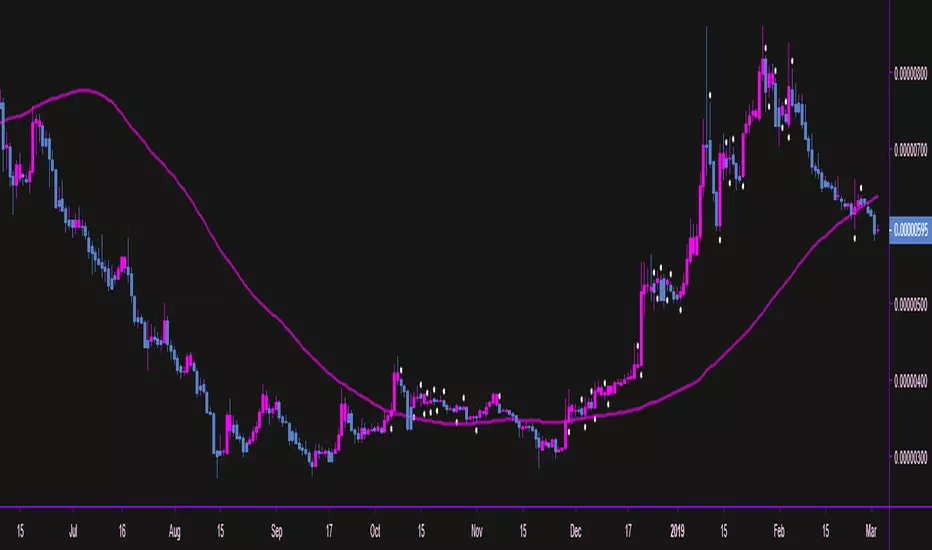
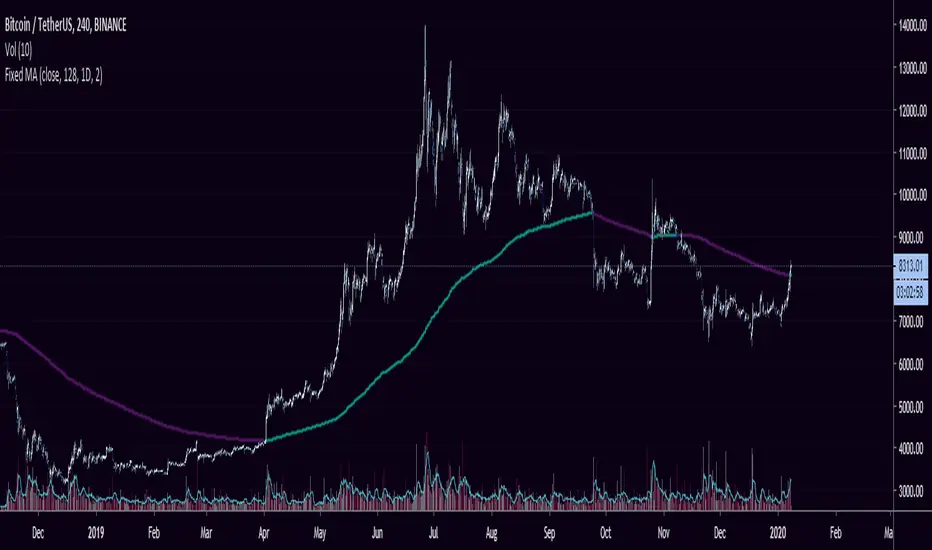
Fixed Moving AverageThis Indicator is a fixed moving average indicator.
By "fixed" I mean that you can choose for the MA to be based on the current resolution or fixed on a specific time-frame.
Default will be 128 D MA. It is fully customize able Moving Average.
It is a simple script. I created it because I wanted to be able to see the 128 D MA on any time-frame.
It can be used to determine your bias while trading:
- If the price is above the 128 day moving average, look for longs
- If the price is below the 128 day moving average, look for shorts
Bestest MA. Compare 2 x 7 MA's at different resolutionAdjust time, length, visibility, colour.
SMA and EMA can use different time resolution.
This is version 1 aka work in progress.


SMA 20, 50, 200This Script provides the 50 and 200 day moving average to provide a way to keep track of the classic Death Cross and Golden Cross. The 20 day moving average is just used as an early prediction of what the 50 day may do so you can keep and eye on it. If you are the kind of person that freaks out at sudden changes in the graphs it is probably best to just turn the 20 day off.
A Golden Cross is when the 50 day MA raises above the 200 day MA. This indicates the start of a Bull Market. This is the best time to buy as the market commonly will increase over the next few months or even years.
A Death Cross is when the 50 day MA drops below the 200 day MA. This indicates the start of a Bear Market. This is the best time to sell as the market will commonly decrease at least 20 percent or more over the next couple months or more.
I am not a financial advisor and this is just a tool to help you make your own decisions with your investments. My information is just based on common knowledge.


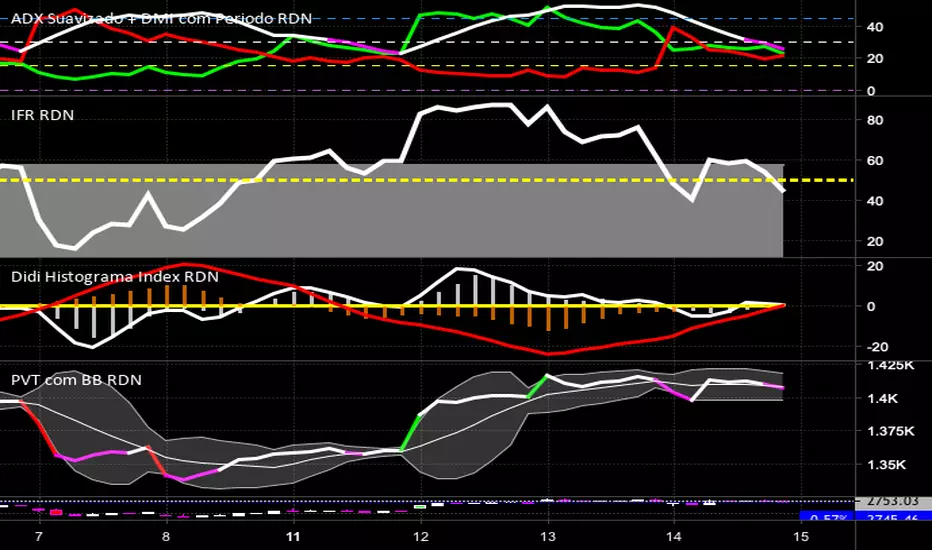
Didi Histograma Index RDN
Adicione rafdourado para maiores informações de uso ou dicas para aprimoramento
Add rafdourado for more usage information or tips for improvement