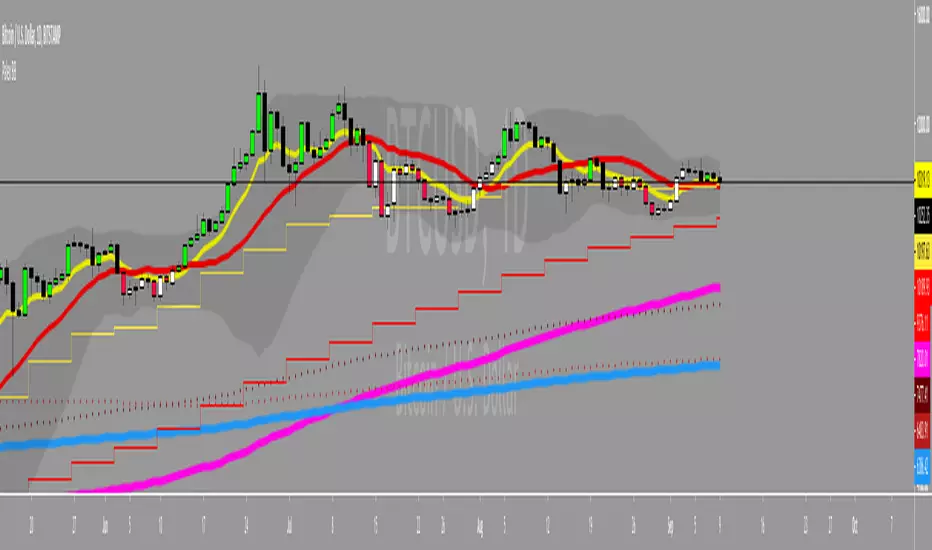
VWAP/MVWAP/SMA CROSSOVERTo use this indicator is simple.
When the VWAP (Thick Yellow) AND the two SMA (Orange and thin Yellow) cross above the MVWAP (Purple) then you will be in a uptrend that could possibly continue upwards. The opposite is true if you are looking a short opportunity, wait for the three other lines to cross under the MVWAP and you should be in a downtrend that could possibly continue downwards
Of course as with all indicators not every signal will be 100% accurate there is no way to predict human emotions when it comes to trading but based on the VWAP strategy used in other markets this is the closest I could get.
Note: Don't relay completely on this indicator to think for you. Use other forms of TA to confirm all positions before entering. And if the candles start trending the opposite direction after a lets say a mini pump/dump then the signal was false.
Finally this was made according to the 15 minute chart. I did not plan on remaking it for any other timeframes as I have left the code open for you to tweak and the setting are free to adjust aswell.
Q/A
Q: Does it repaint?
A: No, this is based on moving averages as far as I know they don't repaint.
Q: How did you come up with this indicator?
A: Went on youtube looking for trading strategies other and the usual EMA crosses and found a VWAP & EMA strat. I added the MVWAP and played with the numbers until I found something that I liked.
Q: How long have you been trading/learning pinescript?
A: Been trading less than a two months and pinescript about a month and a half.
Sma

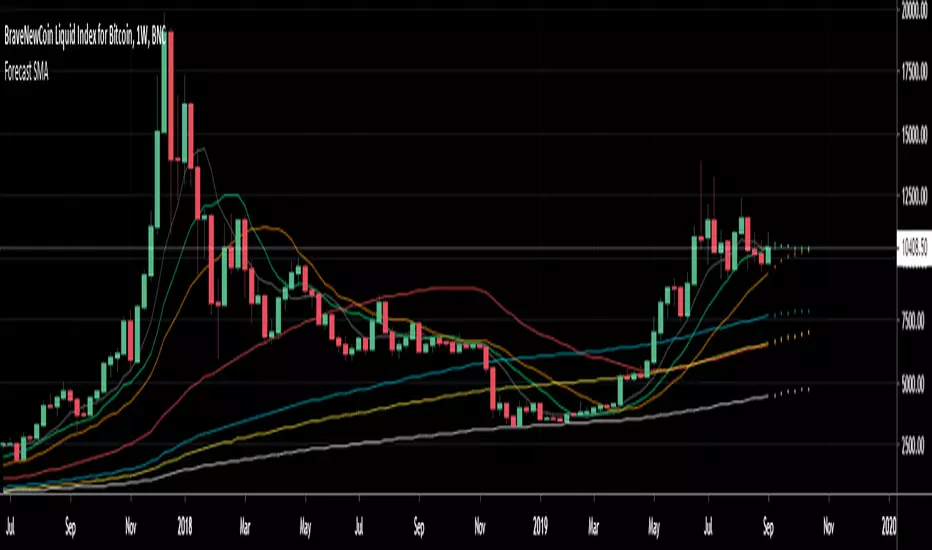
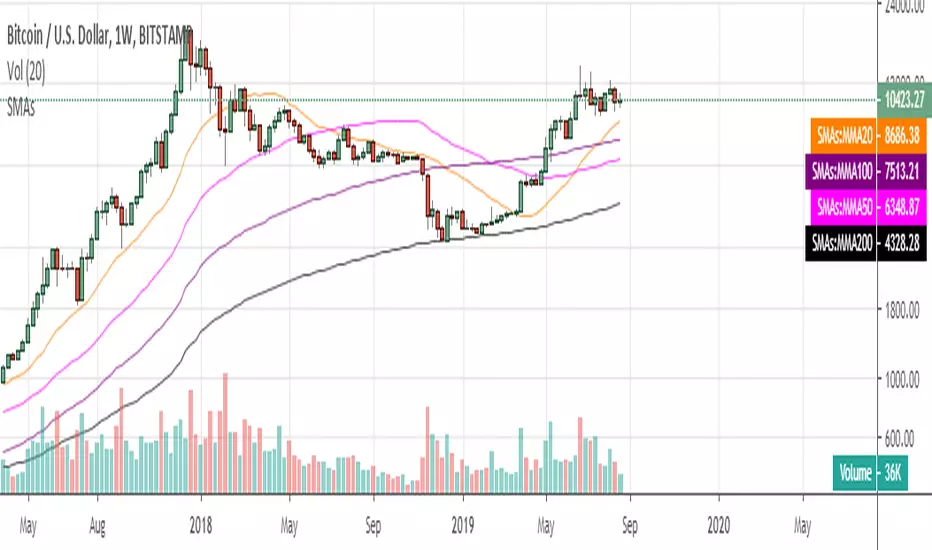
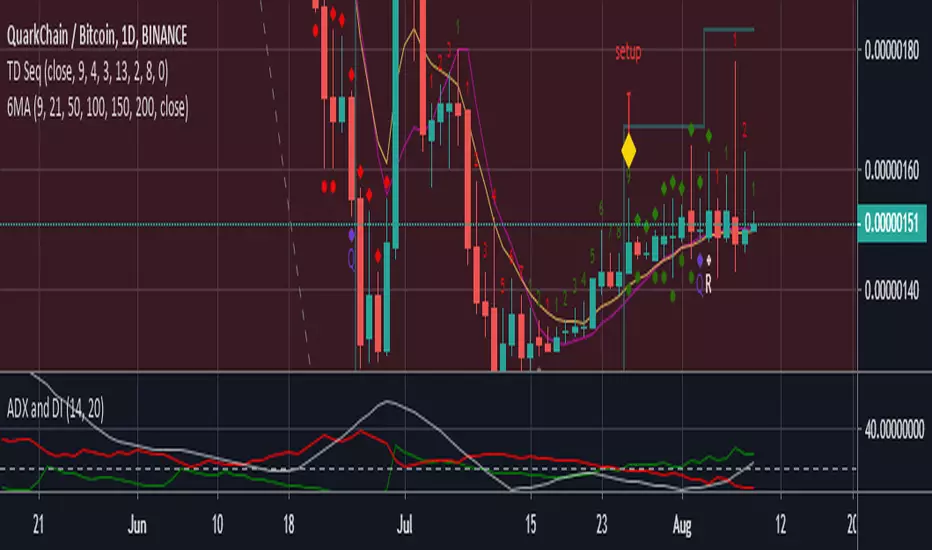
Forecast 7 SMA's 6 periodsForecast 7 SMA's 6 periods
This script is an upgrade of the existing Triple MA Forecast from Yatrader2
To allow the user to display 7 different SMAs and look 6 candles ahead
Default Value
8 SMA
13 SMA
20 SMA
50 SMA
100 SMA
128 SMA
200 SMA
Note:
Best to use on high timeframe, if on low timeframe change the forecast maximum to lower
This was made to forecast the 20 SMA on weekly timeframe on the upcomming Bitcoin price
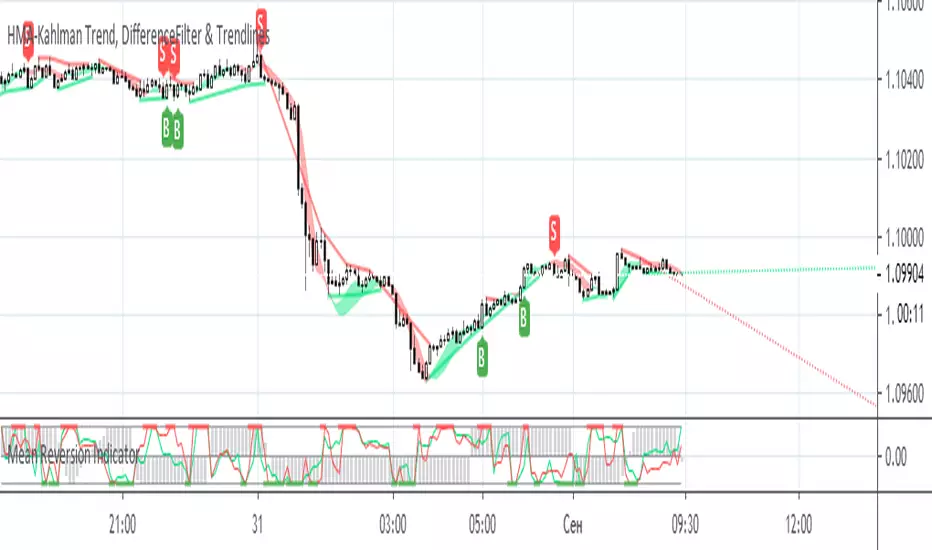
HMA-Kahlman Trend, DifferenceFilter & TrendlinesThis update to the previous HMA-Kahlman Trend, Clipping & Trendlines script features the same structure with the three modules:
- Trendlines module,
- NEW Winsorizing submodule using difference-based filtering.
- HMA-Kahlman Trend module.
The Winsorizing submodule filters signals by a volume level, eliminating the ones with the volume below a threshold. This module substitutes the previous 'low-level' filtering implementation. This time it filters out based on difference between scaled volume and its moving average.
Tested with BTCUSD.
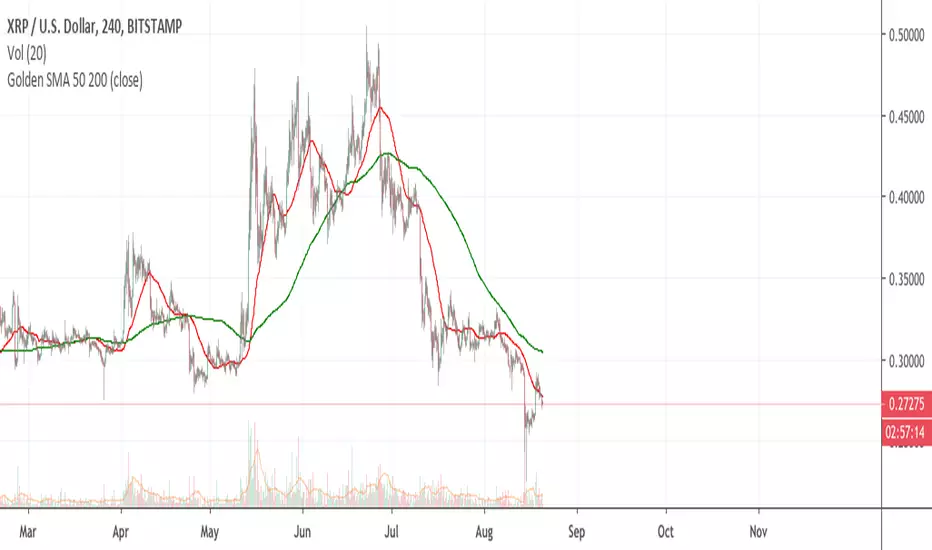
basifx 3 SMA cross 5 SMA(high, low, close) = short-term line(Orange)
34 SMA(high, low, close) = long-term line(Green & Red)
If 5 SMA is above 34 SMA = Green color, If 5 SMA is below 34 SMA = Red color

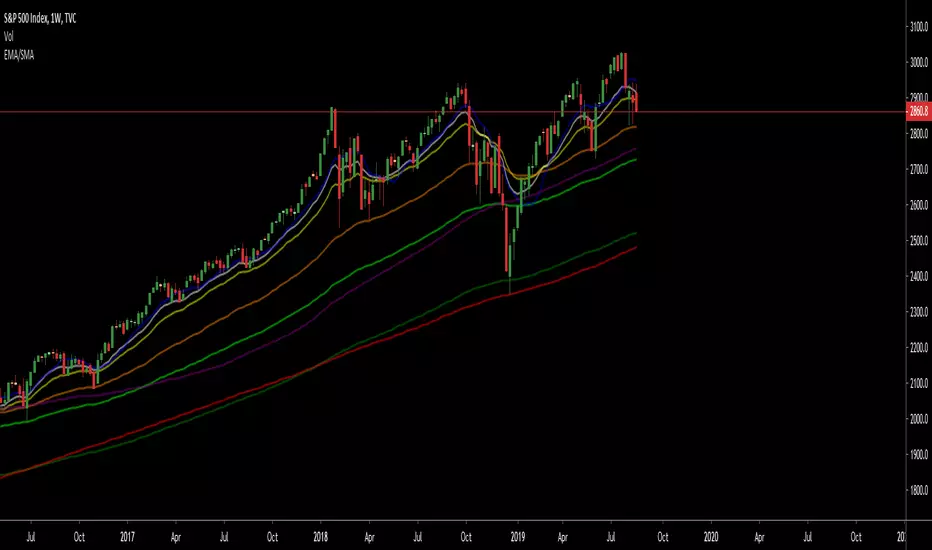
Multi EMA/SMA with Bollinger Bands Combo 1.0This script provides:
5 regular EMAs
5 regular SMAs
3 multiple time frame EMAs
3 multiple time frame SMAs
Bollinger Bands
All features can be turned on/off and customized regarding color, lines, etc.
Excellent for TradingView users with limited or free accounts.

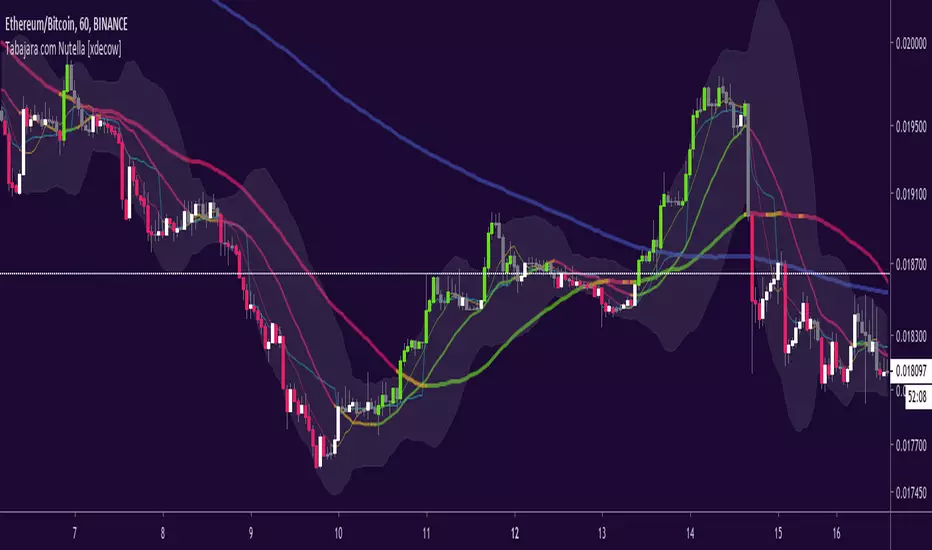
Tabajara com Nutella [xdecow]Tabajara setup from André Machado
-ma 8
-ma 20
-ma 50
-ma 200 (blue)
-vwap (aqua)
-bollinger bands
-barcolor based on tabajara rules

Leeloo Quadruple (4x) Simple Moving AverageOne-stop shop for all of the simple moving averages because editing separately is annoying.

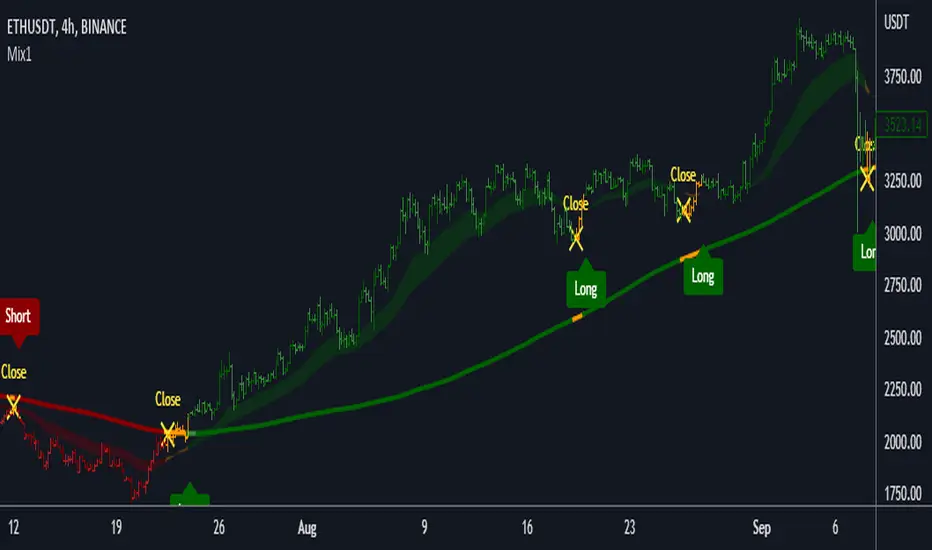
Mix1 : Ema Cross + Trend Channel [Gu5]Based on Trend Channel
Ema-crossover is added
Crossing alerts, only on trend
Basado en mi anterior indicador, Trend Channel
Se agrega Cruce de Medias Moviles (Ema-crossover)
Las alertas solo son en favor a la tendencia
El valor de SMA Range es arbitrario (No Backtesting). Cambia la amplitud de canal que determina cuando es rango (barras amarillas por estar muy cerca del SMA200, sin tendencia definida)
Range Multiplier adapta el indicador a distintos mercados
//Setting recommended for SMA Range
//BTCUSD = 100
//EURUSD = 1000
//SPX = 100
//ETHUSD = 10
Si te fue útil este indicador, puedes comprarme una cerveza ;)
2 Moving Average Color Direction Detection 2 Moving Average Color Direction Detection, possibility to configure:
- Type: SMA , EMA , WMA , VWMA , SMMA , DEMA , TEMA , HULLMA, ZEMA, TMA, SSMA
- Lenght
- Source
- Color direction

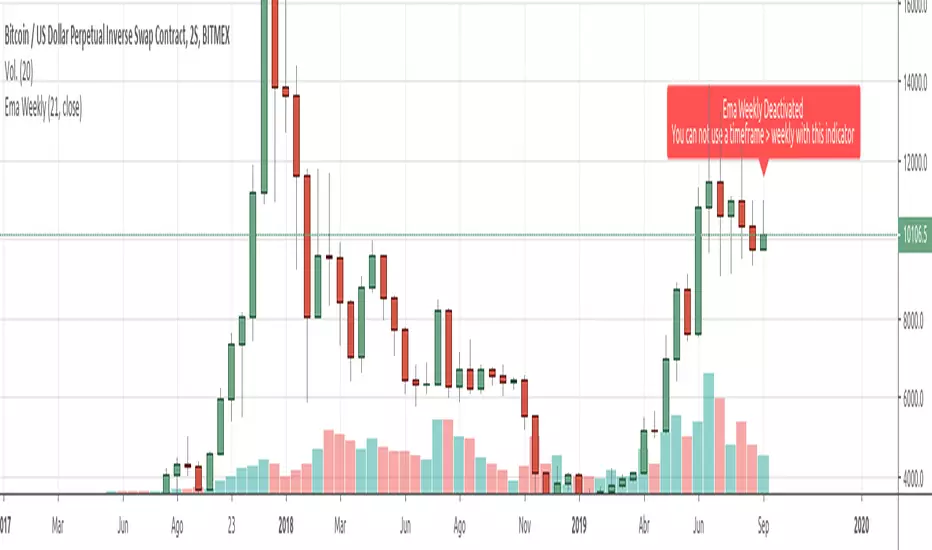
Ema Weekly In current TimeframeThis simple indicator shows the Ema with data extracted from weekly timeframe in your current displayed timeframe.
Due to Tradingview working restrictions, this indicator only works if is used in a timeframe lower (or equal) to one week, otherways shows an error red label showing this error.
All my scripts:
es.tradingview.com
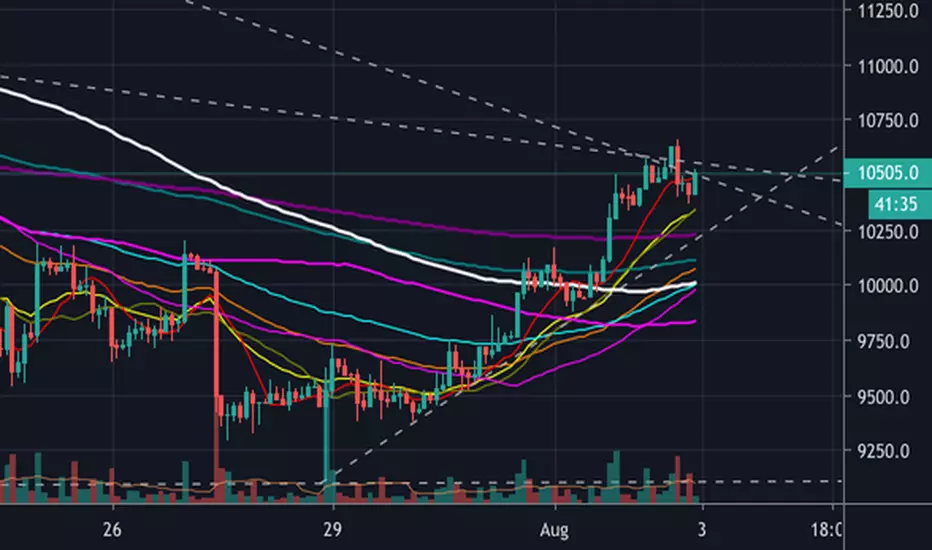
ck - 10 MA Combo (5 EMAs, 5 SMAs)Yet another MA and EMA indicator.
These are my favourite presets & colour combos for Tradingview Dark Theme.
Enjoy!
Multiple Moving AveragesThis is an indicator with 4 moving average slots and 6 exponential moving average slots
It also has bollinger bands and a volume weighted moving average slot
Feel free to edit this and add/remove some and publish your own
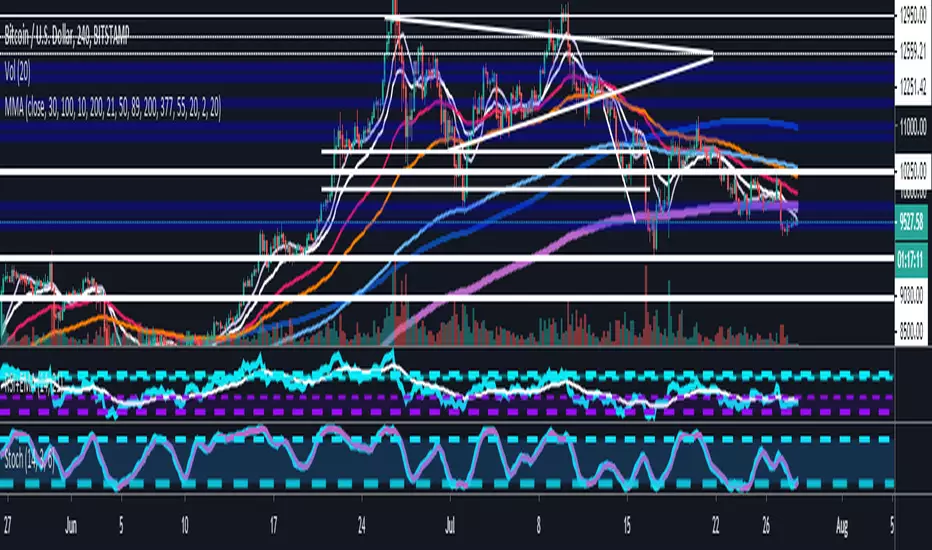
Palex 2.0Atualização do SETUP do saudoso Professor Alexandre Fernandes "Palex"
- Bandas de Bolliger (Standard) =
*Banda Superior = Média Móvel Simples (20 dias) + (2 x Desvio Padrão de 20 dias)
*Banda Inferior = Média Móvel Simples (20 dias) – (2 x Desvio Padrão de 20 dias)
- EMA 9 (Média Móvel Exponencial)
- SMA 21 (Média Móvel Simples)
- SMA 200 (Média Móvel Simples) Clássica MA 200 períodos
- SMA 400 (Média Móvel Simples)
- EMA 400 (Média Móvel Exponencial)
- WILD (Média Móvel Welles Wilder)
O mesmo usado pelo nosso grande Mestre PALEX!
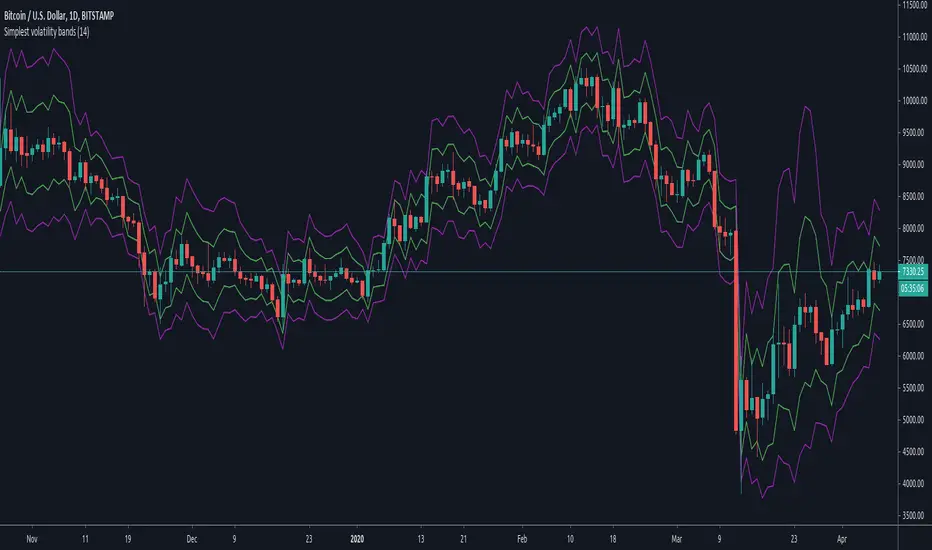
Simplest volatility bandsVolatility bands based on average candle percentage spread. Tested on BTCUSD charts only.
Based on the 68-95-99.7 rule, it seems that the spread, for daily and 4-H candles, follows a normal distribution: that means, around 85% of candles have a %-spread within sma(low/high, some_len) and sma(high/low, some_len) , and around 95% of candles within the pow2 of that range.
If you take the mean between the boundaries of the first %-spreads band, and calculate the 1.5 standard deviation of past some_len candles (I'm speaking from memory, it has been a while since I did them), the 1.5 standard deviation bands match similarly the %-spread bands, and around 85% of the candles are within these %-spread bands.
If you then take the pow2 of the bands, it will be similar to the 2 * std of the original bands, with around 95% of data within the pow2 bands.
You can take ema or other similar means with similar results, and the same for different lengths, but it seems that sma with a len of 14 is the more stable ones for both daily and 4-H, and taken other average calculations doesn't cause too many differences respect to the sma. I haven't tested too much for lower or higher timeframes.
With those %-spread bands, I multiple and divide those spreads to the open value of a new candle to get the two bands.
So, in short, you know that 85% of candles are within the closer bands, and around 95% of candles, around the bigger one. Once a new candle is born, the bands won't move (the bands are calculated from the previous candle, so the current candle's price movement doesn't move the band).
Going out the bands implies a sudden increase in volality, which usually causes rejection. They happen mostly at breakouts and ends of heavy trends. If a candle closes above the bigger band, you have probably got a breakout (a rejection rarely happens if the candle have already closed), although a breakout can happen without closing above the bands if volatility was already high.
If a trend is already stablished and is healthy, you won't probably see candles going out the bands, not even with a wick. When the trend is parabolic, and goes above the candle, the trend has probably ended, although the trend can be exhausted without going out the bands as well.
Heavy but not yet exhausted trends (specially recently started heavy downtrends), usually reach the bottom of the bigger bands during 4 o 5 contiguous candles (check visually looking at bitcoin history though, I'm speaking from memory).
So, the possibilities are multiple and you cannot use the bands to form a strategy, as usual. It can be comfortable enough psycologically for going to sleep, by moving your stop-loss to a point out of the bands in the opposite direction of your trade, and adjusting your position size accordingly; or just to check momentum looking at how close are the candle limits to the bands.
But, as usual, you are responsible of what you do with your money :)
VWAP + SMA + EMA3-in-one indicator, for swing and intra-day trading, which includes
Simple Moving Average (SMA)
Exponential Moving Average (EMA)
Volume-Weighted Average Price (VWAP)

Five EMA and Two SMA IndicatorIndicator Modeled After Krowns CrptoCave
-CryptoLumberJack
-BlazkingCryptoJunkies Web Slave Master

SMA 50 collector V2Hi everyone
The today script is an upgrade on steroids of my previous SMA 50 collector
Why this script ?
The SMA 50 is known to define a trend. If price is closing above, trend is bullish , if below, trend is bearish.
That's why I like to have all of them in all timeframes on my chart :)
Those are very relevant for all assets class : FOREX, INDEX, STOCKS, CRYPTO, ...
What's the update ?
I added new timeframes and developped a small optimization to get those labels placed on the right hand side of your screen.
"Is it really useful sir ?" Well, you certainly noticed that looking at a chart on tradingview mobile is not ideal (indicators overlapping, indicator names taking too much space and so on...)
When you'll deactivate the indicator name label display from tradingview, you can activate mine which will look way nicer on your mobile (and even Desktop).
This concept was greatly inspired by @scarf :
HOW TO USE IT ?
You can activate/deactivate the SMA50 you (don't) need in the style section of the indicator configuration UI. You'll just have to uncheck/check. Simple right :) ?
See y'all tomorrow for the next indicator or idea. The one for tomorrow should blow your mind as it certainly did when I discovered and optimized it
Enjoy
Dave
