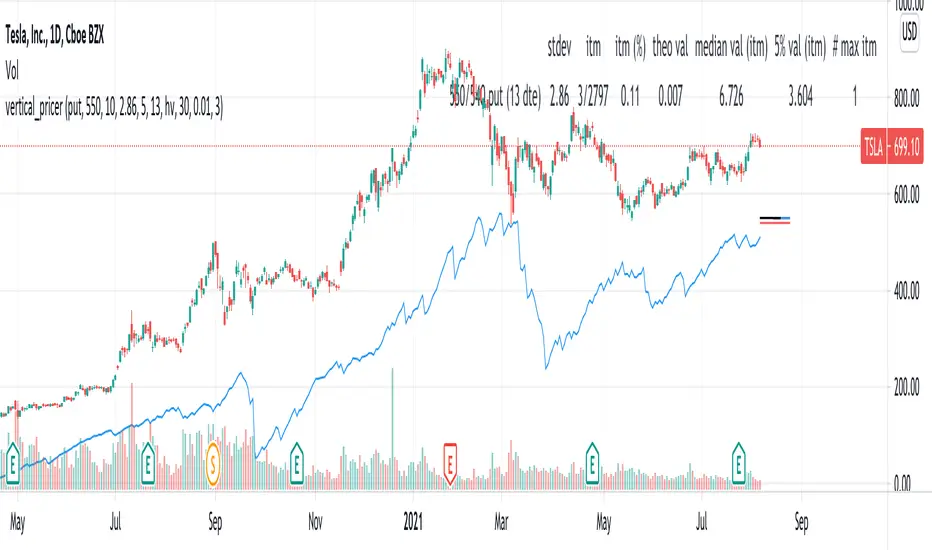
vertical_pricer
USAGE
1. Select the type of contract (call or put), the long strike, and the width.
2. Select the volatility model
3. The standard deviation is shown, enter it into the input.
The tool gives a theoretical price of a vertical spread, based on a
historical sample. The test assumes that a spread of equal width was sold on
every prior trading day at the given standard deviation, based on the
volatility model and duration of the contract. For example, if the 20 dte
110 strike is presently two standard deviations based on the 30 period
historical volatility, then the theoretical value is the average price all
2SD (at 20 dte) calls upon expiration, limited by the width of the spread and
normalized according to the present value of the underlying.
Other statistics include:
- The number of spreads in the sample, and percentage expired itm
- The median value at expiration
- The Nth percentile value of spreads at expiration
- The number of spreads that expired at max loss
Check the script comments and release notes for further updates, since Tradingview doesn't allow me to edit this description.
Spread
Cost of SpreadAdd to a quote, set the current total transaction cost (i.e. Spread (%) to 0.04 if BTCUSDT binance future, Spread (base) 0.0001 if trading EURUSD with 1 pip net spread).
Both lines indicate the relative volatility corrected cost of trading (ATR as orange line, StdDev as cyan).

Stochastic(4,3,2) Spread By Rajv1: This indicator plots a spread of %K - %D of the stochastic(4,3,2).

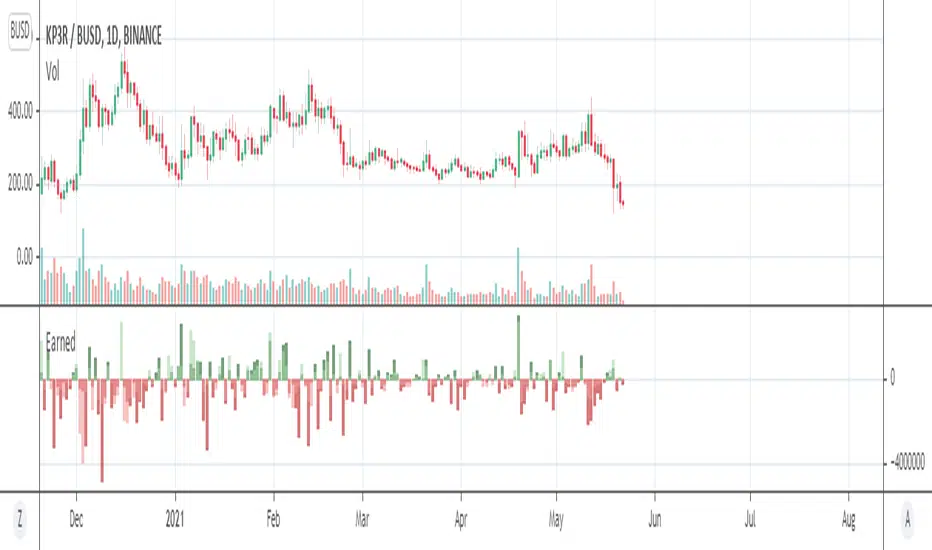
EarnedHello friends. I am glad to present for your attention one of my products based on the X-Volume indicator code. The "Earned" indicator shows how much money is earned on the market relative to actual timeframe. Accuracy is relative but nevertheless it is close to actual calculated figures.
How this information can help you? Moust easy interpritation -
1) Trend up - earnings up - bulls in the market.
2) Downward trend and earnings up - bears in the market.
3) Trend up - earnings down - fake growth.
4) Downward trend - earnings down - fake bears.
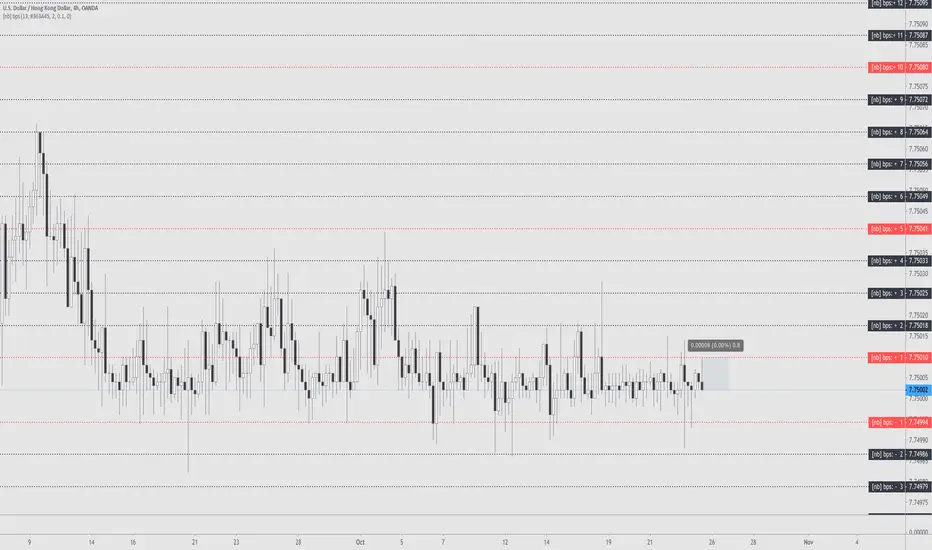
Basis Points Spread bps[NeoButane]Plots realtime basis points (bps) based on last bar's close price.
Original idea by @redxbt
Options to configure:
Show up to 19
Show only odd numbered
Change main horizontal colors
Change line width
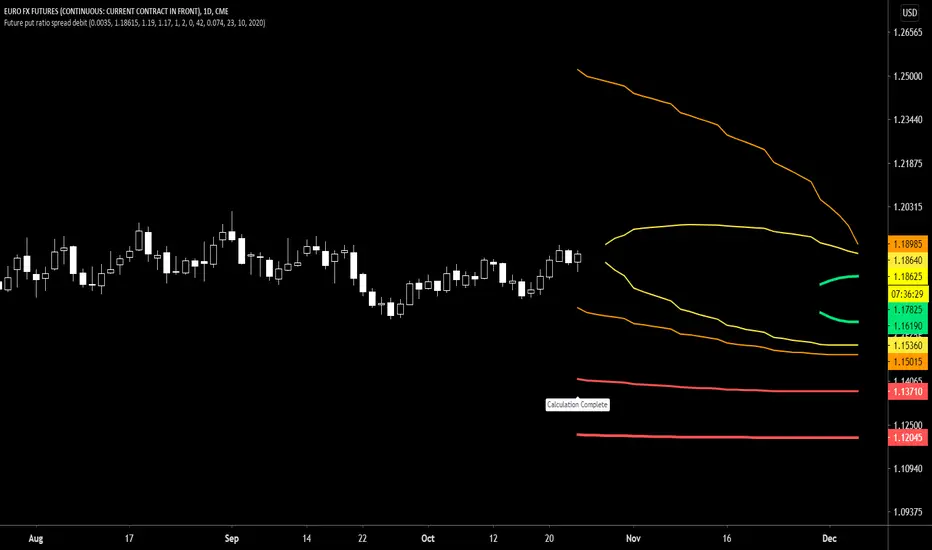
Future put ratio spread debit indicatorFuture Put ratio spread debit indicator developed by Chobotaru Brothers.
You need to have basic knowledge in option trading to use this indicator!
This spread is a DEBIT SPREAD.
The indicator shows P&L lines of the options strategy. Use only for futures since the mathematical model of options for Future instruments is different from stocks. Plus, the days' representation in futures is also different from stocks (stocks have fewer days than futures ).
***Each strategy in options is based on different mathematical equations, use this indicator only for the strategy in the headline.***
What does the indicator do?
The indicator is based on the Black-Scholes model, which uses partial differential equations to determine the option pricing. Due to options non-linear behavior, it is hard to visualize the option price. The indicator calculates the solutions of the Black-Scholes equation and plots them on the chart so traders can view how the option pricing will behave.
How the indicator does it?
The indicator uses five values (four dominants and one less dominant) to solve the Black-Scholes equation. The values are stock price, the strike price of the option, time to expiration, risk-free interest rate, and implied volatility .
How the indicator help the users?
-View the risks and rewards so you can know the profit targets in advance which means you can compare different options in different strikes.
-View the volatility change impact so you can know the risk and the P&L changes in case of a change in the volatility over the life of the option before you enter the trade.
-View the passage of time impact so you can know where and when you could realize a profit.
-Multi-timeframes so you can stay on the same chart (Daily and below).
All these features are to help the user improve his analysis while trading options.
How to use it?
The user needs to obtain from the “option chain” the following inputs:
-Debit paid: The debit paid for one unit of options strategy. Minimum value: 0.00001.
-Instrument price when entered spread: the stock price when you enter the options strategy.
-Upper strike price: the upper strike price of the options strategy.
-Lower strike price: the lower strike price of the options strategy.
- Upper Strike numbers of puts . This number has to be less than the number of puts that were sold.
- Lower Strike number of puts . This number has to be greater than the number of puts that were bought.
-Interest rate: find the risk-free interest rate from the U.S. DEPARTMENT OF THE TREASURY. Example: for 2% interest rate, input: 0.02.
-Days to expire: how many days until the option expires.
-Volatility: the implied volatility of the option bought/sold. Example: for 45% implied volatility , input: 0.45.
-Day of entry: A calendar day of the month that the option bought/sold.
-Month of entry: Calendar month the option bought/sold.
-Year of entry: Calendar year the option bought/sold.
After entering all the inputs, press Ok and you should see “Calculation Complete” on the chart.
The user should not change the entry date and days to expire inputs as time passes after he entered the trade.
How to access the indicator?
Use the link below to obtain access to the indicator
Future put ratio spread credit indicatorFuture Put ratio spread credit indicator developed by Chobotaru Brothers.
You need to have basic knowledge in option trading to use this indicator!
This spread is a CREDIT SPREAD.
The indicator shows P&L lines of the options strategy. Use only for futures since the mathematical model of options for Future instruments is different from stocks. Plus, the days' representation in futures is also different from stocks (stocks have fewer days than futures ).
***Each strategy in options is based on different mathematical equations, use this indicator only for the strategy in the headline.***
What does the indicator do?
The indicator is based on the Black-Scholes model, which uses partial differential equations to determine the option pricing. Due to options non-linear behavior, it is hard to visualize the option price. The indicator calculates the solutions of the Black-Scholes equation and plots them on the chart so traders can view how the option pricing will behave.
How the indicator does it?
The indicator uses five values (four dominants and one less dominant) to solve the Black-Scholes equation. The values are stock price, the strike price of the option, time to expiration, risk-free interest rate, and implied volatility .
How the indicator help the users?
-View the risks and rewards so you can know the profit targets in advance which means you can compare different options in different strikes.
-View the volatility change impact so you can know the risk and the P&L changes in case of a change in the volatility over the life of the option before you enter the trade.
-View the passage of time impact so you can know where and when you could realize a profit.
-Multi-timeframes so you can stay on the same chart (Daily and below).
All these features are to help the user improve his analysis while trading options.
How to use it?
The user needs to obtain from the “option chain” the following inputs:
-Credit received: The credit received for one unit of options strategy. Minimum value: 0.00001.
-Instrument price when entered spread: the stock price when you enter the options strategy.
-Upper strike price: the upper strike price of the options strategy.
-Lower strike price: the lower strike price of the options strategy.
- Upper Strike numbers of puts . This number has to be less than the number of puts that were sold.
- Lower Strike number of puts . This number has to be greater than the number of puts that were bought.
-Interest rate: find the risk-free interest rate from the U.S. DEPARTMENT OF THE TREASURY. Example: for 2% interest rate, input: 0.02.
-Days to expire: how many days until the option expires.
-Volatility: the implied volatility of the option bought/sold. Example: for 45% implied volatility , input: 0.45.
-Day of entry: A calendar day of the month that the option bought/sold.
-Month of entry: Calendar month the option bought/sold.
-Year of entry: Calendar year the option bought/sold.
After entering all the inputs, press Ok and you should see “Calculation Complete” on the chart.
The user should not change the entry date and days to expire inputs as time passes after he entered the trade.
How to access the indicator?
Use the link below to obtain access to the indicator

Future call ratio spread debit indicatorFuture Call ratio spread debit indicator developed by Chobotaru Brothers.
You need to have basic knowledge in option trading to use this indicator!
This spread is a DEBIT SPREAD.
The indicator shows P&L lines of the options strategy. Use only for stocks since the mathematical model of options for Future instruments is different from futures . Plus, the days' representation in futures is also different from stocks (stocks have fewer days than futures ).
***Each strategy in options is based on different mathematical equations, use this indicator only for the strategy in the headline.***
What does the indicator do?
The indicator is based on the Black-Scholes model, which uses partial differential equations to determine the option pricing. Due to options non-linear behavior, it is hard to visualize the option price. The indicator calculates the solutions of the Black-Scholes equation and plots them on the chart so traders can view how the option pricing will behave.
How the indicator does it?
The indicator uses five values (four dominants and one less dominant) to solve the Black-Scholes equation. The values are stock price, the strike price of the option, time to expiration, risk-free interest rate, and implied volatility .
How the indicator help the users?
-View the risks and rewards so you can know the profit targets in advance which means you can compare different options in different strikes.
-View the volatility change impact so you can know the risk and the P&L changes in case of a change in the volatility over the life of the option before you enter the trade.
-View the passage of time impact so you can know where and when you could realize a profit.
-Multi-timeframes so you can stay on the same chart (Daily and below).
All these features are to help the user improve his analysis while trading options.
How to use it?
The user needs to obtain from the “option chain” the following inputs:
-Debit paid: The debit paid for one unit of options strategy. Minimum value: 0.00001.
-Instrument price when entered spread: the stock price when you enter the options strategy.
-Upper strike price: the upper strike price of the options strategy.
-Lower strike price: the lower strike price of the options strategy.
- Upper Strike numbers of calls . This number has to be greater than the number of calls that were bought.
- Lower Strike number of calls . This number has to be less than the number of calls that were sold.
-Interest rate: find the risk-free interest rate from the U.S. DEPARTMENT OF THE TREASURY. Example: for 2% interest rate, input: 0.02.
-Days to expire: how many days until the option expires.
-Volatility: the implied volatility of the option bought/sold. Example: for 45% implied volatility , input: 0.45.
-Day of entry: A calendar day of the month that the option bought/sold.
-Month of entry: Calendar month the option bought/sold.
-Year of entry: Calendar year the option bought/sold.
After entering all the inputs, press Ok and you should see “Calculation Complete” on the chart.
The user should not change the entry date and days to expire inputs as time passes after he entered the trade.
How to access the indicator?
Use the link below to obtain access to the indicator

Future Call ratio spread credit indicatorFuture Call ratio spread credit indicator developed by Chobotaru Brothers.
You need to have basic knowledge in option trading to use this indicator!
This spread is a CREDIT SPREAD.
The indicator shows P&L lines of the options strategy. Use only for futures since the mathematical model of options for Future instruments is different from stocks. Plus, the days' representation in futures is also different from stocks (stocks have fewer days than futures ).
***Each strategy in options is based on different mathematical equations, use this indicator only for the strategy in the headline.***
What does the indicator do?
The indicator is based on the Black-Scholes model, which uses partial differential equations to determine the option pricing. Due to options non-linear behavior, it is hard to visualize the option price. The indicator calculates the solutions of the Black-Scholes equation and plots them on the chart so traders can view how the option pricing will behave.
How the indicator does it?
The indicator uses five values (four dominants and one less dominant) to solve the Black-Scholes equation. The values are stock price, the strike price of the option, time to expiration, risk-free interest rate, and implied volatility .
How the indicator help the users?
-View the risks and rewards so you can know the profit targets in advance which means you can compare different options in different strikes.
-View the volatility change impact so you can know the risk and the P&L changes in case of a change in the volatility over the life of the option before you enter the trade.
-View the passage of time impact so you can know where and when you could realize a profit.
-Multi-timeframes so you can stay on the same chart (Daily and below).
All these features are to help the user improve his analysis while trading options.
How to use it?
The user needs to obtain from the “option chain” the following inputs:
-Credit received: The credit received for one unit of options strategy. Minimum value: 0.00001.
-Instrument price when entered spread: the stock price when you enter the options strategy.
-Upper strike price: the upper strike price of the options strategy.
-Lower strike price: the lower strike price of the options strategy.
- Upper Strike numbers of calls . This number has to be greater than the number of calls that were bought.
- Lower Strike number of calls . This number has to be less than the number of calls that were sold.
-Interest rate: find the risk-free interest rate from the U.S. DEPARTMENT OF THE TREASURY. Example: for 2% interest rate, input: 0.02.
-Days to expire: how many days until the option expires.
-Volatility: the implied volatility of the option bought/sold. Example: for 45% implied volatility , input: 0.45.
-Day of entry: A calendar day of the month that the option bought/sold.
-Month of entry: Calendar month the option bought/sold.
-Year of entry: Calendar year the option bought/sold.
After entering all the inputs, press Ok and you should see “Calculation Complete” on the chart.
The user should not change the entry date and days to expire inputs as time passes after he entered the trade.
How to access the indicator?
Use the link below to obtain access to the indicator

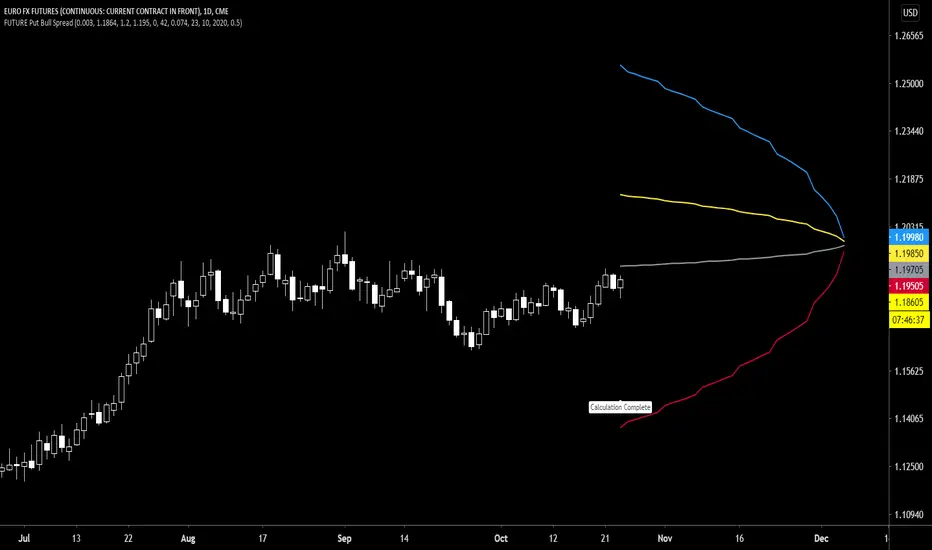
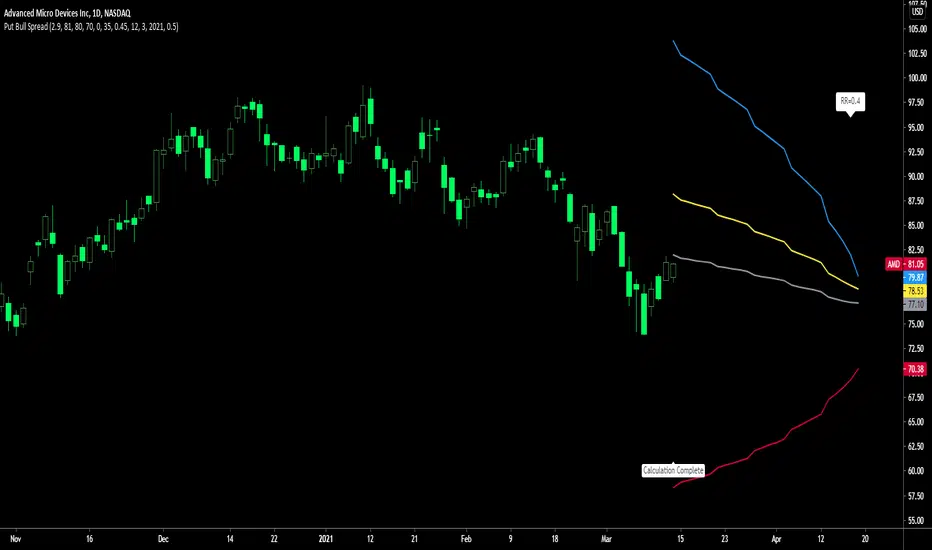
Future Put Bull Spread indicatorFuture Put bull spread indicator developed by Chobotaru Brothers.
You need to have basic knowledge in option trading to use this indicator!
This spread is a CREDIT SPREAD.
The indicator shows P&L lines of the options strategy. Use only for futures since the mathematical model of options for Future instruments is different from stocks. Plus, the days' representation in futures is also different from stocks (stocks have fewer days than futures ).
***Each strategy in options is based on different mathematical equations, use this indicator only for the strategy in the headline.***
What does the indicator do?
The indicator is based on the Black-Scholes model, which uses partial differential equations to determine the option pricing. Due to options non-linear behavior, it is hard to visualize the option price. The indicator calculates the solutions of the Black-Scholes equation and plots them on the chart so traders can view how the option pricing will behave.
How the indicator does it?
The indicator uses five values (four dominants and one less dominant) to solve the Black-Scholes equation. The values are stock price, the strike price of the option, time to expiration, risk-free interest rate, and implied volatility .
How the indicator help the users?
-View the risks and rewards so you can know the profit targets in advance which means you can compare different options in different strikes.
-View the volatility change impact so you can know the risk and the P&L changes in case of a change in the volatility over the life of the option before you enter the trade.
-View the passage of time impact so you can know where and when you could realize a profit.
-Multi-timeframes so you can stay on the same chart (Daily and below).
All these features are to help the user improve his analysis while trading options.
How to use it?
The user needs to obtain from the “option chain” the following inputs:
- Put spread price (Credit): The credit received for one unit of options strategy.
-Instrument price when entered spread: the stock price when you enter the options strategy.
-Upper strike price: the upper strike price of the options strategy.
-Lower strike price: the lower strike price of the options strategy.
-Interest rate: find the risk-free interest rate from the U.S. DEPARTMENT OF THE TREASURY. Example: for 2% interest rate, input: 0.02.
-Days to expire: how many days until the option expires.
-Volatility: the implied volatility of the option bought/sold. Example: for 45% implied volatility , input: 0.45.
-Day of entry: A calendar day of the month that the option bought/sold.
-Month of entry: Calendar month the option bought/sold.
-Year of entry: Calendar year the option bought/sold.
-% of Max Profit/Loss: Profit/loss line defined by the user. Minimum input (-0.95) ; maximum input (0.95).
Example: In this spread, -0.95 means, 95% of the options strategy maximum loss is reached and, 0.95 means, 95% of the options strategy maximum profit is reached.
After entering all the inputs, press Ok and you should see “Calculation Complete” on the chart.
The user should not change the entry date and days to expire inputs as time passes after he entered the trade.
How to access the indicator?
Use the link below to obtain access to the indicator
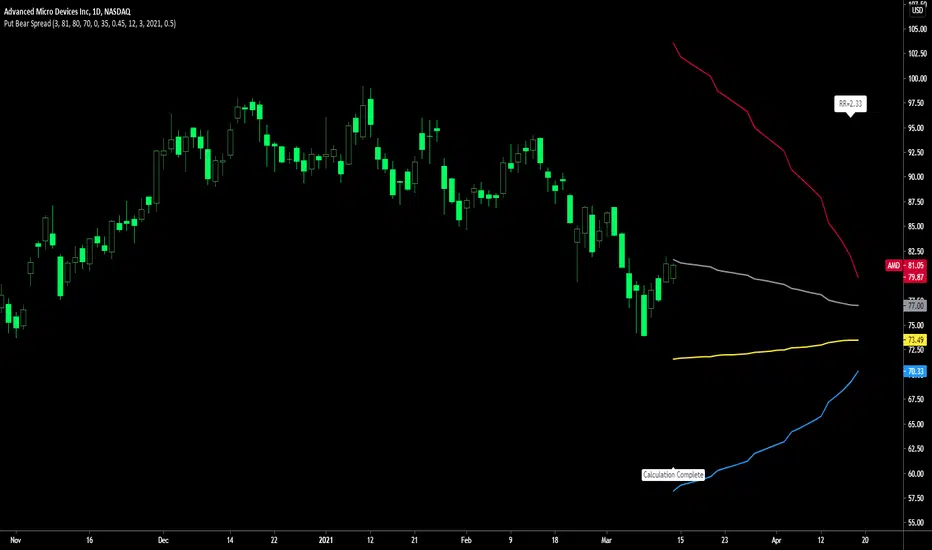
Future Put bear spread indicatorFuture Put bear spread indicator developed by Chobotaru Brothers.
You need to have basic knowledge in option trading to use this indicator!
This spread is a DEBIT SPREAD.
The indicator shows P&L lines of the options strategy. Use only for futures since the mathematical model of options for Future instruments is different from stocks. Plus, the days' representation in futures is also different from stocks (stocks have fewer days than futures ).
***Each strategy in options is based on different mathematical equations, use this indicator only for the strategy in the headline.***
What does the indicator do?
The indicator is based on the Black-Scholes model, which uses partial differential equations to determine the option pricing. Due to options non-linear behavior, it is hard to visualize the option price. The indicator calculates the solutions of the Black-Scholes equation and plots them on the chart so traders can view how the option pricing will behave.
How the indicator does it?
The indicator uses five values (four dominants and one less dominant) to solve the Black-Scholes equation. The values are stock price, the strike price of the option, time to expiration, risk-free interest rate, and implied volatility .
How the indicator help the users?
-View the risks and rewards so you can know the profit targets in advance which means you can compare different options in different strikes.
-View the volatility change impact so you can know the risk and the P&L changes in case of a change in the volatility over the life of the option before you enter the trade.
-View the passage of time impact so you can know where and when you could realize a profit.
-Multi-timeframes so you can stay on the same chart (Daily and below).
All these features are to help the user improve his analysis while trading options.
How to use it?
The user needs to obtain from the “option chain” the following inputs:
- Put spread price (Debit): The debit paid for one unit of options strategy.
-Instrument price when entered spread: the stock price when you enter the options strategy.
-Upper strike price: the upper strike price of the options strategy.
-Lower strike price: the lower strike price of the options strategy.
-Interest rate: find the risk-free interest rate from the U.S. DEPARTMENT OF THE TREASURY. Example: for 2% interest rate, input: 0.02.
-Days to expire: how many days until the option expires.
-Volatility: the implied volatility of the option bought/sold. Example: for 45% implied volatility , input: 0.45.
-Day of entry: A calendar day of the month that the option bought/sold.
-Month of entry: Calendar month the option bought/sold.
-Year of entry: Calendar year the option bought/sold.
-% of Max Profit/Loss: Profit/loss line defined by the user. Minimum input (-0.95) ; maximum input (0.95).
Example: In this spread, -0.95 means, 95% of the options strategy maximum loss is reached and, 0.95 means, 95% of the options strategy maximum profit is reached.
After entering all the inputs, press Ok and you should see “Calculation Complete” on the chart.
The user should not change the entry date and days to expire inputs as time passes after he entered the trade.
How to access the indicator?
Use the link below to obtain access to the indicator

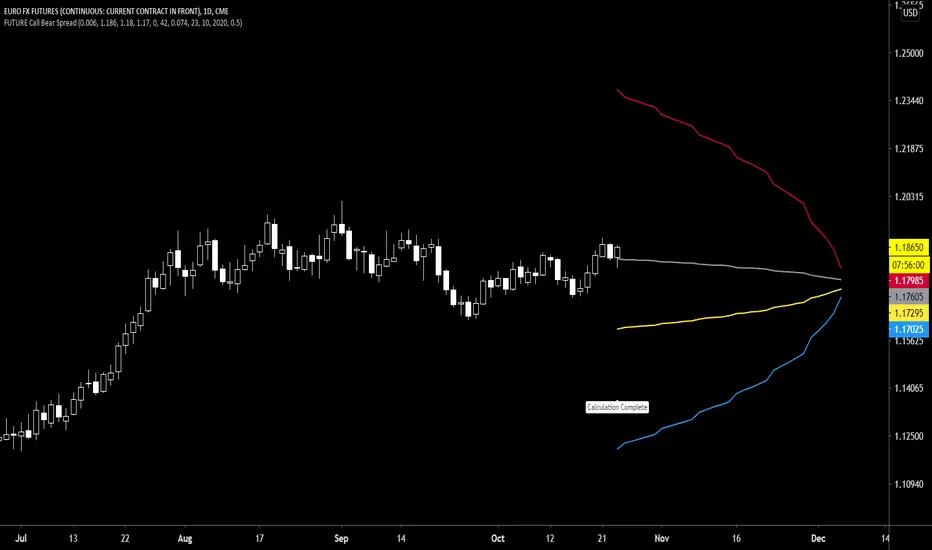
Future Call Bear Spread indicatorFuture Call bear spread indicator developed by Chobotaru Brothers.
You need to have basic knowledge in option trading to use this indicator!
This spread is a CREDIT SPREAD.
The indicator shows P&L lines of the options strategy. Use only for futures since the mathematical model of options for Future instruments is different from stocks. Plus, the days' representation in futures is also different from stocks (stocks have fewer days than futures ).
***Each strategy in options is based on different mathematical equations, use this indicator only for the strategy in the headline.***
What does the indicator do?
The indicator is based on the Black-Scholes model, which uses partial differential equations to determine the option pricing. Due to options non-linear behavior, it is hard to visualize the option price. The indicator calculates the solutions of the Black-Scholes equation and plots them on the chart so traders can view how the option pricing will behave.
How the indicator does it?
The indicator uses five values (four dominants and one less dominant) to solve the Black-Scholes equation. The values are stock price, the strike price of the option, time to expiration, risk-free interest rate, and implied volatility .
How the indicator help the users?
-View the risks and rewards so you can know the profit targets in advance which means you can compare different options in different strikes.
-View the volatility change impact so you can know the risk and the P&L changes in case of a change in the volatility over the life of the option before you enter the trade.
-View the passage of time impact so you can know where and when you could realize a profit.
-Multi-timeframes so you can stay on the same chart (Daily and below).
All these features are to help the user improve his analysis while trading options.
How to use it?
The user needs to obtain from the “option chain” the following inputs:
- Call spread price (Credit): The credit received for one unit of options strategy.
-Instrument price when entered spread: the stock price when you enter the options strategy.
-Upper strike price: the upper strike price of the options strategy.
-Lower strike price: the lower strike price of the options strategy.
-Interest rate: find the risk-free interest rate from the U.S. DEPARTMENT OF THE TREASURY. Example: for 2% interest rate, input: 0.02.
-Days to expire: how many days until the option expires.
-Volatility: the implied volatility of the option bought/sold. Example: for 45% implied volatility , input: 0.45.
-Day of entry: A calendar day of the month that the option bought/sold.
-Month of entry: Calendar month the option bought/sold.
-Year of entry: Calendar year the option bought/sold.
-% of Max Profit/Loss: Profit/loss line defined by the user. Minimum input (-0.95) ; maximum input (0.95).
Example: In this spread, -0.95 means, 95% of the options strategy maximum loss is reached and, 0.95 means, 95% of the options strategy maximum profit is reached.
After entering all the inputs, press Ok and you should see “Calculation Complete” on the chart.
The user should not change the entry date and days to expire inputs as time passes after he entered the trade.
How to access the indicator?
Use the link below to obtain access to the indicator
Future Call bull spread indicatorFuture Call bull spread indicator developed by Chobotaru Brothers.
You need to have basic knowledge in option trading to use this indicator!
This spread is a DEBIT SPREAD.
The indicator shows P&L lines of the options strategy. Use only for futures since the mathematical model of options for Future instruments is different from stocks. Plus, the days' representation in futures is also different from stocks (stocks have fewer days than futures ).
***Each strategy in options is based on different mathematical equations, use this indicator only for the strategy in the headline.***
What does the indicator do?
The indicator is based on the Black-Scholes model, which uses partial differential equations to determine the option pricing. Due to options non-linear behavior, it is hard to visualize the option price. The indicator calculates the solutions of the Black-Scholes equation and plots them on the chart so traders can view how the option pricing will behave.
How the indicator does it?
The indicator uses five values (four dominants and one less dominant) to solve the Black-Scholes equation. The values are stock price, the strike price of the option, time to expiration, risk-free interest rate, and implied volatility .
How the indicator help the users?
-View the risks and rewards so you can know the profit targets in advance which means you can compare different options in different strikes.
-View the volatility change impact so you can know the risk and the P&L changes in case of a change in the volatility over the life of the option before you enter the trade.
-View the passage of time impact so you can know where and when you could realize a profit.
-Multi-timeframes so you can stay on the same chart (Daily and below).
All these features are to help the user improve his analysis while trading options.
How to use it?
The user needs to obtain from the “option chain” the following inputs:
- Call spread price (Debit): The debit paid for one unit of options strategy.
-Instrument price when entered spread: the stock price when you enter the options strategy.
-Upper strike price: the upper strike price of the options strategy.
-Lower strike price: the lower strike price of the options strategy.
-Interest rate: find the risk-free interest rate from the U.S. DEPARTMENT OF THE TREASURY. Example: for 2% interest rate, input: 0.02.
-Days to expire: how many days until the option expires.
-Volatility: the implied volatility of the option bought/sold. Example: for 45% implied volatility , input: 0.45.
-Day of entry: A calendar day of the month that the option bought/sold.
-Month of entry: Calendar month the option bought/sold.
-Year of entry: Calendar year the option bought/sold.
-% of Max Profit/Loss: Profit/loss line defined by the user. Minimum input (-0.95) ; maximum input (0.95).
Example: In this spread, -0.95 means, 95% of the options strategy maximum loss is reached and, 0.95 means, 95% of the options strategy maximum profit is reached.
After entering all the inputs, press Ok and you should see “Calculation Complete” on the chart.
The user should not change the entry date and days to expire inputs as time passes after he entered the trade.
How to access the indicator?
Use the link below to obtain access to the indicator

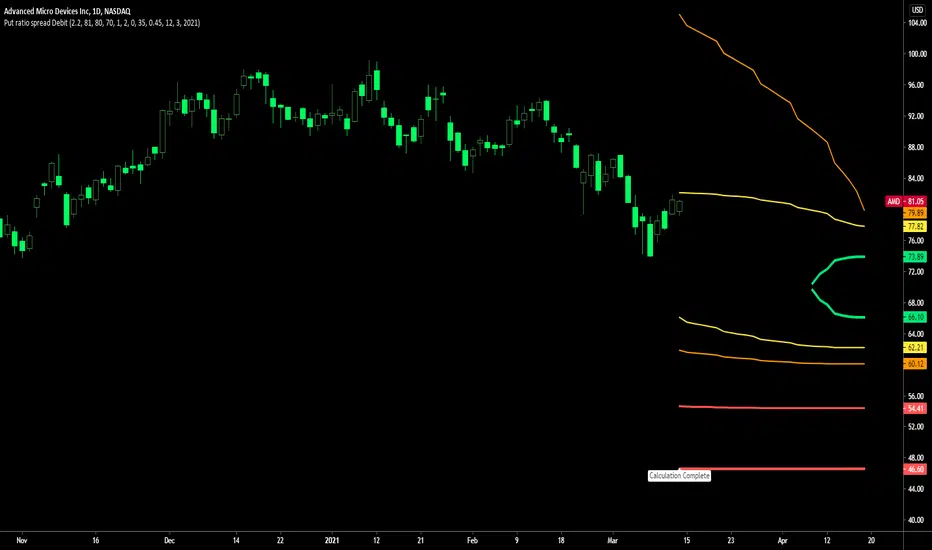
Put ratio spread Debit indicatorPut ratio spread debit indicator developed by Chobotaru Brothers.
You need to have basic knowledge in option trading to use this indicator!
This spread is a DEBIT SPREAD.
The indicator shows P&L lines of the options strategy. Use only for stocks since the mathematical model of options for Future instruments is different from stocks. Plus, the days' representation in futures is also different from stocks (stocks have fewer days than futures ).
***Each strategy in options is based on different mathematical equations, use this indicator only for the strategy in the headline.***
What does the indicator do?
The indicator is based on the Black-Scholes model, which uses partial differential equations to determine the option pricing. Due to options non-linear behavior, it is hard to visualize the option price. The indicator calculates the solutions of the Black-Scholes equation and plots them on the chart so traders can view how the option pricing will behave.
How the indicator does it?
The indicator uses five values (four dominants and one less dominant) to solve the Black-Scholes equation. The values are stock price, the strike price of the option, time to expiration, risk-free interest rate, and implied volatility .
How the indicator help the users?
-View the risks and rewards so you can know the profit targets in advance which means you can compare different options in different strikes.
-View the volatility change impact so you can know the risk and the P&L changes in case of a change in the volatility over the life of the option before you enter the trade.
-View the passage of time impact so you can know where and when you could realize a profit.
-Multi-timeframes so you can stay on the same chart (Daily and below).
All these features are to help the user improve his analysis while trading options.
How to use it?
The user needs to obtain from the “option chain” the following inputs:
-Debit paid: The debit paid for one unit of options strategy. Minimum value: 0. 01 .
-Instrument price when entered spread: the stock price when you enter the options strategy.
-Upper strike price: the upper strike price of the options strategy.
-Lower strike price: the lower strike price of the options strategy.
- Upper Strike numbers of puts . This number has to be less than the number of puts that were sold.
- Lower Strike number of puts . This number has to be greater than the number of puts that were bought.
-Interest rate: find the risk-free interest rate from the U.S. DEPARTMENT OF THE TREASURY. Example: for 2% interest rate, input: 0.02.
-Days to expire: how many days until the option expires.
-Volatility: the implied volatility of the option bought/sold. Example: for 45% implied volatility , input: 0.45.
-Day of entry: A calendar day of the month that the option bought/sold.
-Month of entry: Calendar month the option bought/sold.
-Year of entry: Calendar year the option bought/sold.
After entering all the inputs, press Ok and you should see “Calculation Complete” on the chart.
The user should not change the entry date and days to expire inputs as time passes after he entered the trade.
How to access the indicator?
Use the link below to obtain access to the indicator
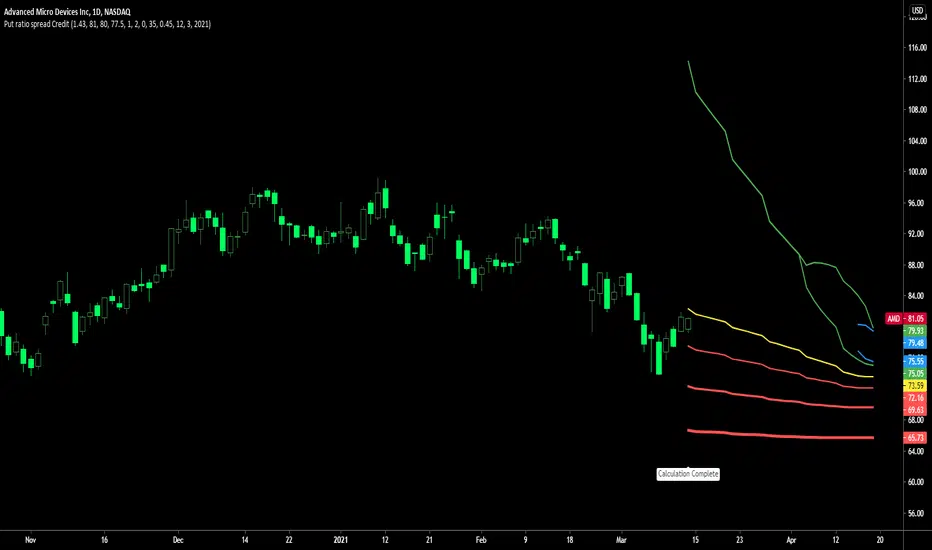
Put ratio spread Credit indicatorPut ratio spread credit indicator developed by Chobotaru Brothers.
You need to have basic knowledge in option trading to use this indicator!
This spread is a CREDIT SPREAD.
The indicator shows P&L lines of the options strategy. Use only for stocks since the mathematical model of options for Future instruments is different from stocks. Plus, the days' representation in futures is also different from stocks (stocks have fewer days than futures ).
***Each strategy in options is based on different mathematical equations, use this indicator only for the strategy in the headline.***
What does the indicator do?
The indicator is based on the Black-Scholes model, which uses partial differential equations to determine the option pricing. Due to options non-linear behavior, it is hard to visualize the option price. The indicator calculates the solutions of the Black-Scholes equation and plots them on the chart so traders can view how the option pricing will behave.
How the indicator does it?
The indicator uses five values (four dominants and one less dominant) to solve the Black-Scholes equation. The values are stock price, the strike price of the option, time to expiration, risk-free interest rate, and implied volatility .
How the indicator help the users?
-View the risks and rewards so you can know the profit targets in advance which means you can compare different options in different strikes.
-View the volatility change impact so you can know the risk and the P&L changes in case of a change in the volatility over the life of the option before you enter the trade.
-View the passage of time impact so you can know where and when you could realize a profit.
-Multi-timeframes so you can stay on the same chart (Daily and below).
All these features are to help the user improve his analysis while trading options.
How to use it?
The user needs to obtain from the “option chain” the following inputs:
-Credit received: The credit received for one unit of options strategy. Minimum value: 0. 01 .
-Instrument price when entered spread: the stock price when you enter the options strategy.
-Upper strike price: the upper strike price of the options strategy.
-Lower strike price: the lower strike price of the options strategy.
- Upper Strike numbers of puts . This number has to be less than the number of puts that were sold.
- Lower Strike number of puts . This number has to be greater than the number of puts that were bought.
-Interest rate: find the risk-free interest rate from the U.S. DEPARTMENT OF THE TREASURY. Example: for 2% interest rate, input: 0.02.
-Days to expire: how many days until the option expires.
-Volatility: the implied volatility of the option bought/sold. Example: for 45% implied volatility , input: 0.45.
-Day of entry: A calendar day of the month that the option bought/sold.
-Month of entry: Calendar month the option bought/sold.
-Year of entry: Calendar year the option bought/sold.
After entering all the inputs, press Ok and you should see “Calculation Complete” on the chart.
The user should not change the entry date and days to expire inputs as time passes after he entered the trade.
How to access the indicator?
Use the link below to obtain access to the indicator
Call ratio spread debit indicatorCall ratio spread debit indicator developed by Chobotaru Brothers.
You need to have basic knowledge in option trading to use this indicator!
This spread is a DEBIT SPREAD.
The indicator shows P&L lines of the options strategy. Use only for stocks since the mathematical model of options for Future instruments is different from stocks. Plus, the days' representation in futures is also different from stocks (stocks have fewer days than futures ).
***Each strategy in options is based on different mathematical equations, use this indicator only for the strategy in the headline.***
What does the indicator do?
The indicator is based on the Black-Scholes model, which uses partial differential equations to determine the option pricing. Due to options non-linear behavior, it is hard to visualize the option price. The indicator calculates the solutions of the Black-Scholes equation and plots them on the chart so traders can view how the option pricing will behave.
How the indicator does it?
The indicator uses five values (four dominants and one less dominant) to solve the Black-Scholes equation. The values are stock price, the strike price of the option, time to expiration, risk-free interest rate, and implied volatility .
How the indicator help the users?
-View the risks and rewards so you can know the profit targets in advance which means you can compare different options in different strikes.
-View the volatility change impact so you can know the risk and the P&L changes in case of a change in the volatility over the life of the option before you enter the trade.
-View the passage of time impact so you can know where and when you could realize a profit.
-Multi-timeframes so you can stay on the same chart (Daily and below).
All these features are to help the user improve his analysis while trading options.
How to use it?
The user needs to obtain from the “option chain” the following inputs:
-Debit paid: The debit paid for one unit of options strategy. Minimum value: 0. 01 .
-Instrument price when entered spread: the stock price when you enter the options strategy.
-Upper strike price: the upper strike price of the options strategy.
-Lower strike price: the lower strike price of the options strategy.
- Upper Strike numbers of calls . This number has to be greater than the number of calls that were bought.
- Lower Strike number of calls . This number has to be less than the number of calls that were sold.
-Interest rate: find the risk-free interest rate from the U.S. DEPARTMENT OF THE TREASURY. Example: for 2% interest rate, input: 0.02.
-Days to expire: how many days until the option expires.
-Volatility: the implied volatility of the option bought/sold. Example: for 45% implied volatility , input: 0.45.
-Day of entry: A calendar day of the month that the option bought/sold.
-Month of entry: Calendar month the option bought/sold.
-Year of entry: Calendar year the option bought/sold.
After entering all the inputs, press Ok and you should see “Calculation Complete” on the chart.
The user should not change the entry date and days to expire inputs as time passes after he entered the trade.
How to access the indicator?
Use the link below to obtain access to the indicator

Call ratio spread Credit indicatorCall ratio spread credit indicator developed by Chobotaru Brothers.
You need to have basic knowledge in option trading to use this indicator!
This spread is a CREDIT SPREAD.
The indicator shows P&L lines of the options strategy. Use only for stocks since the mathematical model of options for Future instruments is different from stocks. Plus, the days' representation in futures is also different from stocks (stocks have fewer days than futures ).
***Each strategy in options is based on different mathematical equations, use this indicator only for the strategy in the headline.***
What does the indicator do?
The indicator is based on the Black-Scholes model, which uses partial differential equations to determine the option pricing. Due to options non-linear behavior, it is hard to visualize the option price. The indicator calculates the solutions of the Black-Scholes equation and plots them on the chart so traders can view how the option pricing will behave.
How the indicator does it?
The indicator uses five values (four dominants and one less dominant) to solve the Black-Scholes equation. The values are stock price, the strike price of the option, time to expiration, risk-free interest rate, and implied volatility .
How the indicator help the users?
-View the risks and rewards so you can know the profit targets in advance which means you can compare different options in different strikes.
-View the volatility change impact so you can know the risk and the P&L changes in case of a change in the volatility over the life of the option before you enter the trade.
-View the passage of time impact so you can know where and when you could realize a profit.
-Multi-timeframes so you can stay on the same chart (Daily and below).
All these features are to help the user improve his analysis while trading options.
How to use it?
The user needs to obtain from the “option chain” the following inputs:
-Credit received: The credit received for one unit of options strategy. Minimum value: 0. 01 .
-Instrument price when entered spread: the stock price when you enter the options strategy.
-Upper strike price: the upper strike price of the options strategy.
-Lower strike price: the lower strike price of the options strategy.
- Upper Strike numbers of calls . This number has to be greater than the number of calls that were bought.
- Lower Strike number of calls . This number has to be less than the number of calls that were sold.
-Interest rate: find the risk-free interest rate from the U.S. DEPARTMENT OF THE TREASURY. Example: for 2% interest rate, input: 0.02.
-Days to expire: how many days until the option expires.
-Volatility: the implied volatility of the option bought/sold. Example: for 45% implied volatility , input: 0.45.
-Day of entry: A calendar day of the month that the option bought/sold.
-Month of entry: Calendar month the option bought/sold.
-Year of entry: Calendar year the option bought/sold.
After entering all the inputs, press Ok and you should see “Calculation Complete” on the chart.
The user should not change the entry date and days to expire inputs as time passes after he entered the trade.
How to access the indicator?
Use the link below to obtain access to the indicator

Put Bull Spread indicatorPut bull spread indicator developed by Chobotaru Brothers.
You need to have basic knowledge in option trading to use this indicator!
This spread is a CREDIT SPREAD.
The indicator shows P&L lines of the options strategy. Use only for stocks since the mathematical model of options for Future instruments is different from stocks. Plus, the days' representation in futures is also different from stocks (stocks have fewer days than futures ).
***Each strategy in options is based on different mathematical equations, use this indicator only for the strategy in the headline.***
What does the indicator do?
The indicator is based on the Black-Scholes model, which uses partial differential equations to determine the option pricing. Due to options non-linear behavior, it is hard to visualize the option price. The indicator calculates the solutions of the Black-Scholes equation and plots them on the chart so traders can view how the option pricing will behave.
How the indicator does it?
The indicator uses five values (four dominants and one less dominant) to solve the Black-Scholes equation. The values are stock price, the strike price of the option, time to expiration, risk-free interest rate, and implied volatility .
How the indicator help the users?
-View the risks and rewards so you can know the profit targets in advance which means you can compare different options in different strikes.
-View the volatility change impact so you can know the risk and the P&L changes in case of a change in the volatility over the life of the option before you enter the trade.
-View the passage of time impact so you can know where and when you could realize a profit.
-Multi-timeframes so you can stay on the same chart (Daily and below).
All these features are to help the user improve his analysis while trading options.
How to use it?
The user needs to obtain from the “option chain” the following inputs:
- Put spread price (Credit): The credit received for one unit of options strategy.
-Instrument price when entered spread: the stock price when you enter the options strategy.
-Upper strike price: the upper strike price of the options strategy.
-Lower strike price: the lower strike price of the options strategy.
-Interest rate: find the risk-free interest rate from the U.S. DEPARTMENT OF THE TREASURY. Example: for 2% interest rate, input: 0.02.
-Days to expire: how many days until the option expires.
-Volatility: the implied volatility of the option bought/sold. Example: for 45% implied volatility , input: 0.45.
-Day of entry: A calendar day of the month that the option bought/sold.
-Month of entry: Calendar month the option bought/sold.
-Year of entry: Calendar year the option bought/sold.
-% of Max Profit/Loss: Profit/loss line defined by the user. Minimum input (-0.95) ; maximum input (0.95).
Example: In this spread, -0.95 means, 95% of the options strategy maximum loss is reached and, 0.95 means, 95% of the options strategy maximum profit is reached.
After entering all the inputs, press Ok and you should see “Calculation Complete” on the chart.
The user should not change the entry date and days to expire inputs as time passes after he entered the trade.
How to access the indicator?
Use the link below to obtain access to the indicator
Put Bear Spread indicatorPut bear spread indicator developed by Chobotaru Brothers.
You need to have basic knowledge in option trading to use this indicator!
This spread is a DEBIT SPREAD.
The indicator shows P&L lines of the options strategy. Use only for stocks since the mathematical model of options for Future instruments is different from stocks. Plus, the days' representation in futures is also different from stocks (stocks have fewer days than futures ).
***Each strategy in options is based on different mathematical equations, use this indicator only for the strategy in the headline.***
What does the indicator do?
The indicator is based on the Black-Scholes model, which uses partial differential equations to determine the option pricing. Due to options non-linear behavior, it is hard to visualize the option price. The indicator calculates the solutions of the Black-Scholes equation and plots them on the chart so traders can view how the option pricing will behave.
How the indicator does it?
The indicator uses five values (four dominants and one less dominant) to solve the Black-Scholes equation. The values are stock price, the strike price of the option, time to expiration, risk-free interest rate, and implied volatility .
How the indicator help the users?
-View the risks and rewards so you can know the profit targets in advance which means you can compare different options in different strikes.
-View the volatility change impact so you can know the risk and the P&L changes in case of a change in the volatility over the life of the option before you enter the trade.
-View the passage of time impact so you can know where and when you could realize a profit.
-Multi-timeframes so you can stay on the same chart (Daily and below).
All these features are to help the user improve his analysis while trading options.
How to use it?
The user needs to obtain from the “option chain” the following inputs:
- Put spread price (Debit): The debit paid for one unit of options strategy.
-Instrument price when entered spread: the stock price when you enter the options strategy.
-Upper strike price: the upper strike price of the options strategy.
-Lower strike price: the lower strike price of the options strategy.
-Interest rate: find the risk-free interest rate from the U.S. DEPARTMENT OF THE TREASURY. Example: for 2% interest rate, input: 0.02.
-Days to expire: how many days until the option expires.
-Volatility: the implied volatility of the option bought/sold. Example: for 45% implied volatility , input: 0.45.
-Day of entry: A calendar day of the month that the option bought/sold.
-Month of entry: Calendar month the option bought/sold.
-Year of entry: Calendar year the option bought/sold.
-% of Max Profit/Loss: Profit/loss line defined by the user. Minimum input (-0.95) ; maximum input (0.95).
Example: In this spread, -0.95 means, 95% of the options strategy maximum loss is reached and, 0.95 means, 95% of the options strategy maximum profit is reached.
After entering all the inputs, press Ok and you should see “Calculation Complete” on the chart.
The user should not change the entry date and days to expire inputs as time passes after he entered the trade.
How to access the indicator?
Use the link below to obtain access to the indicator
Call Bear Spread indicatorCall bear spread indicator developed by Chobotaru Brothers.
You need to have basic knowledge in option trading to use this indicator!
This spread is a CREDIT SPREAD.
The indicator shows P&L lines of the options strategy. Use only for stocks since the mathematical model of options for Future instruments is different from stocks. Plus, the days' representation in futures is also different from stocks (stocks have fewer days than futures ).
***Each strategy in options is based on different mathematical equations, use this indicator only for the strategy in the headline.***
What does the indicator do?
The indicator is based on the Black-Scholes model, which uses partial differential equations to determine the option pricing. Due to options non-linear behavior, it is hard to visualize the option price. The indicator calculates the solutions of the Black-Scholes equation and plots them on the chart so traders can view how the option pricing will behave.
How the indicator does it?
The indicator uses five values (four dominants and one less dominant) to solve the Black-Scholes equation. The values are stock price, the strike price of the option, time to expiration, risk-free interest rate, and implied volatility .
How the indicator help the users?
-View the risks and rewards so you can know the profit targets in advance which means you can compare different options in different strikes.
-View the volatility change impact so you can know the risk and the P&L changes in case of a change in the volatility over the life of the option before you enter the trade.
-View the passage of time impact so you can know where and when you could realize a profit.
-Multi-timeframes so you can stay on the same chart (Daily and below).
All these features are to help the user improve his analysis while trading options.
How to use it?
The user needs to obtain from the “option chain” the following inputs:
- Call spread price (Credit): The credit received for one unit of options strategy.
-Instrument price when entered spread: the stock price when you enter the options strategy.
-Upper strike price: the upper strike price of the options strategy.
-Lower strike price: the lower strike price of the options strategy.
-Interest rate: find the risk-free interest rate from the U.S. DEPARTMENT OF THE TREASURY. Example: for 2% interest rate, input: 0.02.
-Days to expire: how many days until the option expires.
-Volatility: the implied volatility of the option bought/sold. Example: for 45% implied volatility , input: 0.45.
-Day of entry: A calendar day of the month that the option bought/sold.
-Month of entry: Calendar month the option bought/sold.
-Year of entry: Calendar year the option bought/sold.
-% of Max Profit/Loss: Profit/loss line defined by the user. Minimum input (-0.95) ; maximum input (0.95).
Example: In this spread, -0.95 means, 95% of the options strategy maximum loss is reached and, 0.95 means, 95% of the options strategy maximum profit is reached.
After entering all the inputs, press Ok and you should see “Calculation Complete” on the chart.
The user should not change the entry date and days to expire inputs as time passes after he entered the trade.
How to access the indicator?
Use the link below to obtain access to the indicator

Call bull spread indicatorCall bull spread indicator developed by Chobotaru Brothers.
You need to have basic knowledge in option trading to use this indicator!
This spread is a DEBIT SPREAD.
The indicator shows P&L lines of the options strategy. Use only for stocks since the mathematical model of options for Future instruments is different from stocks. Plus, the days' representation in futures is also different from stocks (stocks have fewer days than futures ).
***Each strategy in options is based on different mathematical equations, use this indicator only for the strategy in the headline.***
What does the indicator do?
The indicator is based on the Black-Scholes model, which uses partial differential equations to determine the option pricing. Due to options non-linear behavior, it is hard to visualize the option price. The indicator calculates the solutions of the Black-Scholes equation and plots them on the chart so traders can view how the option pricing will behave.
How the indicator does it?
The indicator uses five values (four dominants and one less dominant) to solve the Black-Scholes equation. The values are stock price, the strike price of the option, time to expiration, risk-free interest rate, and implied volatility .
How the indicator help the users?
-View the risks and rewards so you can know the profit targets in advance which means you can compare different options in different strikes.
-View the volatility change impact so you can know the risk and the P&L changes in case of a change in the volatility over the life of the option before you enter the trade.
-View the passage of time impact so you can know where and when you could realize a profit.
-Multi-timeframes so you can stay on the same chart (Daily and below).
All these features are to help the user improve his analysis while trading options.
How to use it?
The user needs to obtain from the “option chain” the following inputs:
- Call spread price (Debit): The debit paid for one unit of options strategy.
-Instrument price when entered spread: the stock price when you enter the options strategy.
-Upper strike price: the upper strike price of the options strategy.
-Lower strike price: the lower strike price of the options strategy.
-Interest rate: find the risk-free interest rate from the U.S. DEPARTMENT OF THE TREASURY. Example: for 2% interest rate, input: 0.02.
-Days to expire: how many days until the option expires.
-Volatility: the implied volatility of the option bought/sold. Example: for 45% implied volatility , input: 0.45.
-Day of entry: A calendar day of the month that the option bought/sold.
-Month of entry: Calendar month the option bought/sold.
-Year of entry: Calendar year the option bought/sold.
-% of Max Profit/Loss: Profit/loss line defined by the user. Minimum input (-0.95) ; maximum input (0.95).
Example: In this spread, -0.95 means, 95% of the options strategy maximum loss is reached and, 0.95 means, 95% of the options strategy maximum profit is reached.
After entering all the inputs, press Ok and you should see “Calculation Complete” on the chart.
The user should not change the entry date and days to expire inputs as time passes after he entered the trade.
How to access the indicator?
Use the link below to obtain access to the indicator

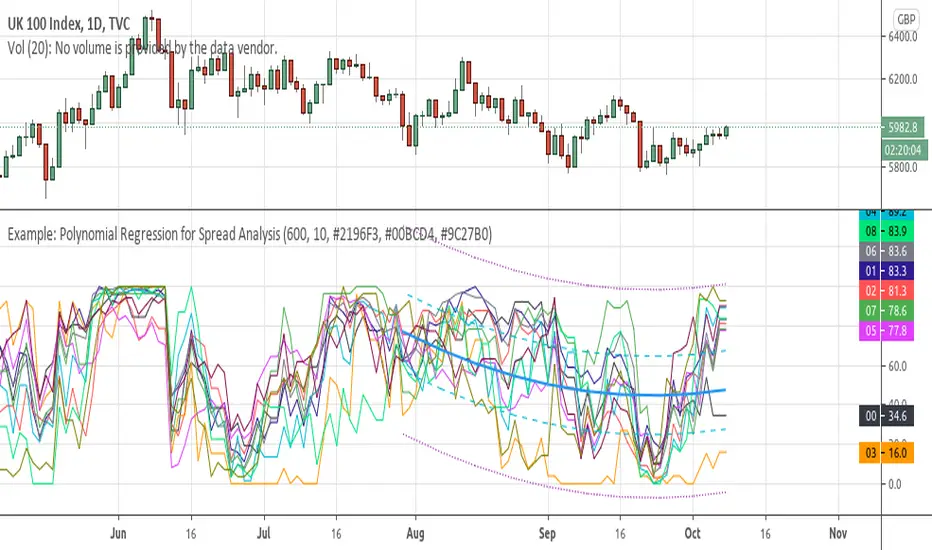
Example: Polynomial Regression for Spread AnalysisExample of applying polynomial regression channel to spreads or hedges between 2 assets.
Libor-EFFRThis is the 3-month Libor minus effective federal funds rate. Traders watch certain spreads for a wider spread to indicate a bad economy.
This is a conceptual indicator that tries to make sense of how important a FRA-OIS spread can be, in this case the Libor-EFFR. It may be completely wrong in calculation and understanding :)
en.wikipedia.org
www.investopedia.com
Libor was derived from the TED Spread less 3-month treasury bills due to Quandl missing updated Libor data.
fred.stlouisfed.org
fred.stlouisfed.org
For the OIS, EFFR is used because it has long historical data and is one of (maybe) the rates used for spread. SOFR was not available at the time but it appears that is what is more common nowadays.
A possible derivative of this indicator would be taking Libor and putting it against something else.
